
INTRODUCTION
Chordoma is a rare slow-growing malignant tumor of notochordal origin. Chordoma can localize at Skull Base (SBC), sacral or spinal axis level, and accounts for approximately 0.1%–0.25% of intracranial tumors and 1%–4% of all malignant bone tumors [1, 2]. The treatment of choice for these tumors is en-bloc resection followed by postoperative radiation therapy [3]. To date chordoma is considered unresponsive to chemotherapy and no validated molecular markers are available to monitor the tumor progression [3]. Several line of evidences suggest that chordoma is characterized by abnormal regulation of notochord tissue. Histological studies have identified persistence of notochord tissue in this tumor that is localized along the axial skeleton, and expresses transcription factors that are also expressed in the notochord. Among them, the most significant is the transcription factor T (encoding for Brachyury), the founder member of the T-box family involved in notochord development [4-6], and recently identified as the pathognomonic marker for chordoma [7]. The genetic basis of T expression in chordoma is largely unknown [7-9], thus the question concerning the identification of early tumorigenic mechanisms leading to chordoma remains open and further pathways should be considered. Indeed, in a recent study other genes were found differentially expressed in both chordomas and related cell lines, among them the α1 collagen type II (COL2A1) was significantly over-expressed [10].
The proper balance between notochord cell proliferation and apoptosis seems to be fundamental for the development and regression of the notochord. The apoptotic process is involved in normal notochord development in Xenopus laevis [11], and in particular the extrinsic apoptotic pathway is conserved and necessary for notochord development in zebrafish [12]. In addition, the expression of tumor necrosis factor receptor (TNFR) FAS and its ligand FASL, leads to the notochord cells regression in the adult rat intervertebral disks [13, 14]. The autocrine-paracrine interaction between Fas and Fasl results in the trimerization and activation of the Fas receptor, which leads the cell to apoptosis [15, 16]. Multiple mechanisms regulate the sensitivity of Fas-expressing cells to Fas-induced apoptosis, including alternative splicing of Fas pre-mRNA: mRNAs lacking exon 6 encode soluble forms of the receptor which, sequestering Fasl, lead to a reduction of Fas signaling, inhibiting apoptosis [17]. Although molecular functions of Fas and Fasl are well known, their role during notochord development has never been investigated in full. Since fas and fasl showed conserved synteny between fish and mammals and also their functional domains are conserved [12], zebrafish (Danio rerio) represents a suitable animal model for functional studies.
The zebrafish notochord starts to form during gastrulation [18] and expresses brachyury (ntl) [19], sonic-hedgehog (shh) [20], and later α1-collagen Type II (col2a1) [21]. During the segmentation period, central cells of the notochord differentiate, acquiring a large vacuole and the notochord becomes surrounded by a sheath of tissue which, in combination with the turgor pressure generated by the vacuolated cells, imparts to the notochord its stiffness [22]. The differentiation correlates to apoptotic events that in the zebrafish happen between 14 and 24 hours post fertilization (14-24 hpf) [23]. As notochord cells become vacuolated, the expressions of ntl, shh and col2a1 are extinguished in the notochord [19], while shh is maintained in the floor plate and col2a1 in the floor plate and the perinotochordal sheath [21, 24].
Here we report the expression analysis of FAS and FASL and their downstream effectors Caspase 8 and Caspase 3 in a cohort of SBC samples, and functional studies of fas and fasl homologs genes during notochord formation in the zebrafish model. The obtained results indicate that FAS/FASL expression is dysregulated in chordoma and that the downstream Caspase 8 and 3 are mostly inactive in the SBCs analyzed. Moreover, simultaneous knock-down of fas and fasl in zebrafish resulted in defects during notochord formation and in vertebral mineralization. Interestingly, we also observed the maintenance of the expression of ntla and col2a1a, the zebrafish homologs of the human T gene and COL2A1, which were found to be specifically up-regulated in chordoma [10]. The obtained evidence strongly supports the implication of FAS/FASL in chordoma tumorigenesis.
RESULTS
FAS/FASL pathway is inactivated in SBCs
In our study we used SBCs samples that were validated at molecular level as bona fide SBCs samples. We also analyzed, by RT-PCR, the expression of the T gene in all the SBCs samples and U-CH1 chordoma cell line we used. In agreement with literature [10] T gene was expressed in all the samples. (Supplementary Material, Suppl. Fig. S1 A), while a pool of three Nuclei Pulposi (NP), commonly accepted as the reference control tissue for chordoma tumor since it is the only adult tissue of notochordal origin [25-28], was not expressing T gene. Western blot analysis, performed in a sub-group of twelve tumors and in U-CH1 cells, revealed the expression of Brachyury in all the samples analyzed, confirming the RT-PCR results (Suppl. Fig. S1 B) and the previous chordoma diagnosis obtained by immunohistochemistry (data not shown).
The transcription of FAS and FASL genes was studied by means of RT-PCR in the pull of NP, in thirty-four SBCs samples and in U-CH1 cells. Most of the analyzed samples (82%) showed FAS expression, while FASL transcript was present in only 38% of samples and U-CH1 cell line expressed both genes (Fig. 1 A). In order to determine the status of activation of Fas/Fasl apoptotic pathway in chordoma, we checked for the expression of the two different isoforms of FAS: the pro-apoptotic (transmembrane) form and the anti-apoptotic (soluble) form [29] by RT-PCR, in the sub-group of 12 tumors and in U-CH1 cells (Fig. 1 B). Interestingly, all the SBCs samples and the U-CH1 cells showed the expression of both, the transmembrane pro-apoptotic and the soluble anti-apoptotic, isoforms of FAS, while NP showed the solely expression of the pro-apoptotic transmembrane isoform (Fig. 1 B).
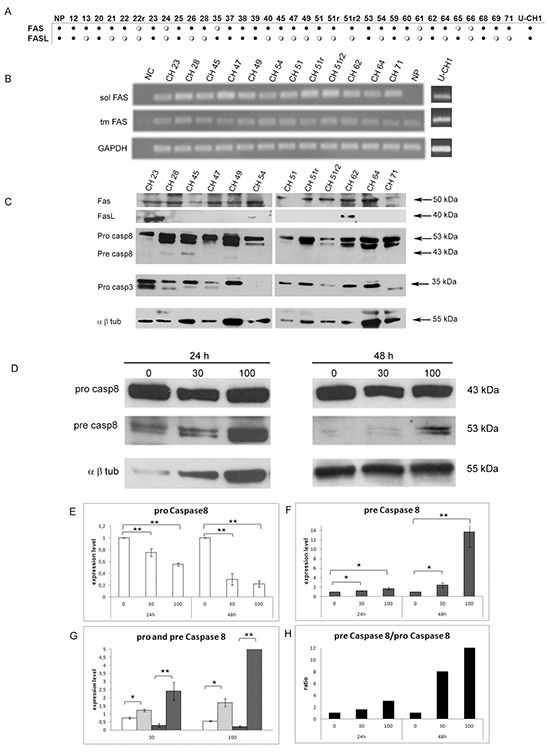
Figure 1: Expression analysis of FAS, FASL and effector Caspase 8 and 3 in a cohort of SBCs and U-CH1 cell line. (A) RT-PCR results of FAS and FASL in 34 SBCs, Nuclei Pulposi (NP) and U-CH1 cell line; black dots indicate gene expression; white dots indicate no gene expression; (B) RT-PCR of antiapoptotic soluble FAS (sol FAS) and proapototic transmembrane FAS (tm FAS) in 12 SBCs, Nuclei Pulposi (NP) and U-CH1 cell line; NC indicates the RT-PCR negative control; (C) western blots of Fas, Fasl, Pro Caspase 8 (pro Casp8), Pre Caspase 8 (pre Casp8) and Pro Caspase 3 (pro Casp3) in 12 SBCs and U-CH1 cell line; the α β Tubulin (α β tub) was included as a housekeeping protein expression. (D) Western blot analysis of Pro caspase 8 (pro casp8), Pre caspase 8 (pre casp8) and α β Tub following U-CH1 cell line treatments with soluble FasL. U-CH1 were treated with soluble Fasl at the doses of 0 ng/mL (untreated control), 30 and 100 ng/mL for 24 and 48 hours, left and right panel respectively. (E) Quantification of relative Pro casp 8 expression levels after normalization to α β Tub in U-CH1 cells trated with Fasl, the white bars represent expression level of Pro casp 8. (F) Quantification of relative Pre casp 8 expression levels after normalization to α β tub in U-CH1 cells trated with Fasl, gray bars indicate the level of Pre casp 8. (G) Representation of the quantification of relative Pro casp 8 and of Pre casp 8 expression levels after normalization to α β Tub divided for each concentration, white bars indicate Pro casp 8 in U-CH1 cells treated with Fasl for 24 hours, white-dithered bars indicate Pre casp 8 treated with Fasl for 24 hours, gray bars indicate Pro casp 8 of Fasl for 48 hours, gray-dithered bars indicate Pre casp 8 treated with Fasl for 48 hours. (H) Ratios between Pre casp 8 and Pro casp 8 after treatments, the black bars represent the ratio for each treatment concentration at each time of exposure. (D-G) The data are expressed as fold increase over the untreated control (0 ng/mL); *p<0,05.
We also determined, in the same samples, the presence of Fas, Fasl Caspase 8 and Caspase 3 proteins by western blot analysis. We found the inactive Caspase 8 (pro Caspase 8) to be expressed in all the samples analyzed, while the active form (pre Caspase 8) was found weakly expressed only in 3 tumors (Fig. 1 C). The inactive form of Caspase 3 was detected in 83% of the samples (10/12 samples) (Fig. 1 C). These results suggest a specific role for the anti-apoptotic Fas in blocking the Caspase cascade and consequently the apoptotic pathway in chordoma samples and UCH1 cell line. To verify if the expression of anti-apoptotic Fas is responsible for this state, we exposed U-CH1 cells to synthetic soluble Fasl (SuperFAS Ligand), which is able to induce apoptosis by competing with the anti-apoptotic (soluble) isoform of Fas. The amount of Pro caspase 8 and of Pre Caspase 8 were evaluated by means of western blot analysis following soluble Fasl treatments at different concentrations and times of exposures. After Fasl treatments the levels of Pre caspase 8 significantly increased together with the significant decrease of Pro Caspase 8 levels in a dose and time exposure dependent manner (Fig. 1 D-G). Moreover, the ratio between Pre Caspase 8 and Pro Caspase 8 increased in a dose and time dependent manner (Fig. 1 H). These findings indicate that the administration of Fasl in U-CH1 cell line is able to counteract the role of the anti-apoptotic form of Fas and induces the apoptotic pathway via Pro Caspase 8, suggesting that this pathway can be modulated in this tumor.
Zebrafish fas and fasl expression and function
Previous studies show contrasting results on the expression of fas and fasl in the zebrafish. Some reported that fas and fasl expression were not seen by whole-mount in situ hybridization (WISH) during the first stages of development [12], while in some cases their transcripts were detected by RT-PCR [12]. To clarify this point, we performed RT-PCR analyses of zebrafish fas and fasl in the whole developing embryo, larva and in some selected adult tissues (Fig. 2 A). We determined that fas is expressed in all the analyzed developmental stages, while fasl expression is modulated during development showing an initial maternal expression, fasl transcripts disappeared in the zygotic stages (30% epiboly-somites stages) to return at 24 hpf. To specifically analyze the expression of fas and fasl in the notochord, we labeled notochord cells by injected the pCS2+ (twhh:GFP) construct [30] and FACS-sorted GFP+ cells from embryos at 24 and 48 hpf, the GFP+ cells were then analyzed by RT-PCR. Expression of fas was detected in the notochord cells at both 24 and 48 hpf, while fasl was expressed only at 48 hpf (Fig. 2 B). Thus, like for the SBCs, in zebrafish embryogenesis the expression of fas is constant, while fasl transcription is modulated in time.
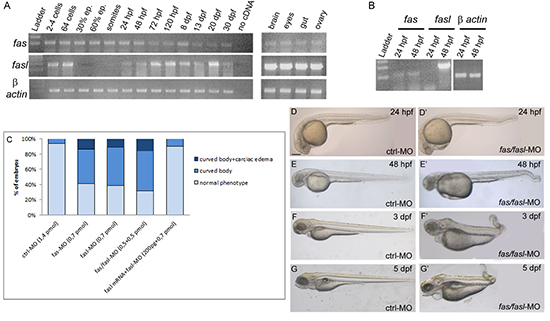
Figure 2: Expression and functional analysis of fas and fasl in zebrafish. (A) RT-PCR performed on different developmental stages and adult tissues. fas is expressed in all the analyzed developmental stages, fasl presents a maternal expression, while the zygotic expression starts from 24 hpf. Both genes are expressed in all the adult tissues analyzed. (B) PCR performed on cDNA of the notochord cells sorted from embryos at 24 and 48 hpf injected with the twhh:GFP/PCS2+ construct. fas is expressed in the notochord cells at both 24 and 48 hpf, while fasl only at 48 hpf. (C) Injected embryos for the single or double knock-down of fas and fasl and for the rescue of the phenotype, were analyzed by scoring the presence/absence of curved bodies and cardiac edema and subdivided into phenotypic classes. (D-G) Embryos and larvae injected with ctrl-MO exhibit normal development at 24 hpf (D), 48 hpf (E), 3 dpf (F) and 5 dpf (G). (D’-G’) Embryos and larvae co-injected with fas/fasl-MO develop defects in the tail curvature due to notochord distortion and cardiac edema. This phenotype is worsening during development.
To investigate the function of fas and fasl in zebrafish development, we knocked-down these genes using oligonucleotide-antisense morpholinos (MO). As a control we injected a non-specific control MO (ctrl-MO). The single fas-MO and fasl-MO injection (0,7 pmol/embryo), or co-injection of fas/fasl-MO at a dosage that did not individually cause morphological defects (0,5 pmol/embryo/each) presented the same defective phenotypes. Therefore, for all the following results, we decided to present the data of the double knock-down (fas/fasl-MO) (Fig. 2 C). The fas/fasl-loss-of-function phenotype was characterized by bent notochord, curved tail and cephalic and cardiac edema (60% N=620, Fig. 2 D-G’), that was worsening during later stages of development. In addition, from 3 dpf, the most evident defect in fas/fasl-MO injected embryos was a high reduction in motility. The ctrl-MO injected larvae, when stimulated with the touch response assay, escaped in the opposite direction (100% N=50, Movie 1) while fas/fasl-MO injected larvae were characterized by an altered motility, swimming in circle (80% N=80, Movie 2). Following the injection of fasl mRNA in fasl-MO injected larvae, we were able to rescue the phenotype, confirming the specificity of the down-regulation (80% N=65, Movie 3). The in-vivo efficiency of the ATG morpholinos was tested with sensor plasmids (Supplementary Material, Suppl. Fig. S2 A-B’, D-E’). Moreover, we designed splice-site morpholinos (splice-fas-MO and splice-fasl-MO; 1 pmol/embryo/each) that presented consistent phenotypes with the ATG morpholinos (80% altered motility N=400, 55% bent notochord, curved tail and cephalic and cardiac edema, N=320), confirming the specificity of the loss-of-functions. The efficiency of the splice-site-MOs was tested by means of RT-PCR (Supplementary Material, Suppl. Fig. S2 C,F).
fas/fasl-MO-injected embryos share similarities with chordoma tumors.
The most direct readout for the knock-down of the apoptotic genes fas/fasl is a decrease in apoptosis. Thus, we performed TUNEL assay at different developmental stages. To exclude undesirable off-target effects elicited by the injection of morpholino molecules, such as activation of the p53 protein [31], we injected p53-MO together with fas/fasl-MO and with control-MO. We observed that apoptosis was reduced in fas/fasl/p53-MO injected embryos compared to the control/p53-MO at the same developmental stages (50% N=60, Supplementary Material, Suppl. Fig. S3).
Next, we sought to analyze the expression profile of the genes that have been found altered in the chordoma tumors, such as the T gene and COL2A1. Both the zebrafish homolog ntla and col2a1a were found to be significantly up-regulated in fas/fasl-MO-injected-embryos by qPCR analyses (p≤0,05) (Fig. 3 A-B). These results were confirmed by WISH analyses. The expression of ntla, that normally progressively decays from 20 hpf, was maintained at high levels in fas/fasl-MO injected embryos (50% of fas/fasl-MO-injected, total N= 30) (Fig. 3 C-D). Moreover, the expression of col2a1a, that normally diminished from 30 hpf and disappeared at 48 hpf [21, 32], persisted in the peri-notochordal sheath in fas/fasl-MO injected embryos at 48 hpf (70% of fas/fasl-MO-injected, total N= 60) (Fig. 3 E-F).
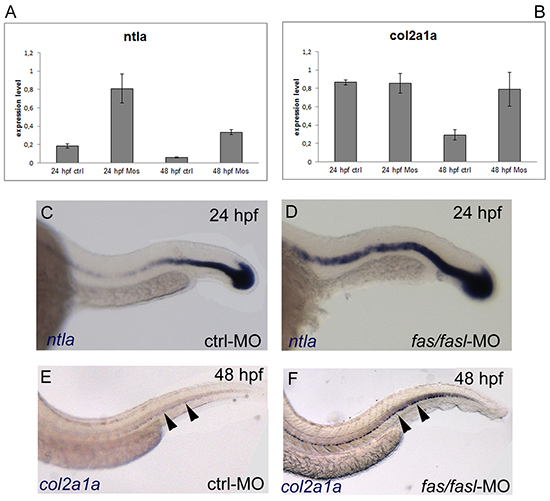
Figure 3: ntla and col2a1a are up-regulated in fas/fasl-MO injected embryos. (A-B) q-PCR analysis of ntla (A) and col2a1a (B) show an upregulation of the expression in fas/fasl-MO injected embryos for both genes (*p≤0,05). (C-D) WISH analysis show persistent expression of the notochord marker ntla in the notochord of fas/fasl-MO injected embryos at 24 hpf (D) compared to control embryos (C). (E-F) WISH analysis shows persistent expression of the chordamesoderm marker col2a1a in the peri-norochordal sheath of fas/fasl-MO injected embryos (F, arrowheads) compared to control embryos in which col2a1a expression normally decreases at 48 hpf (E, arrowheads).
Notochord architecture and surrounding tissues are affected in fas/fasl-MO injected larvae
fas and fasl are expressed in the notochord, thus we analyzed possible defects caused by fas/fasl-loss-of-function in this structure and in the surrounding tissues. Taking advantage of the ET30:Et(kita:GalTA4,UAS:mCherry)hzm (ET30) transgenic line, where the fluorescent protein mCherry is expressed in notochord cells [33, 34], we were able to analyze the morphology of the notochord. Notwithstanding the curved tails and the notochord bents observed in fas/fasl-MO injected embryos starting from 24 hpf, no evident morphological defects in the notochord cells were shown before 48 hpf (data not shown). However, later during development (i.e. 4 dpf), the fas/fasl-MO injected larvae (80%, N=70) presented notochord undulations and multi-cell-layer jumps (Fig. 4 B) instead of the characteristic single “stack-of-coins” structure seen on ctrl-MO injected larvae (N=70) (Fig. 4 A). Moreover, longitudinal sections of fas/fasl-MO injected larvae at 4 dpf showed that the entire notochord structure was bigger in comparison to ctrl-MO injected larvae and the larger vacuolated cells were not properly connected to the peri-notochordal sheath, indicative of a failure of the cells to differentiate (Fig. 4 C-D). Indeed, the peri-notochordal basement membrane of fas/fasl-MO injected larvae at 4 dpf, was abnormally undulated and thicker than the ctrl-MO injected larvae, in particular in areas where the profile of the notochord is bent (Fig. 4 C-D). The phenotypic defects in notochord structure are specifically caused by fas/fasl-loss-of-function as rescued larvae (75% N=120) did not present such defects (Supplementary material, Suppl. Fig. S4 A-C). We considered the possibility that the defects in notochord morphology might have resulted from a general developmental delay, although fas/fasl-loss-of-function embryos did not differ noticeably in overall development from ctrl-MO. To verify this hypothesis we compared the vessels formation in ctrl-MO and fas/fasl-MO injected larvae using Tg(flk1:EGFP) fish line. In both cases, vessels formation at 4 dpf was comparable, (control N=40; fas/fasl-MO N=40) [35], as shown in the Suppl. Fig. S5, indicating that both ctrl-MO and fas/fasl-MO injected larvae were at the same developmental stage.
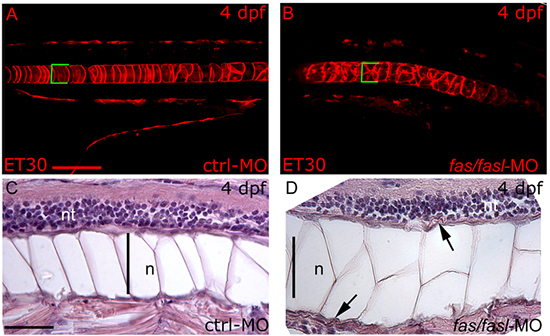
Figure 4: fas and fasl loss-of-function affects notochord differentiation and peri-notochordal sheath integrity. (A-B) Confocal images of the mCherry-positive-notochord cells of the ET30 transgenic line at 4 dpf. In ctrl-MO injected larvae (A), the notochord shows its characteristic “stack-of-coins” structure while fas/fasl-MO injected larvae (B) present notochord undulations and form multi-cell-layer jumps. The same region of the notochord has been analyzed in ctrl-MO and fas/fasl-MO injected larvae, as shown by the yolk extension. (A-B) Squared brackets indicate the diameter of the notochord. (C-D) Longitudinal sections hematoxilin-eosin (HE) stained of ctrl-MO and fas/fasl-MO injected larvae at 4 dpf. The notochord (n) of morphants is thicker, and vacuolated cells are not properly connected to the peri-notochordal sheat that is abnormally undulated (arrowheads, D), in comparison to ctrl-MO injected larvae (C). (A-D) lateral views, anterior to the left, dorsal up. Scale bars: (A-B) 100 μm, (C-D) 50 μm.
Muscle organization and primary motoneuron axonal projections are altered in fas/fasl-MO injected larvae
The impaired motility of fas/fasl-MO injected larvae from 3 dpf, prompted us to analyze the muscle structure by means of histological sections: at 4 dpf fas/fasl-MO injected larvae showed muscles with a disorganized alignment of myofibrils that appeared undulated and unusually oriented (80% N=40) compared to the controls (N=40) (Fig. 5 A-B). Motility impairment could be due to motoneuron defects, thus we analyzed primary motoneurons and their axon (visualized by the znp1 antibody); they formed in a proper number and position in fas/fasl-MO injected embryos (N=30) at 24 hpf compared to the controls (N=30). However, the disorganization in muscle and myosepta caused a disorganized branching of axonal projections (Fig. 5 C-D). Rescued larvae (89% N=170 for muscle defects, Supplementary material, Suppl. Fig. S4 D-F; 75% N=80 for motoneuron defects, Supplementary material, Suppl. Fig. S4 G-I) did not present such defects.
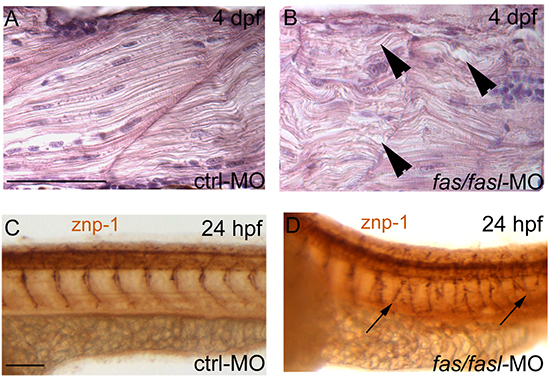
Figure 5: Defects in notochord differentiation prevent normal muscle structure and primary motoneuron axon projections. (A-B) Longitudinal histological sections, HE stained. At 4 dpf, muscle fibres in fas/fasl-MO injected larvae are disorganized, undulated and oriented in opposite directions (B, arrowheads) in comparison to ctrl-MO injected larvae (A). (C-D) Axonal projections of primary motoneurons visualized by znp1 antibody present branching defects in fas/fasl-MO injected embryos at 24 hpf (arrows). (A-D) lateral views, anterior to the left, dorsal up. Scale bar: 100 μm.
Notochord defects in fas/fasl-MO injected larvae lead to abnormal vertebral development
Several evidences suggest that the notochord has been directly implicated in the formation of vertebrae and intervertebral discs [36, 37]. Therefore, we verified whether defects in notochord differentiation in fas/fasl-MO injected larvae could influence subsequent vertebral formation. We calcein stained fas/fasl-MO injected larvae at early (13 dpf, around 5 mm, Fig. 6 A-B’) and complete vertebral mineralization (18 dpf, around 7-9 mm, Fig. 6 C-E) and we showed defects in vertebrae formation with extensive vertebrae fusion (15% N=30, Fig. 6 B,B’,D) in comparison to ctrl-MO injected larvae (0% N=30, Fig. 6 A,A’,C). Also the defects in vertebrae mineralization are specifically caused by fas/fasl-loss-of-function as the majority of rescued larvae did not present such defects (79% N=28), (Supplementary material, Suppl. Fig. S4 J-L).
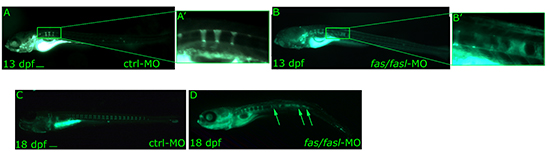
Figure 6: Analyses of notochord segmentation and vertebral formation following fas/fasl loss of function. (A-D) Calcein staining shows notochord segmentation by formation of calcified chordacentra in an antero-posterior fashion. The process of vertebrae formation starts at around 11 dpf (3 mm) and is completed at around 18-21 dpf (7-9 mm). fas/fasl-MO-injected larvae at early (B-B’ higher magnification) and complete vertebral mineralization (D) show significant defects in vertebrae formation with extensive vertebrae fusion (arrows, D) in comparison to ctrl-MO injected larvae (A, A’ higher magnification, C). Scale bar: 100 μm.
DISCUSSION
Chordoma is a rare malignant tumor that is thought to arise from notochord remnants. The notochord regression is regulated by several mechanisms, and among them, the apoptotic process plays a relevant role [11, 38, 39]. In particular, the Fas/Fasl pathway was implicated in the regression of the notochord cells during adult nucleus pulposus formation in rat [13]. In this work, we demonstrated for the first time that FAS/FASL expression was dysregulated in chordoma, mainly for the absence of FASL. Furthermore, all SBC specimens and the U-CH1 cell line, including those expressing FASL, showed the expression of the FAS soluble anti-apoptotic isoform that was not detected in the reference tissue of NP. It is known that the soluble anti-apoptotic form of Fas competes with the transmembrane pro-apoptotic form in binding FASL and therefore inhibits apoptosis [17]. The prevalent expression of the inactive form of the downstream effectors Caspase 8 and Caspase 3 confirmed the inactivation status of the related apoptotic pathway in the SBCs analyzed. We were able to revert this status in U-CH1 cells by exposition to synthetic soluble Fasl, activating Caspase 8 in a time and dose dependent manner, showing that, in vitro chordoma cell line, the FAS/FASL pathway can be modulated.
The expression studies performed in our cohort of SBCs suggest a possible involvement of FAS and FASL in chordoma onset. However, from in vitro and chordoma samples we could not determine if this genetic expression profile is the cause or the result of the SBC [7]. Aiming to elucidate this ontological question of cancer etiology, we began to investigate the effects of the dysregulation of FAS/FASL in notochord during embryo development. We performed functional assays in the zebrafish model. We firstly evaluated the expression of fas and fasl in zebrafish whole embryos and larvae. The expression of fas and fasl in brain, eyes, gut and ovary of the adult fish is conserved in mammals, indicating a similar role for FAS/FASL during evolution [14, 40-43]. Interestingly, fasl expression is modulated during development while fas is expressed in all stages analyzed, suggesting the importance of a specific activation of this factor. Moreover, we detected fas and fasl expression in the zebrafish notochord sorted cells, pinpointing for the first time the involvement of these two genes in the processes of notochord formation.
By using morpholino technology, we performed loss-of-function experiments to analyze notochord defects in zebrafish embryos and larvae. As expected, a reduction of apoptosis was observed in fas/fasl-MO injected embryos. In addition, we found a significant up-regulation of two homologs of chordoma markers, ntla (T) and col2a1a (COL2A1) [10]. The maintained expression of these two genes in fas/fasl-MO-injected embryos in a developmental stage in which they normally diminished and disappeared, might suggest molecular alteration common to chordoma. The up-regulation of the col2a1a, as well as deregulation of other genes expressed in the notochord or in the perinotochordal sheath, such as col15a1, col27a1a and col27a, are linked to defects of the notochord sheath and aggregation of protein in notochord cells, as demonstrated in previous reports [44, 45]. Consistently with these works, we found severe alterations of the notochord morphology that presented various degrees of packed cells that were larger and not properly connected to the perinotochordal sheath. In addition, the loss-of-function of fas/fasl produced disorganized myofibrils and an aberrant primary motoneurons branching, resulting in motility impairment. Indeed, both muscle and motoneuron formation require proper signaling from the notochord, and it has been demonstrated that also the integrity of the perinotochordal sheath is essential for the axon projections [46-49].
Transient depletion of fas/fasl resulted, later in development, in vertebrae mineralization defects instead of the normal notochord ossification [32]. fas/fasl loss-of function might alter the proper notochord cells disappearance during notochord regression, similarly to what happens to the notochord cells in the nucleus pulposus of rat [13]. This might cause the mechanical weakening of notochord sheath leading to defects in vertebrae formation [48]. It is worth to note, that all the phenotypic defects we observed are specifically caused by a transient fas/fasl-loss-of-function [59]. Our data show how transient deregulation of this pathway during embryo development can cause a cascade of effects seen much later in the larvae and reminiscent of some of chordoma characteristics. However, due to the transient condition of our loss-of-function we did not obtained a chordoma-like tumor in the zebrafish.
In a recent work, a zebrafish model of chordoma has been obtained constitutively expressing the HRAS pathway [50].
The upregulation of T gene, involved in the regulation of cell cycle control, might lead to notochord cells proliferation [5, 51]; in alternative we speculated that the defects in notochord regression, through apoptosis alterations, may maintain proliferating notochord cells expressing the T gene, or both these possibilities [7]. Neverteless, the evidence here provided indicates the early role of FAS/FASL pathway during embryogenesis as a possible cause of chordoma formation [57, 58], and suggests the need for persistent dysregulation of FAS/FASL pathway in later stages as a determinant for tumor onset. Several mechanisms such as methylation and/or post-transcriptional expression modulation by specific miRNAs, control the expression of FAS and FASL [52-54]. The dysregulation of one or more of those mechanisms during development and later in chordoma might be the cause of FAS/FASL altered expression. In turn, a dysregulation of FAS alternative splicing is caused also by the enhanced expression of the anti-apoptotic FAS isoform in chordoma [29, 55, 56].
This study provides new insights on notochord biology and indicates the implication of Fas/Fasl in chordoma, addressing future areas of investigation to identify new targets for chordoma treatment and diagnosis.
MATERIAL AND METHODS
Patients
The cohort includes fourteen SBCs patients described for the first time in this study and seventeen patients previously reported [25], for a total of thirty-one patients with SBC (Table 1), each of whom underwent surgery at the Department of Neurosurgery of the San Raffaele Hospital in Milan, Italy, between August 1997 and December 2011. Twenty-three patients were males (71.9%), six were females (28.1%); ages ranged from 19 to 71 years (average 47, 7 years; SD = 15.24). Six patients (19%) had been treated previously. The histological specimens were reviewed in each case by the same pathologist for the presence of specific immunohistochemical markers, diagnostic of chordoma (S-100, vimentin, EMA, cytokeratine). The Nuclei Pulposi (NP) were obtained after surgical excision of intervetebral herniated disks from three young individuals. The expression study carried out on the surgical specimens did not impact neither the course of surgical operations nor the decision about post-operative adjuvant therapies. Informed consent for molecular genetic researches on the surgical specimens was signed by all the patients before operations.
Table 1 Cohort of patients
Patient |
Sex |
Age |
Histology |
Recurrence* |
Death* |
Description |
Abbreviations: M, male; F, female; *months after surgery |
||||||
12 |
M |
67 |
chondroid |
- |
- |
Riva et al. 2003 |
13 |
M |
55 |
classic |
- |
- |
Riva et al. 2003 |
20 |
M |
55 |
classic |
41 |
47 |
Riva et al. 2003 |
21 |
M |
46 |
classic |
- |
- |
Riva et al. 2003 |
22 |
M |
40 |
classic |
22 |
30 |
Riva et al. 2003 |
23 |
M |
56 |
- |
- |
- |
Riva et al. 2003 |
24 |
F |
29 |
chondroid |
- |
- |
Riva et al. 2003 |
25 |
M |
27 |
chondroid |
24 |
53 |
Riva et al. 2003 |
26 |
M |
52 |
classic |
- |
- |
Longoni et al. 2008 |
28 |
F |
69 |
- |
- |
- |
Longoni et al. 2008 |
35 |
F |
25 |
classic |
- |
- |
Longoni et al. 2008 |
37 |
F |
41 |
classic |
- |
- |
Longoni et al. 2008 |
38 |
M |
31 |
classic |
- |
- |
Longoni et al. 2008 |
39 |
F |
32 |
chondroid |
- |
- |
Longoni et al. 2008 |
40 |
F |
30 |
chondroid |
16 |
- |
Longoni et al. 2008 |
45 |
M |
52 |
chondroid |
5 |
7 |
Longoni et al. 2008 |
47 |
M |
66 |
- |
- |
- |
This work |
49 |
M |
46 |
classic |
- |
- |
Longoni et al. 2008 |
51 |
M |
55 |
classic |
36 |
- |
This work |
53 |
M |
47 |
chondroid |
- |
- |
This work |
54 |
M |
nd |
- |
- |
- |
This work |
59 |
F |
69 |
chondroid |
- |
- |
This work |
60 |
F |
61 |
classica |
- |
0 |
This work |
61 |
M |
65 |
classica |
- |
- |
This work |
62 |
M |
71 |
classic |
- |
- |
This work |
64 |
M |
46 |
classic |
- |
- |
This work |
65 |
M |
49 |
classic |
- |
- |
This work |
66 |
M |
45 |
- |
- |
- |
This work |
68 |
M |
20 |
- |
- |
- |
This work |
69 |
M |
62 |
- |
- |
- |
This work |
71 |
M |
19 |
classic |
- |
- |
This work |
U-CH1 chordoma cell line and treatments
Chordoma cell line U-CH1 was obtained from the Chordoma Foundation and it was maintained in IMDM (Invitrogen 12440) / RPMI1640 (Sigma-Aldrich Milan, Italy) four to one ratio (4:1), supplemented with 10% FBS (EuroClone, Milan, Italy) and 100 u/mL penicillin/streptomycin (Sigma-Aldrich) at 37°C and 5% CO2 [10]. The cells were seeded in coated plates or flasks (Collagen Cellware Becton DickinsonSan Jose, CA) and treated with SuperFAS Ligand (soluble Fasl, Enzo Life Science, Farmingdale, NY) at different times and concentrations. SuperFAS Ligand was reconstituted with 50 μL sterile water to 0.1 mg/mL and stored at −20°C, according to the manufacturer's instructions.
Animals
Breeding zebrafish was maintained at 28°C on a 14 h light/10 h dark cycle. Embryos were collected by natural spawning, staged and raised according to Kimmel and colleagues [18], in agreement with EU Directive 2010/63/EU for animal. We express the embryonic ages in somites (s), hours post fertilization (hpf) and days post fertilization (dpf). Fish lines were described in Supplementary Materials.
RT-PCR
Total RNA from tumor samples was extracted from frozen samples by using Trizol reagent (Life Technologies, Carlsbad, CA, USA) according to the producer’s instructions. Reverse transcription (RT) was carried out on 1 μg of total RNA using the iScriptTM cDNA Synthesis kit (Bio-Rad Laboratories Inc. Barkeley, CA, USA). The specific PCR primers for FAS isoforms were already reported [17]. FASL and T specific primers are reported in Supplementary Table 1. Total RNA from 17 zebrafish samples (an average of 30 embryos/larvae per sample) was extracted with the TOTALLY RNA isolation kit (Ambion, Life Technologies, Paisley UK), treated with RQ1 RNase-Free DNase (Promega, Madison WI, USA) and reverse transcribed using SuperScript II RT (Life Technologies, Carlsbad CA, USA). Primers list in Supplementary Table 1.
RT and quantitative real time PCR (qPCR)
RTs were performed using 1 μg of DNase treated (DNA-free™, Ambion) total RNA in presence of random hexamers (Life Technologies) and SuperScript II reverse transcriptase (Life Technologies). qPCRs were carried out as reported in Malafoglia [57] and colleagues and also Supplementary Materials.
Western blot analysis
The whole proteins extraction was performed on fresh/frozen specimens from the new enrolled patients, which were disaggregated into a SDS-PAGE sample buffer containing protease inhibitors as in Bellipanni and colleague [58]. The antibodies (Ab) used and specific dilutions are reported in Supplementary Materials.
In situ hybridization, histological analysis and immunohistochemistry
Whole mount in situ hybridization (WISH) experiments, were carried out as described by Thisse and colleagues [59]. Immunohystochemistry was carried out as described in Panzer and colleagues [60]. Probes and antibodies were described in Supplementary Materials. For histological sections, embryos/larvae were re-fixed in 4% PFA, dehydrated and stored in methanol, wax embedded, sectioned (5-8 μm) and Hematoxilin/Eosin (H/E) stained. Images acquirement was described in Supplementary Materials.
TUNEL staining
For TUNEL assay, a minimum of 24 embryos per treatment were fixed with 4% PFA for 2 h at room temperature. Embryos were washed with methanol at −20°C and then twice with PBC (0.001% Triton X-100, 0.1% sodium citrate in PBS) for 10 minutes. Staining for apoptotic cells was performed using the In situ Cell Death Detection Kit (Roche) according to manufacturers’ instructions.
Injections
Injections were carried out on 1- to 2-cell stage embryos; the dye tracer rhodamine dextran was also co-injected. The PCS2+ plasmid containing twhh:GFP construct was kindly provided by J. Du [37] and injected at a concentration of 200 pg/embryo. Morpholino description and validation was performed as described in Supplementary Materials. Morpholino sequences list in Supplementary Table 2.
Sorting
70-100 embryos at 24 and 48 hpf injected with the pCS2+ (twhh:GFP) construct, were dissociated and GFP+ cells were sorted using a Vantage Sorter SE (Becton-Dickinson, San Jose CA, USA) at a flow rate of 3000 cells per second. GFP was exited at 488 nm using an argon laser. Cells dissociated from wild-type embryos were used to set the gating to exclude green autofluorescence. RNA was extracted from sorted cells with the micro-RNAeasy kit (Qiagen, Venlo, Netherlands), retro-transcribed with the iSCRIPTtm cDNA synthesis kit (Biorad).
Confocal images
Live ET30:Et(kita:GalTA4,UAS:mCherry)hzm transgenic fish were anesthetized in a 0, 5% tricaine solution in fish water, mounted in a 1% low melt agarose and imaged on a Leica TCS NT confocal microscope.
Calcein staining
Calcein (Sigma-Aldrich, St. Louis MO, USA) staining was done according to Du and colleagues [30, 37].
Statistical analysis
For qPCR experiments, data were statistically analyzed applying a two-tailed T-test setting p≤0.05 as significant. Data were analyzed using the comparative ΔΔCt method both t test and SD values refer to samples triplicates.
ACKNOWLEDGEMENTS
This study was found by the Italian Association for Cancer Research, AIRC (Associazione Italiana per la Ricerca sul Cancro) (grant number IG 10525 to PR).
Authors contributions: conceived and designed the experiments: LF, AP, FC and PR. Performed the experiments: LF, AP, LL. Provided samples of tumors and nuclei pulposi: NB, PM. Analyzed the data: LF, AP, LL, GB, FC and PR. Wrote the paper: LF, AP, GB and PR. Supervised the research project and paper drafting: AG, FC and PR.
The authors thank Dr. M. Venturin and Dr. G. Gaudenzi for their bioinformatics support, S. Milanesi, V. Melzi and Dr. F. Gagliardi for their technical contribution, Prof. J. Topczewski for providing col2a1a and col2a1b probes, Prof. J. Du for providing twhh-GFP construct, Prof. R. W. Koster and Dr. M. Mione for providing the ET30 transgenic line.
REFERENCES
1. Bydon M, Papadimitriou K, Witham T, Wolinsky JP, Bydon A, Sciubba D and Gokaslan Z. Novel therapeutic targets in chordoma. Expert Opin Ther Targets. 2012.
2. Walcott BP, Nahed BV, Mohyeldin A, Coumans JV, Kahle KT and Ferreira MJ. Chordoma: current concepts, management, and future directions. Lancet Oncol. 13(2):e69–76.
3. Gagliardi F, Boari N, Riva P and Mortini P. Current therapeutic options and novel molecular markers in skull base chordomas. Neurosurg Rev. 2012; 35(1):1–13; discussion 13–14.
4. Salisbury JR. [Embryology and pathology of the human notochord]. Ann Pathol. 2001; 21(6):479–488.
5. Nelson AC, Pillay N, Henderson S, Presneau N, Tirabosco R, Halai D, Berisha F, Flicek P, Stemple DL, Stern CD, Wardle FC and Flanagan AM. An integrated functional genomics approach identifies the regulatory network directed by brachyury (T) in chordoma. J Pathol. 2012.
6. O'Donnell P, Tirabosco R, Vujovic S, Bartlett W, Briggs TW, Henderson S, Boshoff C and Flanagan AM. Diagnosing an extra-axial chordoma of the proximal tibia with the help of brachyury, a molecule required for notochordal differentiation. Skeletal Radiol. 2007; 36(1):59–65.
7. Szuhai K and Hogendoorn PC. ’The chicken or the egg?’ dilemma strikes back for the controlling mechanism in chordoma(#). J Pathol. 228(3):261–265.
8. Presneau N, Shalaby A, Ye H, Pillay N, Halai D, Idowu B, Tirabosco R, Whitwell D, Jacques TS, Kindblom LG, Bruderlein S, Moller P, Leithner A, Liegl B, Amary FM and Athanasou NN, etal. Role of the transcription factor T (brachyury) in the pathogenesis of sporadic chordoma: a genetic and functional-based study. J Pathol. 2011; 223(3):327–335.
9. Yang XR, Ng D, Alcorta DA, Liebsch NJ, Sheridan E, Li S, Goldstein AM, Parry DM and Kelley MJ. T (brachyury) gene duplication confers major susceptibility to familial chordoma. Nat Genet. 2009; 41(11):1176–1178.
10. Bruderlein S, Sommer JB, Meltzer PS, Li S, Osada T, Ng D, Moller P, Alcorta DA and Kelley MJ. Molecular characterization of putative chordoma cell lines. Sarcoma. 2010; :630129.
11. Malikova MA, Van Stry M and Symes K. Apoptosis regulates notochord development in Xenopus. Dev Biol. 2007; 311(2):434–448.
12. Eimon PM, Kratz E, Varfolomeev E, Hymowitz SG, Stern H, Zha J and Ashkenazi A. Delineation of the cell-extrinsic apoptosis pathway in the zebrafish. Cell Death Differ. 2006; 13(10):1619–1630.
13. Kim KW, Kim YS, Ha KY, Woo YK, Park JB, Park WS and An HS. An autocrine or paracrine Fas-mediated counterattack: a potential mechanism for apoptosis of notochordal cells in intact rat nucleus pulposus. Spine (Phila Pa 1976). 2005; 30(11):1247–1251.
14. Inui Y, Nishida K, Doita M, Takada T, Miyamoto H, Yoshiya S and Kurosaka M. Fas-ligand expression on nucleus pulposus begins in developing embryo. Spine (Phila Pa 1976). 2004; 29(21):2365–2369.
15. Kaufmann T, Strasser A and Jost PJ. Fas death receptor signalling: roles of Bid and XIAP. Cell Death Differ. 2012; 19(1):42–50.
16. Lavrik IN and Krammer PH. Regulation of CD95/Fas signaling at the DISC. Cell Death Differ. 2012; 19(1):36–41.
17. Izquierdo JM and Valcarcel J. Fas-activated serine/threonine kinase (FAST K) synergizes with TIA-1/TIAR proteins to regulate Fas alternative splicing. J Biol Chem. 2007; 282(3):1539–1543.
18. Kimmel CB, Ballard WW, Kimmel SR, Ullmann B and Schilling TF. Stages of embryonic development of the zebrafish. Dev Dyn. 1995; 203(3):253–310.
19. Schulte-Merker S, Ho RK, Herrmann BG and Nusslein-Volhard C. The protein product of the zebrafish homologue of the mouse T gene is expressed in nuclei of the germ ring and the notochord of the early embryo. Development. 1992; 116(4):1021–1032.
20. Odenthal J, Haffter P, Vogelsang E, Brand M, van Eeden FJ, Furutani-Seiki M, Granato M, Hammerschmidt M, Heisenberg CP, Jiang YJ, Kane DA, Kelsh RN, Mullins MC, Warga RM, Allende ML and Weinberg ES, et al. Mutations affecting the formation of the notochord in the zebrafish, Danio rerio. Development. 1996; 123:103–115.
21. Yan YL, Hatta K, Riggleman B and Postlethwait JH. Expression of a type II collagen gene in the zebrafish embryonic axis. Dev Dyn. 1995; 203(3):363–376.
22. Glickman NS, Kimmel CB, Jones MA and Adams RJ. Shaping the zebrafish notochord. Development. 2003; 130(5):873–887.
23. Cole LK and Ross LS. Apoptosis in the developing zebrafish embryo. Dev Biol. 2001; 240(1):123–142.
24. Krauss S, Concordet JP and Ingham PW. A functionally conserved homolog of the Drosophila segment polarity gene hh is expressed in tissues with polarizing activity in zebrafish embryos. Cell. 1993; 75(7):1431–1444.
25. Longoni M, Orzan F, Stroppi M, Boari N, Mortini P and Riva P. Evaluation of 1p36 markers and clinical outcome in a skull base chordoma study. Neuro Oncol. 2008; 10(1):52–60.
26. Aydemir E, Bayrak OF, Sahin F, Atalay B, Kose GT, Ozen M, Sevli S, Dalan AB, Yalvac ME, Dogruluk T and Ture U. Characterization of cancer stem-like cells in chordoma. J Neurosurg. 2012; 116(4):810–820.
27. Choi KS, Cohn MJ and Harfe BD. Identification of nucleus pulposus precursor cells and notochordal remnants in the mouse: implications for disk degeneration and chordoma formation. Dev Dyn. 2008; 237(12):3953–3958.
28. Bayrak OF, Gulluoglu S, Aydemir E, Ture U, Acar H, Atalay B, Demir Z, Sevli S, Creighton CJ, Ittmann M, Sahin F and Ozen M. MicroRNA expression profiling reveals the potential function of microRNA-31 in chordomas. J Neurooncol. 2012;
29. Izquierdo JM. Cell-specific regulation of Fas exon 6 splicing mediated by Hu antigen R. Biochem Biophys Res Commun. 2011; 402(2):324–328.
30. Du SJ and Dienhart M. Zebrafish tiggy-winkle hedgehog promoter directs notochord and floor plate green fluorescence protein expression in transgenic zebrafish embryos. Dev Dyn. 2001; 222(4):655–666.
31. Robu ME, Larson JD, Nasevicius A, Beiraghi S, Brenner C, Farber SA and Ekker SC. p53 activation by knockdown technologies. PLoS Genet. 2007; 3(5):e78
32. Dale RM and Topczewski J. Identification of an evolutionarily conserved regulatory element of the zebrafish col2a1a gene. Dev Biol. 357(2):518–531.
33. Distel M, Wullimann MF and Koster RW. Optimized Gal4 genetics for permanent gene expression mapping in zebrafish. Proc Natl Acad Sci U S A. 2009; 106(32):13365–13370.
34. Santoriello C, Gennaro E, Anelli V, Distel M, Kelly A, Koster RW, Hurlstone A and Mione M. Kita driven expression of oncogenic HRAS leads to early onset and highly penetrant melanoma in zebrafish. PLoS One. 5(12):e15170
35. Thompson MA, Ransom DG, Pratt SJ, MacLennan H, Kieran MW, Detrich HW, Vail B, Huber TL, Paw B, Brownlie AJ, Oates AC, Fritz A, Gates MA, Amores A, Bahary N and Talbot WS, et al. The cloche and spadetail genes differentially affect hematopoiesis and vasculogenesis. Developmental biology. 1998; 197(2):248–269.
36. Hunter CJ, Matyas JR and Duncan NA. The notochordal cell in the nucleus pulposus: a review in the context of tissue engineering. Tissue Eng. 2003; 9(4):667–677.
37. Haga Y, Dominique VJ and Du SJ. Analyzing notochord segmentation and intervertebral disc formation using the twhh:gfp transgenic zebrafish model. Transgenic Res. 2009; 18(5):669–683.
38. Erwin WM, Islam D, Inman RD, Fehlings MG and Tsui FW. Notochordal cells protect nucleus pulposus cells from degradation and apoptosis: implications for the mechanisms of intervertebral disc degeneration. Arthritis Res Ther. 13(6):R215
39. Yamashita M, Mizusawa N, Hojo M and Yabu T. Extensive apoptosis and abnormal morphogenesis in pro-caspase-3 transgenic zebrafish during development. J Exp Biol. 2008; 211:Pt 12. 1874–1881.
40. Takada T, Nishida K, Doita M and Kurosaka M. Fas ligand exists on intervertebral disc cells: a potential molecular mechanism for immune privilege of the disc. Spine (Phila Pa 1976). 2002; 27(14):1526–1530.
41. Ferguson TA and Green DR. Fas-ligand and immune privilege: the eyes have it. Cell Death Differ. 2001; 8(7):771–772.
42. Xerri L, Devilard E, Hassoun J, Mawas C and Birg F. Fas ligand is not only expressed in immune privileged human organs but is also coexpressed with Fas in various epithelial tissues. Mol Pathol. 1997; 50(2):87–91.
43. Green DR and Ferguson TA. The role of Fas ligand in immune privilege. Nat Rev Mol Cell Biol. 2001; 2(12):917–924.
44. Topczewski J, Sepich DS, Myers DC, Walker C, Amores A, Lele Z, Hammerschmidt M, Postlethwait J and Solnica-Krezel L. The zebrafish glypican knypek controls cell polarity during gastrulation movements of convergent extension. Dev Cell. 2001; 1(2):251–264.
45. Stemple DL, Solnica-Krezel L, Zwartkruis F, Neuhauss SC, Schier AF, Malicki J, Stainier DY, Abdelilah S, Rangini Z, Mountcastle-Shah E and Driever W. Mutations affecting development of the notochord in zebrafish. Development. 1996; 123:117–128.
46. Brennan C, Mangoli M, Dyer CE and Ashworth R. Acetylcholine and calcium signalling regulates muscle fibre formation in the zebrafish embryo. J Cell Sci. 2005; 118:Pt 22. 5181–5190.
47. Chan J, Mably JD, Serluca FC, Chen JN, Goldstein NB, Thomas MC, Cleary JA, Brennan C, Fishman MC and Roberts TM. Morphogenesis of prechordal plate and notochord requires intact Eph/ephrin B signaling. Dev Biol. 2001; 234(2):470–482.
48. Pagnon-Minot A, Malbouyres M, Haftek-Terreau Z, Kim HR, Sasaki T, Thisse C, Thisse B, Ingham PW, Ruggiero F and Le Guellec D. Collagen XV, a novel factor in zebrafish notochord differentiation and muscle development. Dev Biol. 2008; 316(1):21–35.
49. Beattie CE and Eisen JS. Notochord alters the permissiveness of myotome for pathfinding by an identified motoneuron in embryonic zebrafish. Development. 1997; 124(3):713–720.
50. Burger A, Vasilyev A, Tomar R, Selig MK, Nielsen GP, Peterson RT, Drummond IA and Haber DA. A zebrafish model of chordoma initiated by notochord-driven expression of HRASV12. Dis Model Mech.
51. Fernando RI, Litzinger M, Trono P, Hamilton DH, Schlom J and Palena C. The T-box transcription factor Brachyury promotes epithelial-mesenchymal transition in human tumor cells. J Clin Invest. 120(2):533–544.
52. Kilic T, Topkaya SN, Ozkan Ariksoysal D, Ozsoz M, Ballar P, Erac Y and Gozen O. Electrochemical based detection of microRNA, mir21 in breast cancer cells. Biosens Bioelectron. 38(1):195–201.
53. Pinto R, Pilato B, Ottini L, Lambo R, Simone G, Paradiso A and Tommasi S. Different methylation and microRNA expression pattern in male and female familial breast cancer. J Cell Physiol. 2012; 228(6):1264–1269.
54. Zhu M, Wang N, Tsao SW, Yuen MF, Feng Y, Wan TS and Man K. Up-regulation of microRNAs, miR21 and miR23a in human liver cancer cells treated with Coptidis rhizoma aqueous extract. Exp Ther Med. 2(1):27–32.
55. Bonnal S, Martinez C, Forch P, Bachi A, Wilm M and Valcarcel J. RBM5/Luca-15/H37 regulates Fas alternative splice site pairing after exon definition. Mol Cell. 2008; 32(1):81–95.
56. Izquierdo JM. Hu antigen R (HuR) functions as an alternative pre-mRNA splicing regulator of Fas apoptosis-promoting receptor on exon definition. J Biol Chem. 2008; 283(27):19077–19084.
57. Malafoglia V, Colasanti M, Raffaeli W, Balciunas D, Giordano A and Bellipanni G. Extreme thermal noxious stimuli induce pain responses in zebrafish larvae. J Cell Physiol. 229(3):300–308.
58. Bellipanni G, Murakami T and Weinberg ES. Molecular dissection of Otx1 functional domains in the zebrafish embryo. J Cell Physiol. 222(2):286–293.
59. Thisse C, Thisse B, Schilling TF and Postlethwait JH. Structure of the zebrafish snail1 gene and its expression in wild-type, spadetail and no tail mutant embryos. Development. 1993; 119(4):1203–1215.
60. Panzer JA, Gibbs SM, Dosch R, Wagner D, Mullins MC, Granato M and Balice-Gordon RJ. Neuromuscular synaptogenesis in wild-type and mutant zebrafish. Dev Biol. 2005; 285(2):340–357.