
INTRODUCTION
Cancer poses a major public health threat worldwide, with 14.9 million incident cancer cases and 8.2 million deaths in 2013 [1]. In low-income and middle-income countries, cancer becomes a major cause of death and will continue to increase as a percentage of deaths [2]. In mainland China, absolute numbers of incident cancer cases and cancer death keep increasing, from 3,586,200 incident cancer cases and 2,186,600 cancer deaths in 2012 to 4,292,000 incident cancer cases and 2,814,000 cancer deaths in 2015 [3, 4]. China is a big country with more than 1.3 billion people. Imbalance of economic development and diversity of lifestyles contribute to apparent differences in the incidences and mortalities of cancer types in different areas of China. Although estimates of cancer burden in China have been reported, the assumptions are limited to a snapshot of the patterns by cancer site in a given year [3–6] or to longitudinal situations of specific cancers and all cancer types for relatively short durations [7–11], making comparisons of long-term trends across all cancer types in accordance with economic development and lifestyle changes difficult.
Shanghai is a large modern city composed of commercial, agricultural, and industrial districts. Yangpu is an industrial district located in the northeastern corner (31°14’N, 121°29’E) of urban Shanghai and adjacent to lower reaches of Huangpu River, with a total of 1,243,757 residents permanently living in the 60.61 km2 of land in 2000. We selected Yangpu as the study field for three reasons. First, Yangpu remains the top among the national demonstration districts for the control of chronic diseases, therefore, historical record of death registration is intact and accurate. Second, population in Yangpu has been quite stable in the past 50 years. Third, highly polluting industries including coal-fired power generation, textiles, steel metallurgy, electroplating, and coal gas production had been introduced after the Second World War when the old municipal government was moved back to Yangpu, and had been shut down in the 1980s due to heavy industrial pollution, making Yangpu an ideal field for investigating the effect of the transition from industrial civilization to ecological civilization on cancer mortality. In the present study, we aimed to characterize the trends in cancer mortality from 1974 to 2014 in Yangpu and to give the projections to the year 2029. This study provides important references for controlling cancers in industry restructuring, middle-income societies.
RESULTS
Descriptive statistics
This study enrolled all registered permanent residents in Yangpu district during 1974-2014, with a total of 40,793,200 person-years. A total of 79,320 cancer death occurred, accounting for 28.80% of all death (275,427 total death). The residents aged 60 years or older during 1974-1984, 1985-1994, 1995-2004, and 2005-2014 accounted for 12.86%, 15.18%, 18.37%, and 22.87%, while cancer death in the 4 decades accounted for 26.12%, 26.65%, 28.51%, and 30.72% of all-cause death, respectively.
Leading causes of cancer death among men and women
The 5 leading causes of cancer death were cancers of the lung & bronchus, stomach, liver, colon & rectum, and esophagus, accounting for 67.50% of all cancer death. Among men, the 5 leading causes of cancer death accounted for 73.43% of all cancer death. Cancer of the breast, rather than esophagus, was one of the 5 leading causes of cancer death among women. Figure 1 shows the first 13 causes of cancer death in the total or sex-stratified populations. Age-standardized mortality rate for all cancers combined was significantly higher in men than in women (153.1/105 vs. 88.8/105, P<0.001). Crude mortalities of cancers of the larynx, bladder, liver, nasopharynx, lung & bronchus, esophagus, lip oral & pharynx, stomach, kidney, and lymphoma were significantly higher in men than in women, with a male-to-female ratio of 6.45, 2.63, 2.50, 2.46, 2.29, 2.05, 1.76, 1.75, 1.54, and 1.35, respectively; the mortalities of cancers of the breast, thyroid, and gallbladder were significantly higher in women than in men, with a male-to-female ratio of 0.01, 0.44, and 0.53, respectively (Supplementary Table 1).
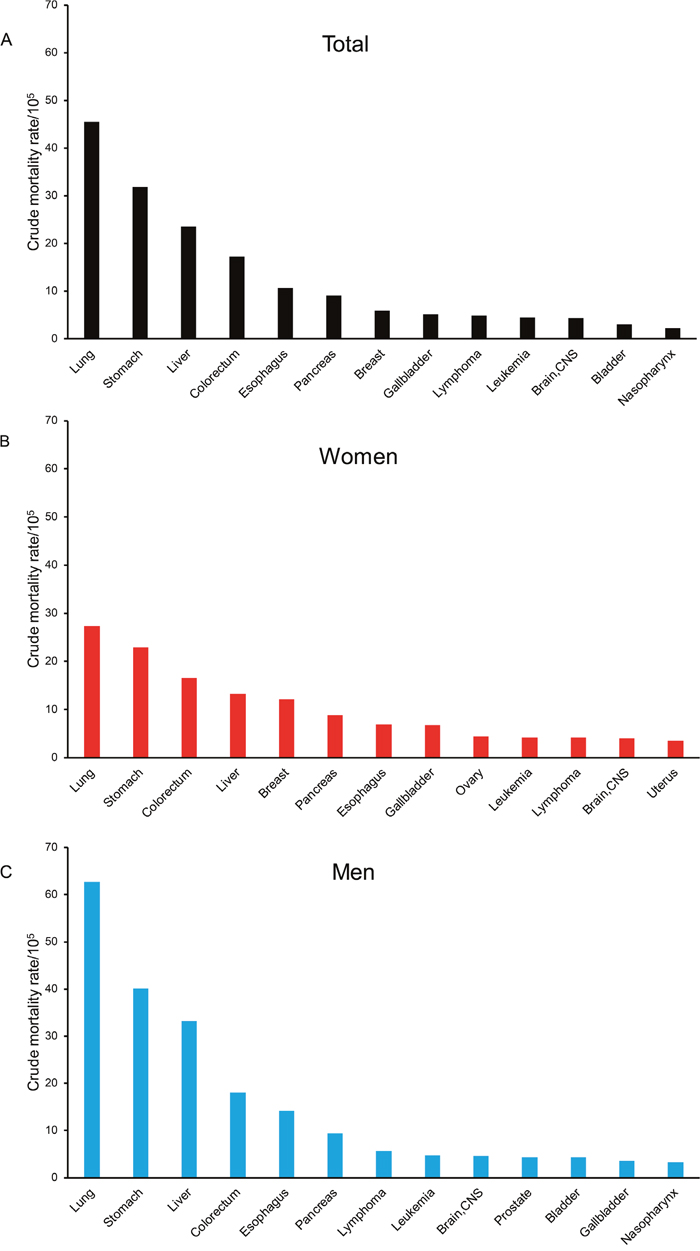
Figure 1: The major causes of cancer death in Yangpu, Shanghai, China during 1974-2014. (A) Total population; (B) female population; (C) male population.
Average death age and age-specific mortality of selected cancers by sex
Average age of the residents died of cancers increased consecutively from 1974 to 2014 (Figure 2A). Cancer death peaked at 70-80 year old groups (70-75 years for men and 75-80 years for women) (Figure 2B). For most cancer types occurred in both sexes, men showed a significantly shorter life expectancy compared with women, except for those with stomach cancer (men vs. women: 68.2 vs. 67.6, P<0.001) (Figure 2C). Liver cancer was the leading cause of cancer death in men younger than 60 years old, followed by lung cancer and stomach cancer. The three cancer types were also the dominant causes of cancer death in men aged from 60 to 74 years. Stomach cancer was the leading cause of cancer death in women younger than 60 years, followed by lung cancer and breast cancer (Table 1). Most common cancer deaths occurred in the population aged from 60 to 74 years.
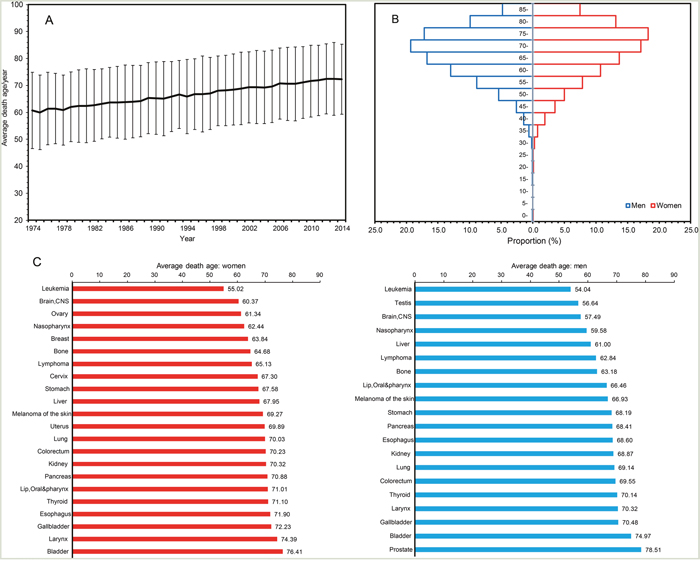
Figure 2: The average death age of permanent residents died of cancers in Yangpu, Shanghai, China, during 1974-2014.
Table 1: Cancer deaths for selected cancers by age groups during 1974-2014
Cancer Site |
Age, y |
All |
||||
|---|---|---|---|---|---|---|
<30 |
30-44 |
45-59 |
60-74 |
≥74 |
||
Women |
||||||
Lung |
11 |
161 |
886 |
2246 |
2101 |
5405 |
Stomach |
64 |
304 |
843 |
1726 |
1592 |
4529 |
Colorectum |
23 |
134 |
540 |
1181 |
1399 |
3277 |
Liver |
13 |
115 |
540 |
1112 |
843 |
2623 |
Breast |
10 |
212 |
824 |
701 |
636 |
2383 |
Pancreas |
10 |
34 |
263 |
703 |
732 |
1742 |
Esophagus |
3 |
11 |
174 |
626 |
551 |
1365 |
Gallbladder |
3 |
17 |
179 |
511 |
626 |
1336 |
Ovary |
19 |
69 |
347 |
271 |
167 |
873 |
Leukemia |
139 |
117 |
175 |
222 |
181 |
834 |
Lymphoma |
43 |
53 |
162 |
296 |
268 |
822 |
Brain, CNS |
76 |
76 |
171 |
294 |
191 |
808 |
All sites |
525 |
1528 |
5947 |
11714 |
11496 |
31210 |
Men |
||||||
Lung |
12 |
290 |
2216 |
6457 |
4197 |
13172 |
Stomach |
35 |
296 |
1588 |
3904 |
2618 |
8441 |
Liver |
68 |
680 |
2529 |
2590 |
1097 |
6964 |
Colorectum |
32 |
151 |
637 |
1477 |
1479 |
3776 |
Esophagus |
1 |
56 |
601 |
1391 |
925 |
2974 |
Pancreas |
4 |
54 |
397 |
893 |
625 |
1973 |
Lymphoma |
66 |
83 |
256 |
479 |
296 |
1180 |
Leukemia |
192 |
117 |
188 |
286 |
202 |
985 |
Brain, CNS |
114 |
86 |
256 |
334 |
173 |
963 |
Prostate |
1 |
2 |
26 |
243 |
646 |
918 |
Bladder |
3 |
6 |
72 |
300 |
519 |
900 |
Gallbladder |
2 |
22 |
116 |
304 |
309 |
753 |
All sites |
671 |
2126 |
9966 |
20620 |
14727 |
48110 |
Trends in cancer mortality during 1974-2014
The rank order of leading causes of cancer death changed rather little over the 4 decades. The 5 leading causes were cancers of the stomach (crude mortality: 371.46/105), lung & bronchus (331.84/105), liver (249.97/105), esophagus (176.60/105), and colon & rectum (73.99/105) during 1974-1984; cancers of the lung & bronchus (404.26/105), stomach (328.42/105), liver (239.18/105), colon & rectum (127.49/105), and esophagus (103.50/105) during 1985-1994; cancers of the lung & bronchus (508.53/105), stomach (305.62/105), liver (240.74/105), colon & rectum (186.46/105), and pancreas (93.23/105) during 1995-2004; cancers of the lung & bronchus (574.39/105), stomach (303.04/105), colon & rectum (287.75/105), liver (229.90/105), and pancreas (154.74/105) during 2005-2014 (Supplementary Table 2). For all cancers combined, crude mortality rates increased steadily; however, the age-standardized mortality rates decreased significantly in both sexes during 1974-2014 (Figure 3A-3B). In women, colorectal cancer, pancreas cancer, ovary cancer, and breast cancer increased whereas esophageal cancer and stomach cancer decreased in the crude and age-standardized mortalities; lung cancer and gallbladder cancer increased in the crude mortalities, whereas liver cancer decreased in the age-standardized mortalities. In men, colorectal cancer, pancreas cancer, and prostate cancer increased whereas esophageal cancer and stomach cancer decreased in the crude and age-standardized mortalities; lung cancer, leukemia, lymphoma, and brain cancer increased in the crude mortalities, whereas liver cancer decreased in the age-standardized mortalities (Figure 3C-3F).
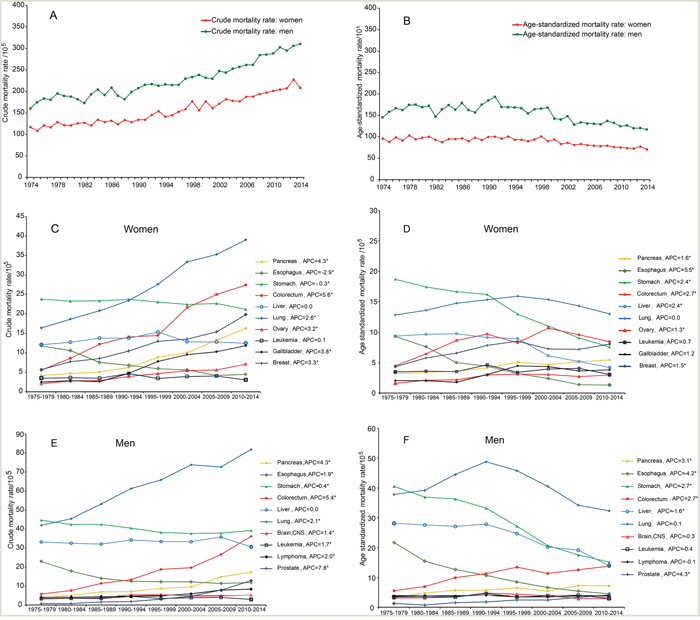
Figure 3: Trends in crude and age-standardized mortality rates for major cancer types in Yangpu, Shanghai, China from 1974 to 2014. (A) Trend in crude mortality rates of cancer in both sexes; (B) trend in age-standardized mortality rates of cancer in both sexes; (C) trend in crude mortality rates of major cancer type in women; (D) trend in age-standardized mortality rates of major cancer type in women; (E) trend in crude mortality rates of major cancer type in men; (F) trend in age-standardized mortality rates of major cancer type in men. APC: annual percentage change.
Joinpoints of the age-standardized mortality rates during 1974-2014
Table 2 summarizes the results of joinpoint analyses for all cancers combined and the analyses of each cancer type. The age-standardized mortality rate for all cancers combined had increased until 1991 and thereafter have been decreasing significantly since 1991. Large increases in the age-standardized mortality rates of cancers of the lung & bronchus in both genders, bladder in men (Annual Percentage Change (APC)=2.3 during 1974-1993; APC=-4.5 after 1993), and brain & central nervous system (CNS) in men (APC=2.7 during 1974-1993; APC=-3.1 after 1994) to the 1990s have been reversing subsequently (Supplementary Table 3). Significant upward trends in the rates were observed for female breast cancer during 1974-1993 and for gallbladder cancer and ovary cancer during 1974-1998. Significant downward trends in the rates were evident for liver cancer during 1998-2014, bladder cancer during 1993-2014, and bone carcinoma during 1999-2014. The rates of esophageal cancer, stomach cancer, and leukemia persistently decreased, whereas those of cancers of the colon & rectum, pancreas, kidney, and prostate increased consistently during 1974-2014. Interestingly, the rates of cervical cancer increased during 1996-2014. No joinpoint was identified for the rates of nasopharyngeal carcinoma, larynocarcinoma, and lymphoma.
Table 2: Trends in age-standardized mortality rates in Yangpu, Shanghai, China, during 1974-2014
Cancer sites |
APC (1974-2014) |
Joinpoint Trend 1 |
Joinpoint Trend 2 |
Joinpoint Trend 3 |
|||
|---|---|---|---|---|---|---|---|
Years |
APC |
Years |
APC |
Years |
APC |
||
All |
-0.7[-0.9, -0.5]a |
1974-1991 |
0.4[0.0,0.9]a |
1991-2014 |
-1.5[-1.8, -1.3]a |
||
Lung |
0.0[-0.4,0.3] |
1974-1991 |
2.2[1.6,3.0]a |
1991-2014 |
-1.7[-2.0, -1.3]a |
||
Stomach |
-2.6[-3.0,-2.2]a |
1974-1990 |
-1.0[-1.8,-0.1]a |
1990-2014 |
-3.7[-4.1,-3.3]a |
||
Liver |
-2.0[-2.6, -1.5]a |
1974-1998 |
-0.5[-1.1,0.1] |
1998-2014 |
-4.3[-5.3,-3.2]a |
||
leukemia |
-0.8[-1.3,-0.2]a |
1974-2014 |
-0.8[-1.3,-0.2]a |
||||
Colorectum |
2.7[1.9, 3.4]a |
1974-1988 |
6.9[4.7,9.1]a |
1988-2014 |
0.5[0.0,0.9]a |
||
Breast b |
1.5[0.6,2.4]a |
1974-1993 |
3.6[2.0,5.2]a |
1993-2014 |
-0.4[-1.3,0.5] |
||
Bladder |
-1.0[-2.1,0.2] |
1974-1993 |
1.9[-0.1,3.9] |
1993-2014 |
-3.5[-4.7,-2.2]a |
||
Esophagus |
-4.5[-4.8,-4.2]a |
1974-2014a |
-4.5[-4.8,-4.2]a |
||||
Cervicalb |
1.3[-5.9,9.0] |
1974-1993 |
2.1[-0.3,4.5] |
1993-1996 |
-27.9[-73.4,95.5] |
1996-2014 |
6.3[3.6,9.1]a |
Brain, CNS |
-0.2[-1.0,0.7] |
1974-1995 |
2.5[1.3,3.7]a |
1995-2014 |
-3.0[-4.3,-1.8]a |
||
Gallbladder |
2.7[3.7,5.2]a |
1974-1998 |
5.1[3.6,6.5]a |
1998-2014 |
-0.8[-2.2,0.7] |
||
Pancreas |
2.4[1.2,3.6]a |
1974-1985 |
5.7[1.5,10.1]a |
1985-2014 |
1.1[0.6,1.7]a |
||
Nasopharynx |
-2.1[-5.4,1.2] |
1974-2012 |
-0.3[-1.0,0.4] |
2012-2014 |
-31.3[-65.1,35.1] |
||
Larynx |
-0.5[-1.6,0.7] |
1974-2014 |
-0.5[-1.6,0.7] |
||||
Other thoracic organs |
-0.7[-5.5,4.3] |
1974-1989 |
-1.8[-8.0,4.9] |
1989-1994 |
21.7[-13.6,71.4] |
1994-2014 |
-4.8[-7.3,-2.3]a |
Bone |
-3.9[-5.4,-2.5]a |
1974-1999 |
-0.4[-1.8,0.9] |
1999-2014 |
-9.5[-12.6,-6.3]a |
||
Kidney |
2.5[1.7,3.3]a |
1974-2014 |
2.5[1.7,3.3]a |
||||
Prostatec |
4.3[3.5,5.0]a |
1974-2014 |
4.3[3.5,5.0]a |
||||
Lymphoma |
-0.2[-0.7,0.3] |
1974-2014 |
-0.2[-0.7,0.3] |
||||
Ovaryb |
1.3[0.0, 2.6]a |
1974-1998 |
2.9[1.2,4.6]a |
1998-2014 |
-1.0[-3.1,1.2] |
||
aAPC value is significantly different from Zero at alpha=0.05.
bAPC value was calculated among women.
cAPC value was calculated among men.
Projections of the causes of cancer death up to 2029
The predicted number of cancer death in age groups from age-period-cohort model established using the data during 1975-2009 fitted well to the actual number of cancer death during 2010-2014 (P=0.971, Supplementary Table 4), with a determination coefficient of 99.33%, indicating that this model can be applied to project future cancer mortalities in Yangpu. A total of 15,549 women and 24,173 men are projected to die of cancer during 2015-2029. Lung cancer, colorectal cancer, breast cancer, pancreas cancer, and stomach cancer will be the major causes of cancer death, accounting for 18.50%, 12.17%, 10.87%, 8.58%, and 8.16% of total cancer death in women, respectively. Lung cancer, colorectal cancer, prostate cancer, stomach cancer, and liver cancer will be the major causes of cancer death, accounting for 31.04%, 19.22%, 8.03%, 6.61%, and 6.20% of total cancer death in men, respectively. The trends in the cause-specific mortalities are detailed in Supplementary Table 5. Figure 4 shows the proportionate distribution of different cancers among the totals in 1975-1979, 2010-2014, and 2025-2029. Actual number of cancer death in both sexes will decline in 2025-2029. For women, the rank order and percentage distribution change apparently over time, the biggest differences being the increases in beast and colorectal cancers and the decreases in stomach and liver cancers. Stomach cancer, the 1st common cause (accounting for 20%) of cancer death in women before 1979, will be in the 5th position (8% of cancer death in women) in 2025-2029, whereas breast cancer, which accounted for only 5% of cancer death in women before 1979, will comprise 12% of those in 2025-2029. For men, colorectal cancer and prostate cancer will increase apparently, whereas liver cancer, esophageal cancer, and stomach cancer will decrease remarkably. Colorectal cancer (the 5th common cause of cancer death in men before 1979) is predicted to become the 2nd common cause (accounting for 22%) of cancer death in men in 2025-2029. Liver cancer, the 2nd common cause (accounting for 21%) of cancer death in men before 1979, will be the 6th position (4% of cancer death in men) in 2025-2029. However, lung cancer remains to be the top cause of cancer death in both sexes.
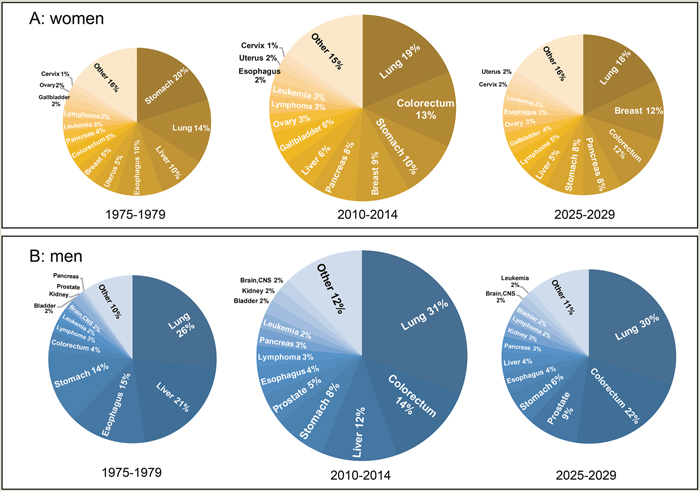
Figure 4: Pie charts of the most common causes of cancer death in women and men in 1975-1979, 2010-2014, and predicted in 2025-2029. The areas of the pies are proportional to the numbers of cases. (A) Scaled for women; (B) scaled for men.
Trends (1974-2014) and projections (2015-2029) of annual life expectancy and cancer-eliminated life expectancy are shown in Figure 5. Cancer-caused life loss, calculated as cancer-eliminated life expectancy subtracted by life expectancy, was constant during 1974-1999 (Ptrend=0.143) and kept increasing from 2000 to 2014 (Ptrend<0.001). Cancer-caused life loss will keep increasing during 2015-2029.
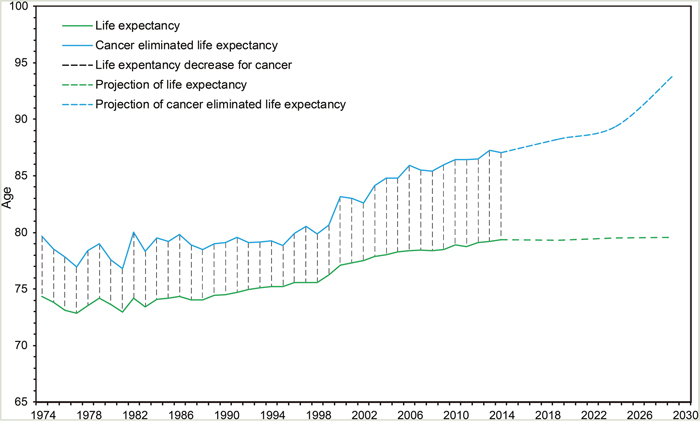
Figure 5: Trends and projections of annual life expectancy and cancer-eliminated life expectancy in Yangpu, Shanghai, China. Trends: 1974-2014; projections: 2015-2029.
DISCUSSION
The updated estimates of cancer burden and long-term trends are critical to understanding the etiology, the effectiveness of prevention, early diagnosis, suitable treatment, and management of cancer in a given society. From the data of 22 population-based Chinese cancer registries during 2000-2011, the trends in age-standardized mortalities of major malignancies were quite consistent to the age-standardized incidences in both sexes [4], indicating that the effect of clinical activities on survival of cancer patients has not been improved. Thus, trends in the mortalities can reflect trends in the incidences of major malignancies in mainland China, a highly populated society with medium levels of medical services. In the present study, we selected Yangpu, an industry restructuring district of Shanghai, China, as the study field. The data from Yangpu can indicate the changes in cancer mortality during the transition from industrial civilization to ecological civilization in developing countries. We demonstrated that cancers of the lung & bronchus, stomach, liver, colon & rectum, and esophagus were the 5 leading causes of cancer death during 1974-2014. The 5 leading causes of cancer death were basically consistent to the national corresponding data in 2015, except that the rank order of colorectal cancer and esophageal cancer was counterchanged [4]. Cancers of the liver, lung, and stomach in men and cancers of the stomach, lung, and breast in women were the leading causes of cancer death for those aged before 60 years (Table 1), the young and working populations, indicating the control of these cancer types should have priority. Unlike most cancer types occurred in both sexes, women with stomach cancer survived shorter than did men (Figure 2), possibly because female stomach cancer is more associated with a younger age, poorly differentiated adenocarcinoma, and more signet ring cell carcinoma [12]. The mortalities for cancers of the larynx, bladder, liver, nasopharynx, lung, esophagus, lip oral & pharynx, stomach, kidney, and lymphoma were significantly higher in men than in women, and this result is quite consistent to sex disparity in the incidences of corresponding cancer types according to the national data in 2015 [4]. In addition to distinct opportunity of exposure to environmental risk factors such as tobacco smoking and working in polluting factories between men and women, some intrinsic factors such as sex hormone-related signaling pathways that facilitate cancer development in men may contribute to this sex disparity [12–15].
Cancer death accounted for 28.80% of total death in Yangpu during 1974-2014 and the proportion was quite correlated to that of residents aged 60 years or older in the 4 consecutive decades. Furthermore, crude mortality rates for all cancers combined increased and corresponding age-standardized mortalities decreased during 1974-2014 (Figure 3A-3B). These data indicate that aging contributes to increasing cancer deaths from 1974 to 2014. Improved social welfare and medical service benefited from economic development and the birth-control policy implemented in mainland China since the early 1970s did gradually alter age structure of this society, contributing to the aging-related profiling of cancer death.
A steady increase in the age-standardized mortality of all cancers combined up to around the year 1991 have been reversing subsequently (Table 2). This trend was predominantly contributed by the rates of cancers of the lung & bronchus in both sexes, bladder in men, and brain & CNS in men as well as other pollution-caused malignancies. Lung cancer was the 2nd major cause of cancer death during 1974-1983. Thereafter, it became the leading cause of cancer death, possibly because highly polluting but economy-dependent industries introduced since 1945 were prosperous during the 1970s-1980s. These industries had been shut down in the 1980s due to heavy pollution, resulting in decreases in age-standardized mortalities of the pollution-related cancers after the 1990s. Although the age-standardized mortality decreased with a small slope, lung cancer remains the top cancer killer in Yangpu. This is possibly because the contribution of tobacco smoking to the mortality of lung cancer does not decrease apparently. In China, tobacco consumption has increased substantially since the 1980s, almost exclusively in men [16]. Over 50% of adult Chinese men were smokers in 2010 [17]. Tobacco smoking accounts for 23% of all cancer deaths in China [18]. Although stomach cancer was the top cause of cancer death during 1974-1983, persistent decreases in the crude and age-adjusted mortalities were evident (Supplementary Table 2 and Figure 3). Nevertheless, rapid decrease in the age-standardized mortality of stomach cancer occurred after 1990 (Table 2). This may be caused by wide use of refrigerator in households and enrichment of food supply since the early 1980s in Shanghai, as being demonstrated elsewhere [19]. Surprisingly, the crude and age-standardized mortalities of esophageal cancer rapidly declined (Supplementary Table 2 and Table 2). Consumption of hot food and beverages, tobacco smoking, and alcohol consumption are well-recognized risk factors, whereas diets rich in vegetables and fruits are protective factors of esophageal squamous cell carcinoma [20]. Chronic esophagitis such as reflux disease and Barrett’s esophagus are major risk factors for the development of esophageal cancer [21]. We believe that sufficient supply of fresh and high quality food, diets rich in fresh vegetables and fruits, and public health education-improved healthy lifestyle like reducing consumption of hot food and beverages greatly reduce the prevalence of chronic esophagitis, thus contributing to rapid decline in the mortality of esophageal cancer. Age-adjusted mortality of liver cancer decreased significantly after 1998. Vaccination of hepatitis B virus initiated in 1987 in Shanghai contributes to this decrease in the rate of liver cancer, as evidenced in Taiwan [22]. Furthermore, factors contributing to the decrease in the age-standardized mortality of liver cancer include a reduction in the consumption of corn and peanut contaminated with aflatoxins in the hot and rainy geographic areas [23]. Increase in the age-adjusted mortalities of cancers of colon & rectum, pancreas, kidney, prostate, ovary, gallbladder, and breast should be related to the increasing prevalence of obesity and other metabolic syndrome including diabetes and hypertension [24–28], accompanying with economic growth, urbanization, and westernized lifestyle. Interestingly, the rate of cervical cancer started to increase after 1996, possibly due to the increase in sex-transmitted human papilloma virus infection after 1980 when the reform and opening to the outside world became a national policy in mainland China [29]. The decline in the age-standardized mortalities from all cancers combined and from major pollution-caused cancer types in Yangpu reflected the decrease in exposure to industrial pollution around 10 years ago. It seems too short to realize this reduction in cancer mortality, for the patients usually survive years since the occurrence. However, the major causes of cancer death in Yangpu are cancers of the lung & bronchus, stomach, liver, and esophagus, which are more aggressive than cancers of the colon & rectum, prostate, and breast, the major cancer types in developed world [1–6, 30]. Thus, reduction in industrial pollution and improvement in living standard at least 10 years may lead to the decrease in the mortalities of cancers caused by pollution, poverty, and chronic infection; economic growth, urbanization, and westernized lifestyle may increase the mortalities of cancers caused by metabolic syndrome.
Projections of cancer mortality provide an estimate of future burden of cancer and are fundamental to the process of planning for programs of cancer control as well as for setting priorities for future research. Age standardized mortality rates from cancer as a whole have been declining in Yangpu since 1991. Cancer of the stomach, esophagus, and liver consistently declined, whereas cancers of the colon & rectum, prostate, pancreas, and kidney increased in the past 41 years. The trends were projected to continue into the future. Cancers of the lung & bronchus, colon & rectum, prostate, and stomach in men and cancers of the lung & bronchus, breast, colon & rectum, and pancreas in women will be the top leading causes of cancer death in 2029, and the predicted top leading causes of cancer death in 2029 in Yangpu are similar to those in developed countries in 2008 [30, 31]. These evidence together with the truth that the 5 leading causes of cancer death in Yangpu during 1974-2014 were basically consistent to the corresponding national data in 2015, imply that the level of cancer control in China is at least 20 years behind developed counties. Cancer-caused life loss will keep increasing in the next 15 years. Therefore, public health efforts should be enforced to reduce tobacco consumption, decrease air pollution, provide healthy food and drinks, and encourage regular physical excise.
Our study has limitations. First, although death registration in Yangpu is the best in quality among China, it is difficult to characterize trends in the mortalities of rare cancer types such as laryngocarcinoma and cutaneum carcinoma due to a small population base. Second, the effect of industrial pollution on cancer mortality should be compromised by the improved medical service. Due to lack of the data concerning cancer incidences, it is difficult to figure out the benefit of the improved medical service.
Conclusively, the present study report the burden and trend of cancer death from 1974 to 2014 and the projections to 2029 in Yangpu, a district that can represent industry restructuring communities in developing world. Age-standardized mortalities of cancers of the lung & bronchus, bladder, brain & CNS, liver, stomach, and esophagus that are mainly caused by industrial pollution, poverty, and infection significantly decreased, especially after the 1990s; the mortalities of cancers of the colon & rectum, pancreas, prostate, and kidney that are associated with metabolic syndrome especially obesity and physical inactivity consistently increased from 1974 to 2014. This trend was projected to continue into the future. Cancers of the lung & bronchus, colon & rectum, prostate, and stomach in men and cancers of the lung & bronchus, breast, colon & rectum, and pancreas in women will be the leading causes of cancer death in 2029, and these malignancies requires public heath interventions in advance.
MATERIALS AND METHODS
Data collection
Information of cancer death during 1974-2014 was derived from the well-operated death registration system, covering all permanent residents in Yangpu, Shanghai. Cases were classified according to the 9th (1974-2001) and 10th (2002-2014) edition of International Classification of Disease codes. Yearly demographic data from 1994 to 2014 were obtained from the Public Security Bureau of Yangpu district. We did not extract personal information according to the regulations approved by the review board of Second Military Medical University.
Statistical analysis
Temporal trends in the mortalities from 1974 to 2014 were examined by fitting joinpoint models (Version 4.3.1.0, Bethesda, MD) to the log-transformed, crude rates and age-adjusted rates standardized according to the world standard population [32, 33]. The trend was expressed as the APC and the Z test was employed to assess if the APC was statistically different from zero. The term “increase” or “decrease” was applied to describe the trend when APC of the trend was statistically significant (P<0.05). Cancer mortality was predicted by age-period-cohort model [34–36] and extrapolated out to 2029. Population number of each age group during 2015-2029 was predicted using Leslie matrix model [37]. To evaluate the effect of this model on predicting cancer mortality, we applied the mortalities during 1975-2009 to fit the model and then validated the model using the data from 2010 to 2014. A generalized linear model was applied to evaluate the consistency between actual value and predicted value. Life expectancy and cause-eliminated life expectancy referred to those of birth group and were calculated using the abridged life table [38]. Abridged life table was also used to calculate life expectancy and cause-eliminated life expectancy during 2015-2029. Numbers of all-cause death, cancer death and population data during 2015-2029, which were needed in the abridged life table, were obtained from the age-period-cohort model and the Leslie matrix model as previously described [37]. Life loss was calculated as subtracting life expectancy from cause-eliminated life expectancy. The trend of life loss was evaluated by piecewise linear fitting method [39]. We conducted the age-period-cohort model analysis using Norpred package and piecewise linear fitting analysis using segmented package in R software (Version 3.3.3). Basic statistical analysis was conducted using SAS9.4 software (SAS, NC). A P value of <0.05 in two sides was considered as statistically significant.
Author contribution
Drs Guangwen Cao had full access to all the data in the study and take responsibility for the integrity of the data and the accuracy of the data analysis.
Study concept and design: Guangwen Cao.
Acquisition, analysis, or interpretation of data: Mi Li, Shuo Wang, Xue Han, Wenbin Liu, Jiahui Song, Jia Zhao, Fan Yang, Xiaojie Tan, Xi Chen, Yan Liu, Hui Li, Yibo Ding, Xiaoyu Du, Jianhua Yin, Rong Zhang, Guangwen Cao.
Drafting of the manuscript: Guangwen Cao.
Critical revision of the manuscript for important intellectual content: Mi Li, Shuo Wang, Xue Han, Wenbin Liu, Jiahui Song, Hongwei Zhang, Jia Zhao, Fan Yang, Xiaojie Tan, Xi Chen, Yan Liu, Hui Li, Yibo Ding, Xiaoyu Du, Jianhua Yin, Rong Zhang.
Statistical analysis: Mi Li, Shuo Wang, Hongwei Zhang, Guangwen Cao.
Administrative, technical, or material support: Xue Han, Jia Zhao, Hui Li, Rong Zhang, Guangwen Cao.
Study supervision: Guangwen Cao.
CONFLICTS OF INTEREST
The authors declare that they have no conflicts of interest.
FUNDING
The Key Research Fund from the National Key Basic Research Program of China (973 Program) (No.2015CB554000), National Natural Science Foundation of China (81520108021), and Three-year Action Plan on Public Health, Phase IV, Shanghai, China (15GWZK0801).
REFERENCES
1. Global Burden of Disease Cancer Collaboration, Fitzmaurice C, Dicker D, Pain A, Hamavid H, Moradi-Lakeh M, MacIntyre MF, Allen C, Hansen G, Woodbrook R, Wolfe C, Hamadeh RR, Moore A, et al. The Global Burden of Cancer 2013. JAMA Oncol. 2015; 1:505-27. https://doi.org/10.1001/jamaoncol.2015.0735.
2. Gelband H, Sankaranarayanan R, Gauvreau CL, Horton S, Anderson BO, Bray F, Cleary J, Dare AJ, Denny L, Gospodarowicz MK, Gupta S, Howard SC, Jaffray DA, et al. Disease Control Priorities-3 Cancer Author Group. Costs, affordability, and feasibility of an essential package of cancer control interventions in low-income and middle-income countries: key messages from Disease Control Priorities, 3rd edition. Lancet. 2016; 387:2133-44. https://doi.org/10.1016/S0140-6736(15)00755-2.
3. Chen W, Zheng R, Zuo T, Zeng H, Zhang S, He J. National cancer incidence and mortality in China, 2012. Chin J Cancer Res. 2016; 28:1-11. https://doi.org/10.3978/j.issn.1000-9604.2016.02.08.
4. Chen W, Zheng R, Baade PD, Zhang S, Zeng H, Bray F, Jemal A, Yu XQ, He J. Cancer statistics in China, 2015. CA Cancer J Clin. 2016; 66:115-32. https://doi.org/10.3322/caac.21338.
5. Li Z, Yang L, Du C, Fang X, Wang N, Gu J. Characteristics and comparison of colorectal cancer incidence in Beijing with other regions in the world. Oncotarget. 2017; 11:8:24593-03. https://doi.org/10.18632/oncotarget.15598.
6. Chen W, Zheng R, Zhang S, Zeng H, Xia C, Zuo T, Yang Z, Zou X, He J. Cancer incidence and mortality in China, 2013. Cancer Lett. 2017. https://doi.org/10.1016/j.canlet.2017.04.024.
7. Huang Z, Zheng Y, Wen W, Wu C, Bao P, Wang C, Zhong W, Gao YT, Jin F, Xiang YB, Shu XO, Beeghly-Fadiel A. Incidence and mortality of gynaecological cancers: Secular trends in urban Shanghai, China over 40 years. Eur J Cancer. 2016; 63:1-10. https://doi.org/10.1016/j.ejca.2016.04.016.
8. Ji BT, Devesa SS, Chow WH, Jin F, Gao YT. Colorectal cancer incidence trends by subsite in urban Shanghai, 1972-1994. Cancer Epidemiol Biomarkers Prev. 1998; 7:661-6.
9. Gao S, Yang WS, Bray F, Va P, Zhang W, Gao J, Xiang YB. Declining rates of hepatocellular carcinoma in urban Shanghai: incidence trends in 1976-2005. Eur J Epidemiol. 2012; 27:39-46. https://doi.org/10.1007/s10654-011-9636-8.
10. Jin F, Devesa SS, Chow WH, Zheng W, Ji BT, Fraumeni JF Jr, Gao YT. Cancer incidence trends in urban shanghai, 1972-1994: an update. Int J Cancer. 1999; 83:435-40.
11. Long J, Luo GP, Xiao ZW, Liu ZQ, Guo M, Liu L, Liu C, Xu J, Gao YT, Zheng Y, Wu C, Ni QX, Li M, et al. Cancer statistics: current diagnosis and treatment of pancreatic cancer in Shanghai, China. Cancer Lett. 2014; 346:273-7. https://doi.org/10.1016/j.canlet.2014.01.004.
12. Berardi R, Morgese F, Santinelli A, Onofri A, Biscotti T, Brunelli A, Caramanti M, Savini A, De Lisa M, Ballatore Z, Pompili C, Salati M, Mazzanti P, et al. Hormonal receptors in lung adenocarcinoma: expression and difference in outcome by sex. Oncotarget. 2016; 7:82648-57. https://doi.org/10.18632/oncotarget.12244.
13. Li Z, Tuteja G, Schug J, Kaestner KH. Foxa1 and Foxa2 are essential for sexual dimorphism in liver cancer. Cell. 2012; 148:72-83. https://doi.org/10.1016/j.cell.2011.11.026.
14. Lai H, Yeh CC, Jeng LB, Huang SF, Liao PY, Lei FJ, Cheng WC, Hsu CL, Cai X, Chang C, Ma WL. Androgen receptor mitigates postoperative disease progression of hepatocellular carcinoma by suppressing CD90+ populations and cell migration and by promoting anoikis in circulating tumor cells. Oncotarget. 2016; 7:46448-65. https://doi.org/10.18632/oncotarget.10186.
15. Camargo MC, Goto Y, Zabaleta J, Morgan DR, Correa P, Rabkin CS. Sex hormones, hormonal interventions, and gastric cancer risk: a meta-analysis. Cancer Epidemiol Biomarkers Prev. 2012; 21:20-38. https://doi.org/10.1158/1055-9965.EPI-11-0834.
16. Chen ZM, Peto R, Iona A, Guo Y, Chen YP, Bian Z, Yang L, Zhang WY, Lu F, Chen JS, Collins R, Li LM, China Kadoorie Biobank Collaborative Group. Emerging tobacco-related cancer risks in China: A nationwide, prospective study of 0.5 million adults. Cancer. 2015; 121:3097-106. https://doi.org/10.1002/cncr.29560.
17. Li Q, Hsia J, Yang G. Prevalence of smoking in China in 2010. N Engl J Med. 2011; 364:2469-70. https://doi.org/10.1056/NEJMc1102459.
18. Wang JB, Jiang Y, Liang H, Li P, Xiao HJ, Ji J, Xiang W, Shi JF, Fan YG, Li L, Wang D, Deng SS, Chen WQ, et al. Attributable causes of cancer in China. Ann Oncol. 2012; 23:2983-9. https://doi.org/10.1093/annonc/mds139.
19. Park B, Shin A, Park SK, Ko KP, Ma SH, Lee EH, Gwack J, Jung EJ, Cho LY, Yang JJ, Yoo KY. Ecological study for refrigerator use, salt, vegetable, and fruit intakes, and gastric cancer. Cancer Causes Control. 2011; 22:1497-502. https://doi.org/10.1007/s10552-011-9823-7.
20. McCormack VA, Menya D, Munishi MO, Dzamalala C, Gasmelseed N, Leon Roux M, Assefa M, Osano O, Watts M, Mwasamwaja AO, Mmbaga BT, Murphy G, Abnet CC, et al. Informing etiologic research priorities for squamous cell esophageal cancer in Africa: A review of setting-specific exposures to known and putative risk factors. Int J Cancer. 2017; 140:259-271. https://doi.org/10.1002/ijc.30292.
21. Huhta H, Helminen O, Palomäki S, Kauppila JH, Saarnio J, Lehenkari PP, Karttunen TJ. Intratumoral lactate metabolism in Barrett’s esophagus and adenocarcinoma. Oncotarget. 2017; 8:22894-902. https://doi.org/10.18632/oncotarget.15284.
22. Chang MH, You SL, Chen CJ, Liu CJ, Lai MW, Wu TC, Wu SF, Lee CM, Yang SS, Chu HC, Wang TE, Chen BW, Chuang WL, et al. Long-term effects of hepatitis B immunization of infants in preventing liver cancer. Gastroenterology. 2016; 151:472-480.e1. https://doi.org/10.1053/j.gastro.2016.05.048.
23. Chen JG, Egner PA, Ng D, Jacobson LP, Muñoz A, Zhu YR, Qian GS, Wu F, Yuan JM, Groopman JD, Kensler TW. Reduced aflatoxin exposure presages decline in liver cancer mortality in an endemic region of China. Cancer Prev Res (Phila). 2013; 6:1038-45. https://doi.org/10.1158/1940-6207.CAPR-13-0168.
24. Kyrgiou M, Kalliala I, Markozannes G, Gunter MJ, Paraskevaidis E, Gabra H, Martin-Hirsch P, Tsilidis KK. Adiposity and cancer at major anatomical sites: umbrella review of the literature. BMJ. 2017; 356:j477. https://doi.org/10.1136/bmj.j477.
25. Wang G, Hou J, Ma L, Xie J, Yin J, Xu D, Chang W, Tan X, Su T, Zhang H, Cao G. Risk factor for clear cell renal cell carcinoma in Chinese population: a case-control study. Cancer Epidemiol. 2012; 36:177-182. https://doi.org/10.1016/j.canep.2011.09.006.
26. Izano M, Wei EK, Tai C, Swede H, Gregorich S, Harris TB, Klepin H, Satterfield S, Murphy R, Newman AB, Rubin SM, Braithwaite D, Health ABC study. Chronic inflammation and risk of colorectal and other obesity-related cancers: the health, aging and body composition study. Int J Cancer. 2016; 138:1118-1128. https://doi.org/10.1002/ijc.29868.
27. González N, Prieto I, Del Puerto-Nevado L, Portal-Nuñez S, Ardura JA, Corton M, Fernández-Fernández B, Aguilera O, Gomez-Guerrero C, Mas S, Moreno JA, Ruiz-Ortega M, Sanz AB, et al. 2017 update on the relationship between diabetes and colorectal cancer: epidemiology, potential molecular mechanisms and therapeutic implications. Oncotarget. 2017; 8:18456-85. https://doi.org/10.18632/oncotarget.14472.
28. Gao Y, Huang Y, Song F, Dai H, Wang P, Li H, Zheng H, Dong H, Han J, Wang Y, Chen K. Urban-rural disparity of overweight/obesity distribution and its potential trend with breast cancer among Chinese women. Oncotarget. 2016; 7:56608-18. https://doi.org/10.18632/oncotarget.10968.
29. Gu Y, Yi M, Xu Y, Zhao H, Fu F, Zhang Y. Genotype distribution characteristics of high-risk human papillomaviruses in women from Shanghai, China. Epidemiol Infect. 2016; 144:1482-9. https://doi.org/10.1017/S0950268815002721.
30. Ferlay J, Shin HR, Bray F, Forman D, Mathers C, Parkin DM. Estimates of worldwide burden of cancer in 2008: GLOBOCAN 2008. Int J Cancer. 2010; 127:2893-917. https://doi.org/10.1002/ijc.25516.
31. Jemal A, Bray F, Center MM, Ferlay J, Ward E, Forman D. Global cancer statistics. CA Cancer J Clin. 2011; 61:69-90. https://doi.org/10.3322/caac.20107
32. National Cancer Institute. Joinpoint Regression Program, Version 4.2.0-April 2015. Bethesda, MD: Statistical Methodology and Applications Branch, Surveillance Research Program, National Cancer Institute; 2015.
33. Doll R, Cook P. Summarizing indices for comparison of cancer incidence data. Int J Cancer. 1967; 2:269-279.
34. Møller B, Fekjaer H, Hakulinen T, Sigvaldason H, Storm HH, Talbäck M, Haldorsen T. Prediction of cancer incidence in the Nordic countries: empirical comparison of different approaches. Stat Med. 2003; 22:2751-66. https://doi.org/10.1002/sim.1481.
35. Olsen AH, Parkin DM, Sasieni P. Cancer mortality in the United Kingdom: projections to the year 2025. Br J Cancer. 2008; 99:1549-54. https://doi.org/10.1038/sj.bjc.6604710.
36. Mistry M, Parkin DM, Ahmad AS, Sasieni P. Cancer incidence in the United Kingdom: projections to the year 2030. Br J Cancer. 2011; 105:1795-803. https://doi.org/10.1038/bjc.2011.430.
37. Cáceres MO, Cáceres-Saez I. Random Leslie matrices in population dynamics. J Math Biol. 2011; 63:519-56. https://doi.org/10.1007/s00285-010-0378-0.
38. Banda R, Sandøy IF, Fylkesnes K, Janssen F. Impact of pregnancy-related deaths on female life expectancy in Zambia: application of life table techniques to census data. PLoS One. 2015; 10:e0141689. https://doi.org/10.1371/journal.pone.0141689.
39. Muggeo VM. Estimating regression models with unknown break-points. Stat Med. 2003; 22:3055-71.