
INTRODUCTION
Globally, tuberculosis (TB) remains to be a vital public health problem as well as leading cause of morbidity and mortality [1, 2]. On the basis of the annual report on global control of TB from WHO, approximately 8.6 million new cases occurred in 2012 [3]. Pulmonary tuberculosis (PTB), a pulmonary infectious diseases caused by Mycibacterium tuberculosis, which is the most common location, and the source of the infection is mainly through the respiratory tract.
Epidemiological data showed that only about one-tenth of the population infected by Mycobacterium tuberculosis will develop clinical tuberculosis [4]. Twin study of Mycibacterium tuberculosis-infected individuals revealed that latently-infected monozygotic twins are more likely to develop pulmonary TB than latently infected dizygotic twins [5], and there are momentous racial differences in tuberculosis incidence. A Genome wide linkage and association study (GWAS) has found 8 independent loci located within or near the immune signaling genes associate with the PTB susceptibility in Indonesians, containing JAG1, DYNLRB2, EBF1, TMEFF2, CCL17, HAUS6, PENK and TXNDC4 [6]. Moreover, study have indicated that genetic factors play an important role in the pathogenesis of tuberculosis [7].
In the past decades, scenic progress have been made in our understanding of the innate and adaptive immunity in the human host defend to PTB [8], and importantly some single nucleotide polymorphisms (SNPs) in congenital immunity genes have been reported to be candidate biomarkers associated with susceptibility to PTB [9]. Cytokine interferon-γ (IFN-γ), encoded by IFNG gene, is type II interferon plays a role in the immune response against viral and intracellular bacterial infections, and has been implicated as a mediator in auto-inflammatory and auto-immune disorders [10]. The receptor for INF-γ is constituted of two integral membrane proteins α and β subunits, and α subunit, encoded by IFNGR1 gene, regulates the potency of IFN-γ signaling. Study have reported the association between polymorphisms of IFNGR1 and IFNG and the risk of PTB in Chinese Han population, and indicated variants in IFNGR1 gene involved in the PTB risk [11]. However, to the best of our knowledge, there is no report regarding the possible association between polymorphisms of IFNGR1 and IFNG with the PTB susceptibility of Chinese Tibetan population.
In order to investigate potential relationships between IFNGR1 and IFNG SNPs, genotypes, haplotypes, and their role in the etiology of PTB in a Chinese Tibetan population, we performed a comprehensive association analysis in a case-control study. We genotyped five SNPs in IFNGR1: rs9376267, rs9376268, rs1327475, rs7749390 and rs1327474; and four SNPs in IFNG: rs2069727, rs1861493, rs1861494 and rs2069705.
RESULTS
Primers and sample characteristics
A total of 971 Tibetan participants were recruited in this study, including 467 PTB cases and 504 controls. The primers of the nine selected SNPs were listed in Table 1, which were designed by Sequenom MassARRAY Assay Design 4.0 Software. The characteristic of the controls and cases were listed in Table 2, and after difference analysis, result showed that the distribution of gender and age between case and group were good matched.
Table 1: Sequence of oligonucleotide primers used in the study
SNP-ID |
2nd-PCRP |
1st-PCRP |
UEP-SEQ |
|---|---|---|---|
rs9376267 |
ACGTTGGATGAGATTGA ACAATGGAGCCAC |
ACGTTGGATGTGTAA AAAGCCCTGCACACC |
CATTCCAGTTTCATCAACA |
rs9376268 |
ACGTTGGATGCCATCT CTGGTTCTCTAAGC |
ACGTTGGATGAAGGCT ACTCTGGCAAGAAC |
acCTAAGCAACTTCCTTGTAG |
rs1327475 |
ACGTTGGATGTGTTCAA CTTTTGCAGTGGC |
ACGTTGGATGGAAGAC TATTTTCTGGTGAC |
gcagtAAACATTACCTGAAGCAGATG |
rs7749390 |
ACGTTGGATGTCTGG GGCCGTCCTCAGGTA |
ACGTTGGATGTAGGGC GACCTCGGAGAAG |
ctcaGTCCTCAGGTACCGTCG |
rs1327474 |
ACGTTGGATGCTTCTC AGCAATTCAGTGTC |
ACGTTGGATGAGAGAGG TAAGAGAGCAGAC |
ATTCAGTGTCAAATCAGTTTAT |
rs2069727 |
ACGTTGGATGACTG GTGTTTGCCAGCATTG |
ACGTTGGATGATTTCT AGCCCCTTCTCCAC |
GGAGAGGAAGATTCTGAAA |
rs1861493 |
ACGTTGGATGTTG GAGCAAAGAAGGTCATC |
ACGTTGGATGGTGATGA ATCACATGGCTGG |
cctGTCATCAAACTTATACAGTGA |
rs1861494 |
ACGTTGGATGAGGGACA ATGAGAGAACTGC |
ACGTTGGATGAGGTGA GTTGACAAATCCAG |
TGCTTCTCAGTACTCCC |
rs2069705 |
ACGTTGGATGAGGA GACTGAGTCATAGAAG |
ACGTTGGATGGGGCAA ACTTGATTCCTGAC |
TGAGTCATAGAAGATTTAAGAAG |
Table 2: Characteristic of the control individuals and patients with pulmonary tuberculosis
Characteristic |
Case (N=467) |
Control (N=503) |
P-value |
|---|---|---|---|
Gender (%) |
0.947a |
||
female |
287 (61.5%) |
308 (61.2%) |
|
male |
180 (38.5%) |
195 (38.8%) |
|
Mean age ± SD |
50.67±7.8 |
50.34±7.74 |
0.508b |
Pa was calculated by Pearson Chi-Square test; Pb was calculated by Welch's t test. P<0.05 indicates significant difference.
SNP analysis
Nine SNPs in the two genes analyzed in this study were successfully genotyped in all cases and controls. Chromosomal position, gene, miner allele frequency (MAF), and HWE test results for candidate SNPs were presented in Table 3. Exact test was used to calculated whether the SNPs departed from the Hardy–Weinberg equilibrium (HWE), and the results showed that none of the SNPs displayed significant deviation from HWE (P>0.05). We used chi-square test to assess the influence of gene polymorphism of PTB risk in the allele model, and found that 3 SNPs in IFNGR1 significantly reduced PTB risk: rs9376268 (OR=0.73, 95%CI=0.61-0.88, P=0.001), rs1327475 (OR=0.62, 95%CI=0.44-0.86, P=0.005) and rs1327474 (OR=0.54, 95%CI=0.35-0.84, P=0.006). We also discovered that rs2069705 in IFNG significantly increased PTB risk (OR=1.36, 95%CI=1.1-1.69, P=0.005). Other SNPs had no relation with PTB susceptibility.
Table 3: Allele frequencies of candidates SNPs examined in IFNG and IFNGR1 gene among the cases and controls
SNP ID |
Position |
Band |
Gene |
Role |
Alleles |
HWE-Pa |
MAF |
OR(95% CI) |
Pb |
|
|---|---|---|---|---|---|---|---|---|---|---|
A/B |
Case |
Control |
||||||||
rs9376267 |
137531031 |
6q23.3 |
IFNGR1 |
Intron |
T/C |
0.715 |
0.39 |
0.426 |
0.86(0.72-1.04) |
0.117 |
rs9376268 |
137532751 |
6q23.3 |
IFNGR1 |
Intron |
A/G |
1 |
0.331 |
0.403 |
0.73(0.61-0.88) |
0.001* |
rs1327475 |
137536455 |
6q23.3 |
IFNGR1 |
Intron |
A/G |
1 |
0.063 |
0.098 |
0.62(0.44-0.86) |
0.005* |
rs7749390 |
137540370 |
6q23.3 |
IFNGR1 |
Intron (boundary) |
A/G |
0.53 |
0.499 |
0.456 |
1.19(0.99-1.42) |
0.06 |
rs1327474 |
137541075 |
6q23.3 |
IFNGR1 |
Promoter |
C/T |
0.693 |
0.033 |
0.06 |
0.54(0.35-0.84) |
0.006* |
rs2069727 |
68548223 |
12q15 |
IFNG |
Downstream |
C/T |
0.554 |
0.154 |
0.13 |
1.22(0.94-1.57) |
0.131 |
rs1861493 |
68551196 |
12q15 |
IFNG |
Intron |
G/A |
0.514 |
0.373 |
0.397 |
0.9(0.75-1.09) |
0.277 |
rs1861494 |
68551409 |
12q15 |
IFNG |
Intron |
C/T |
0.576 |
0.358 |
0.392 |
0.86(0.72-1.04) |
0.122 |
rs2069705 |
68555011 |
12q15 |
IFNG |
Promoter |
A/G |
0.676 |
0.253 |
0.199 |
1.36(1.1-1.69) |
0.005* |
SNPs: Single nucleotide polymorphisms; A: Miner alleles, B: Major alleles; MAF: Minor allele frequency; HWE: Hardy-Weinberg equilibrium; OR: Odds ratio; CI: Confidence interval. aP values were calculated using exact test; bP values were calculated using Chi-square test. *P<0.05 indicates statistical significance. Bonferroni’s multiple adjustment was applied to the level of significance, which was set at P<0.0011 (0.05/45).
Results of genotype model association analyses used unconditional logistic regression analysis were presented in Table 4 and Table 5. In Table 4, we found that under dominant model, three SNPs exhibited a protective role in PTB risk, containing rs9376268 (OR=0.68, 95%CI=0.53-0.88, P=0.004), rs1327475 (OR=0.63, 95%CI=0.44-0.9, P=0.01) and rs1327474 (OR=0.53, 95%CI=0.33-0.83, P=0.006); but rs2069705 was observed to be associated with increased PTB risk (OR=1.42, 95%CI=1.10-1.83, P=0.008). Under recessive model, only rs9376268 was associated with lower PTB risk (OR=0.64, 95%CI=0.44-0.93, P=0.019). Under additive model, we noticed that the three SNPs rs9376268 (OR=0.73, 95%CI=0.61-0.88, P<0.001), rs1327475 (OR=0.61, 95%CI=0.43-0.86, P=0.005), and rs1327474 (OR=0.55, 95%CI=0.35-0.85, P=0.007) were associated with decreased PTB risk. Contrarily, rs2069705 (OR=1.37, 95%CI=1.1-1.71, P=0.004) be associated with increased PTB risk under additive model.
Table 4: Logistic regression analyses of association between nine SNPs and pulmonary tuberculosis risk under dominant, recessive and additive model
SNP-ID |
Dominant Model |
Recessive Model |
Additive Model |
|||
|---|---|---|---|---|---|---|
OR(95%CI) |
P |
OR(95%CI) |
P |
OR(95%CI) |
P |
|
rs9376267 |
0.84(0.64-1.1) |
0.203 |
0.79(0.56-1.12) |
0.188 |
0.86(0.72-1.04) |
0.113 |
rs9376268 |
0.68(0.53-0.88) |
0.004* |
0.64(0.44-0.93) |
0.019* |
0.73(0.61-0.88) |
<0.001* |
rs1327475 |
0.63(0.44-0.9) |
0.01* |
- |
0.999 |
0.61(0.43-0.86) |
0.005* |
rs7749390 |
1.33(1-1.78) |
0.052 |
1.2(0.88-1.63) |
0.249 |
1.2(1-1.44) |
0.054 |
rs1327474 |
0.53(0.33-0.83) |
0.006* |
0.54(0.05-5.95) |
0.613 |
0.55(0.35-0.85) |
0.007* |
rs2069727 |
1.23(0.92-1.64) |
0.157 |
1.41(0.61-3.25) |
0.418 |
1.21(0.94-1.56) |
0.137 |
rs1861493 |
0.87(0.67-1.12) |
0.276 |
0.89(0.62-1.28) |
0.527 |
0.9(0.75-1.09) |
0.271 |
rs1861494 |
0.84(0.65-1.09) |
0.191 |
0.79(0.54-1.15) |
0.215 |
0.86(0.71-1.04) |
0.117 |
rs2069705 |
1.42(1.1-1.83) |
0.008* |
1.72(0.94-3.15) |
0.08 |
1.37(1.1-1.71) |
0.004* |
SNP: Single nucleotide polymorphisms. aP values were calculated by unconditional logistic regression analysis. *P < 0.05 indicates statistical significance. Bonferroni’s multiple adjustment was applied to the level of significance, which was set at P < 0.0011 (0.05/45).
Table 5: Frequency distributions of genotypes and their association with the risk of developing PTB
SNP-ID |
Genotype |
No. (frequency) |
OR(95%CI) |
Pa |
|
|---|---|---|---|---|---|
Case |
Control |
||||
rs9376267 |
C/C |
168(36.44%) |
162(32.53%) |
1 |
|
T/C |
226(49.02%) |
248(49.8%) |
0.88(0.66-1.16) |
0.368 |
|
T/T |
67(14.53%) |
88(17.67%) |
0.73(0.5-1.08) |
0.115 |
|
rs9376268 |
G/G |
209(44.75%) |
179(35.59%) |
1 |
|
A/G |
207(44.33%) |
243(48.31%) |
0.73(0.56-0.96) |
0.023* |
|
A/A |
51(10.92%) |
81(16.1%) |
0.54(0.36-0.81) |
0.003* |
|
rs1327475 |
G/G |
408(87.37%) |
409(81.31%) |
1 |
|
A/G |
59(12.63%) |
89(17.69%) |
0.66(0.47-0.95) |
0.025* |
|
A/A |
0(0%) |
5(0.99%) |
- |
0.998 |
|
rs7749390 |
G/G |
109(23.34%) |
145(28.83%) |
1 |
|
A/G |
250(53.53%) |
257(51.09%) |
1.29(0.96-1.75) |
0.096 |
|
A/A |
108(23.13%) |
101(20.08%) |
1.42(0.98-2.06) |
0.06 |
|
rs1327474 |
T/T |
437(93.58%) |
445(88.47%) |
1 |
|
C/T |
29(6.21%) |
56(11.13%) |
0.53(0.33-0.84) |
0.007* |
|
C/C |
1(0.21%) |
2(0.4%) |
0.51(0.05-5.64) |
0.582 |
|
rs2069727 |
T/T |
336(71.95%) |
382(75.94%) |
1 |
|
C/T |
118(25.27%) |
111(22.07%) |
1.21(0.9-1.63) |
0.212 |
|
C/C |
13(2.78%) |
10(1.99%) |
1.48(0.64-3.41) |
0.361 |
|
rs1861493 |
A/A |
182(38.97%) |
179(35.59%) |
1 |
|
G/A |
222(47.54%) |
249(49.5%) |
0.88(0.67-1.15) |
0.348 |
|
G/G |
63(13.49%) |
75(14.91%) |
0.83(0.56-1.22) |
0.341 |
|
rs1861494 |
T/T |
189(40.47%) |
183(36.38%) |
1 |
|
C/T |
222(47.54%) |
246(48.91%) |
0.87(0.67-1.15) |
0.332 |
|
C/C |
56(11.99%) |
74(14.71%) |
0.73(0.49-1.1) |
0.13 |
|
rs2069705 |
G/G |
259(55.46%) |
321(63.82%) |
1 |
|
A/G |
180(38.54%) |
164(32.6%) |
1.36(1.04-1.78) |
0.024* |
|
A/A |
28(6%) |
18(3.58%) |
1.93(1.04-3.56) |
0.036* |
|
SNPs: Single nucleotide polymorphisms; OR: Odds ratio; CI: Confidence interval. aP values were calculated by unconditional logistic regression analysis. *P<0.05 indicates statistical significance. Bonferroni’s multiple adjustment was applied to the level of significance, which was set at P< 0.0011 (0.05/45).
In Table 5, the rs9376268 mutant genotypes “A/A” and “A/G” compared to the wild genotype “G/G” significantly decreased the PTB risk (“A/A” OR=0.54, 95%CI=0.36-0.81, P=0.003; “A/G” OR=0.73, 95%CI=0.56-0.96, P=0.023). The significantly protective effects were also found in the rs1327475 variant genotype “A/G” and rs1327474 variant genotype “C/T” (rs1327475 “A/G” vs “G/G”, OR=0.66, 95%CI=0.47-0.95, P=0.025; rs1327474 “C/T” vs “T/T”, OR=0.53, 95%CI=0.33-0.84, P=0.007). Additionally, rs2069705 mutant genotype “A/A” and “A/G” compared to the wild genotype “G/G” were associated with a statistically significantly increased the PTB risk (“A/A” OR=1.93, 95%CI=1.04-3.56, P=0.036; “A/G” OR=1.36, 95%CI=1.04-1.78, P=0.024). However, after Bonferroni’s multiple adjustment applied to our data, we only found rs9376268 was significantly associated with susceptibility of PTB under additive model.
Haplotype association analysis
Using haplotype analysis, two blocks were respectively detected among the IFNGR1 and IFNG SNPs (Figure 1, Figure 2). In block 1 for IFNGR1 gene, a pair of five SNPs had linkage disequilibrium (LD): rs9376267, rs9376268, rs1327475, rs7749390 and rs1327474), while the block 2 for IFNG gene included four closely linked SNPs rs2069727, rs1861493, rs1861494 and rs2069705. The association between haplotype and the PTB risk was evaluated by unconditional logistic regression analysis and the result was showed in Table 6. For the block 1, we discovered three haplotypes associated with an depressed PTB risk: “C-G-G-A-C” (OR=0.52, 95%CI=0.33-0.82, P=0.005), “C-G-A-G-T” (OR=0.62, 95%CI=0.44-0.88, P=0.007) and “T-A-G-G-T” (OR=0.75, 95%CI=0.62-0.9, P=0.002), while another three haplotypes was found associate with an elevated PTB risk: “C-G-G-A-T” (OR=1.36, 95%CI=1.13-1.64, P=0.001), “T-G-G-G-T” (OR=2.2, 95%CI=1.38-3.52, P<0.001) and “C-G-G-G-T” (OR=2.61, 95%CI=1.5-4.56, P<0.001). In the meantime, we just found one haplotype “T-A-T-A” in block 2 had a modest association with increasing PTB risk (OR=1.39, 95%CI=1.01-1.92, P=0.043).
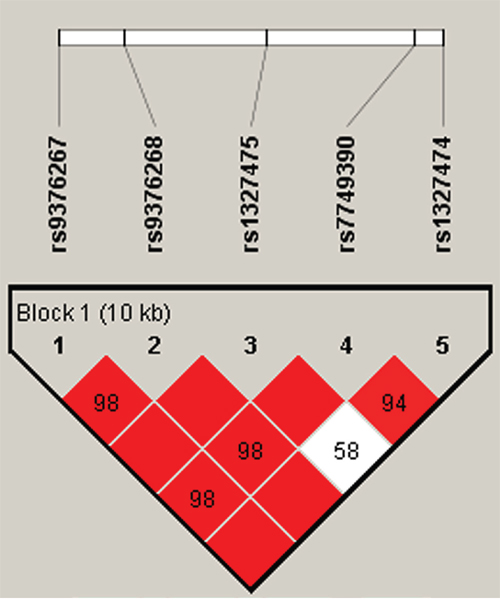
Figure 1: Haplotype block map for part of SNPs in the IFNGR1 gene. One block in the figure showed higher LD in the haplotype map, and the block was composed of five SNPs: rs9376267, rs9376268, rs1327475, rs7749390 and rs1327474. The D value was 1, and these five SNPs tended to be co-inherited.
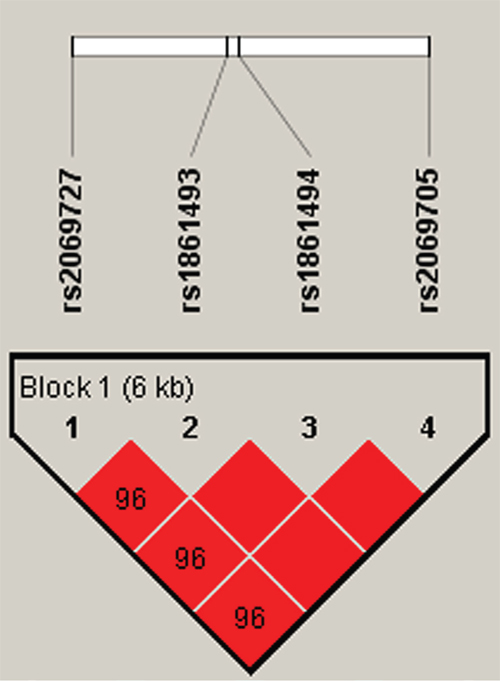
Figure 2: Haplotype block map for part of SNPs in the IFNG gene. Haplotype-Block Map for IFNG based on SNPs rs2069727, rs1861493 rs1861494 and rs2069705 which were included in the block. That the D value was 0.96 indicated strong linkage disequilibrium between the two SNPs.
Table 6: Haplotype frequencies and their associations with PTB risk.
Gene |
SNPs |
Haplotype |
Frequency |
OR |
95% CI |
Pa |
|
|---|---|---|---|---|---|---|---|
Case |
Control |
||||||
IFNGR1 |
rs9376267|rs9376268|rs1327475|rs7749390|rs1327474 |
C-G-G-A-C |
0.031 |
0.059 |
0.52 |
0.33-0.82 |
0.005* |
C-G-G-A-T |
0.468 |
0.396 |
1.36 |
1.13-1.64 |
0.001* |
||
C-G-A-G-T |
0.064 |
0.097 |
0.62 |
0.44-0.88 |
0.007* |
||
T-A-G-G-T |
0.331 |
0.398 |
0.75 |
0.62-0.9 |
0.002* |
||
T-G-G-G-T |
0.058 |
0.027 |
2.2 |
1.38-3.52 |
<0.001* |
||
C-G-G-G-T |
0.046 |
0.018 |
2.61 |
1.5-4.56 |
<0.001* |
||
IFNG |
rs2069727|rs1861493|rs1861494|rs2069705 |
C-A-T-A |
0.154 |
0.127 |
1.24 |
0.96-1.6 |
0.094 |
T-A-T-A |
0.097 |
0.072 |
1.39 |
1.01-1.92 |
0.043* |
||
T-G-C-G |
0.357 |
0.389 |
0.87 |
0.72-1.05 |
0.139 |
||
T-A-T-G |
0.376 |
0.405 |
0.88 |
0.73-1.06 |
0.186 |
||
aP values were calculated by unconditional logistic regression analysis. *P < 0.05 indicates statistical significance.
DISCUSSION AND CONCLUSION
In the current study, we investigated the potential relationships between 9 SNPs from IFNGR1 and IFNG and risk of PTB in 467 cases and 503 healthy controls subjects of the Chinese Tibetan population. The result of genotype model analysis showed that rs9376268, rs1327475, rs1327474 and rs2069705 had a significantly correlation with the risk of PTB (P<0.05). Moreover, rs9376268 still associated with the PTB risk after Bonferroni’s multiple adjusted (P<0.001). In the haplotype analysis, we found that the haplotypes with the frequency more than 1% in the rs9376267-rs9376268-rs1327475-rs7749390-rs1327474 block were extremely significant associated with the PTB risk (P<0.01). These results suggested that variants of IFNGR1 may have a close relation with the PTB risk in Chinese Tibetan population.
INFGR1 gene, located in 6q23.3, consists of seven exons and encodes ligand binding chain (alpha) of the interferon-gamma receptor which plays a crucial role in receptor trafficking and signal transduction [12]. Evidence have identified that IFNGR1 plays an crucial role in regulating immune response against Mycobacterium tuberculosis [13, 14]. Moreover, Defects in human IFNGR1 have been shown to be associated with dominant susceptibility to mycobacterial infection [15]. The ethnic and racial differences in the vulnerability of humans to PTB with respect to IFNGR1 and IFNG polymorphisms have been reported in many races, but not in Chinese Tibetans. For example, Naderi M et al, showed that rs7749390 polymorphism of IFNGR1 was significantly decreased the PTB risk, but this association was not found in rs1327474 in Zahedan, Southeast Iran [16]. Lü et al. investigated rs1327475 and rs7749390 polymorphisms in PTB patients and found that the rs1327475 polymorphisms increased the PTB risk, while rs7749390 variant reduced the risk PTB in Chinese Han population [11]. Shin et al. performed a correlation analysis between polymorphisms of rs9376268 and rs9376267 and the PTB risk, and revealed that these two loci variants were marginally increased the PTB risk in the Korean population [17].
Here, we examined whether polymorphism of IFNGR1 were associated with the incidence of PTB in the Chinese Tibetans. From the single locus association analysis, we found that rs9376268, rs1327475 and rs1327474 variants decreased the PTB risk, and the similar association for these three loci under dominant and additive model was also identified. Unfortunately, after Bonferroni’s correction was applied to our data, the association was attenuated, and if the sample size is larger, this association may be enhanced. The discrepancy between studies regarding the effect of IFGNR1 variants on PTB risk may be due to the ethnic and regional differences.
IFNG gene, located in 12q15, encodes a soluble cytokine which is secreted by cells of both innate and acquired immune system. Study found that IFN-γ played a critical role in TB protection, and the quantitative parameters of IFN-γ secretion inflected the activity of the TB infectious process [18, 19]. It is reported that study have investigated the variants of IFNG for PTB susceptibility in north Indians, and rs1861494 and rs1861493 mutations had been found to be a risk factor for the developing PTB [20]. Variant of rs2069727 was found associated with increase the risk of hepatocellular carcinoma [21], and study had identified the correlation of rs2069705 with lupus erythematosus susceptibility in Chinese Han population [22]. In this present study, we investigated this association in Chinese Tibetans, and our result showed that the mutations of these loci were relatively weak with the PTB risk. Although this study had sufficient statistical power, there were still some intrinsic limitations. For example, the sample size of this study is relatively small. Subsequently, we will pay more attention to the influence of IFNG polymorphisms on PTB risk.
In summary, our study revealed IFNGR1 gene may have a significant association with the PTB risk in the Chinese Tibetan population, and provides theoretical foundation for personalized medicine of Tibetan PTB patients. Our findings need further verified with studies with enlarge sample size, and future studies are required to determine the functional consequences of these polymorphisms in pulmonary tuberculosis and the biological mechanism underlying this association.
MATERIALS AND METHODS
Study participants
This case-control study consisted of 467 cases of tuberculosis and 503 healthy controls. Tibetan PTB patients were recruited from the third Hospital of Tibet Autonomous Region from October 2012 to September 2013 in Lhasa, China. The diagnosis of PTB was based on clinical radiological, sputum acid-fast bacillus smear positivity, culture, and response to antituberculosis chemotherapy as described previously [23, 24]. At the same time, stochastic samples of 503 healthy controls were enlisted from the same geographical origin and were living in the same region as the patients with PTB. The controls had no previous clinical history or laboratory criteria suggestive of PTB infection. All subjects were all Tibetan Chinese living in Lhasa and nearby.
Subjects who possessed chronic inflammatory and conditions involving vital organs such as the HIV positive and known to present any autoimmune, family history of cancer or other diseases were excluded from this study. For controls, a standardized epidemiological questionnaire including residential region, age, smoking status, alcohol use, ethnicity and education level was used to collect personal data. As for patients, we collected related information through consultation with treating physicians or medical chart review. Unfortunately, in addition to age and gender, a considerable number of participates had no relevant information containing smoking status and alcohol use.
Ethics committee statement
This case-control study was performed in compliance with the principles of the Declaration of Helsinki of the World Medical Association and obtained the permission from the Ethics Committee of the third Hospital of Tibet Autonomous Region. All of the participants were informed of the case-control study and their consents were obtained.
SNPs selection and genotyping
According to the past studies [4, 11, 17], rs9376267, rs9376268, rs1327475, rs7749390 and rs1327474 had been found study with the risk of PTB in other populations. Additionally, rs2069727, rs1861493, rs1861494 and rs2069705 in IFNG were also investigated the connection with the PTB risk in this present study.
We collected blood sample from each patient during laboratory examination after their recruitment. DNA was extracted from whole blood samples using the Gold Mag-Mini Whole Blood Genomic DNA Purification Kit [25]. DNA concentration was measured by spectrometry (DU530 UV/VIS spectrophotometer, Beckman Instruments, Fullerton, CA, USA). We used Sequenom MassARRAY Assay Design 4.0 Software (Agena Bioscience Inc.) to design a Multiplexed SNP Mass-EXTEND assay [26]. The SNPs were genotyped with a Sequenom MassARRAY RS1000 using the standard protocol recommended by the manufacturer [26]. Data management and analysis were performed using Sequenom Typer 4.0 software (Agena Bioscience Inc) [26, 27].
Statistical analysis
We used the SPSS 21.0 statistical packages (SPSS Inc., Chi-cago, IL, USA) and Microsoft Excel for statistical analysis. All P-values in this study were two sided, and P<0.05 was considered the threshold for statistical significance. We tested for differences in tSNP genotype distribution between cases and controls using the χ2 test [28]. Each SNP of the genotype frequencies in control subjects were checked by using Hardy-Weinberg equilibrium (HWE). Allele and genotype frequencies for each SNP of PTB patients and control subjects were compared using Chi-square test. Odds ratios (ORs) and 95% confidence intervals (CIs) were tested by unconditional logistic regression analysis to evaluate the effects of the polymorphisms on the risk of PTB [29]. Therefore, Bonferroni’s multiple adjustment was applied to the level of significance, which was set at P < 0.0011 (0.05/45). Finally, we used SNP stats, website software to test the associations between certain SNPs and the risk of PTB in three models (dominant, recessive, and additive). The Haploview software package (version 4.2) and SHEsis software platform (http://analysis.bio-x.cn) were used to assess linkage disequilibrium, haplotype construction, and the genetic association between polymorphisms, with a D’ > 0.8 indicating that related SNPs formed a single block [30].
ACKNOWLEDGMENTS AND FUNDING
This work was supported by National Natural Science Foundations (No. 81560516) and Major Cultivation Project of Xizang Minzu University (NO. 12myZP04). The authors declare that they have no competing interests. We thanked all the patients and individuals for their participation in this study.
CONFLICTs OF INTEREST
The authors declare no conflicts of interest.
REFERENCES
1. Toujani S, Salah NB, Cherif J, Mjid M, Ouahchy Y, Zakhama H, Daghfous J, Beji M, Rhouma MB, Louzir B. Primary infection and pulmonary tuberculosis. Rev Pneumol Clin. 2015; 71: 73-82. https://doi.org/10.1016/j.pneumo.2015.02.001.
2. Siroka A. 2016 Global TB Report. 2016.
3. Zumla A, George A, Sharma V, Herbert N, Ilton BMO. WHO's 2013 global report on tuberculosis: successes, threats, and opportunities. Lancet. 2013; 382: 1765-1767. https://doi.org/10.1016/S0140-6736(13)62078-4.
4. He J, Wang J, Lei D, Ding S. Analysis of Functional SNP in Ifng/Ifngr1 in Chinese Han Population with Tuberculosis. Scand J Immunol. 2010; 71: 452-458. https://doi.org/10.1111/j.1365-3083.2010.02393.x.
5. Comstock GW. Tuberculosis in twins: a re-analysis of the Prophit survey. Am Rev Respir Dis. 1978; 117: 621-624. https://doi.org/10.1164/arrd.1978.117.4.621.
6. Png E, Alisjahbana B, Sahiratmadja E, Marzuki S, Nelwan R, Balabanova Y, Nikolayevskyy V, Drobniewski F, Nejentsev S, Adnan I, Van de Vosse E, Hibberd ML, Van Crevel R, et al. A genome wide association study of pulmonary tuberculosis susceptibility in Indonesians. BMC Med Genet. 2012; 13: 5-14. https://doi.org/10.1186/1471-2350-13-5.
7. Coscolla M, Gagneux S. Consequences of genomic diversity in Mycobacterium tuberculosis. Semin Immunol. 2014; 26: 431-444. https://doi.org/10.1016/j.smim.2014.09.012.
8. O'Garra A, Redford PS, Mcnab FW, Bloom CI, Wilkinson RJ, Berry MPR. The Immune Response in Tuberculosis. Annu Rev Immunol. 2013; 31: 475-527. https://doi.org/10.1146/annurev-immunol-032712-095939.
9. Möller M, Hoal EG. Current findings, challenges and novel approaches in human genetic susceptibility to tuberculosis. Tuberculosis. 2010; 90: 71-83. https://doi.org/10.1016/j.tube.2010.02.002.
10. Reinhardt RL, Liang HE, Bao K, Price AE, Mohrs M, Kelly BL, Locksley RM. A Novel Model for IFN-γ–Mediated Autoinflammatory Syndromes. J Immunol. 2015; 194: 2358-2368. https://doi.org/10.4049/jimmunol.1401992.
11. Lü J, Pan H, Chen Y, Tang S, Feng Y, Qiu S, Zhang S, Wu L, Xu R, Peng X, Wang J, Lu C. Genetic polymorphisms of IFNG and IFNGR1 in association with the risk of pulmonary tuberculosis. Gene. 2014; 543: 140-144. https://doi.org/10.1016/j.gene.2014.03.042.
12. Bach EA, Aguet M, Schreiber RD. The IFN gamma receptor: a paradigm for cytokine receptor signaling. Annu Rev Immunol. 1997; 15: 563-591. https://doi.org/10.1146/annurev.immunol.15.1.563.
13. Desvignes L, Ernst JD. Interferon-γ-Responsive Nonhematopoietic Cells Regulate the Immune Response to Mycobacterium tuberculosis. Immunity. 2009; 31: 974-985. https://doi.org/10.1016/j.immuni.2009.10.007.
14. Noonsong EN, Ahmed CM, Dabelic R, Canton J, Johnson HM. Controlling nuclear JAKs and STATs for specific gene activation by IFNγ. Biochem Biophys Res Commun. 2011; 410: 648-653. https://doi.org/10.1016/j.bbrc.2011.06.047.
15. Jouanguy E, Lamhamedi-Cherradi S, Lammas D, Dorman SE, Fondaneche MC, Dupuis S, Doffinger R, Altare F, Girdlestone J, Emile JF, Ducoulombier H, Edgar D, Clarke J, et al. A human IFNGR1 small deletion hotspot associated with dominant susceptibility to mycobacterial infection. Nat Genet. 1999; 21: 370-378. https://doi.org/10.1038/7701.
16. Naderi M, Hashemi M, Rezaei M, Safdari A. Association of Genetic Polymorphisms of IFNGR1 with the Risk of Pulmonary Tuberculosis in Zahedan, Southeast Iran. Tuberc Res Treat. 2015; 2015: 292505. https://doi.org/10.1155/2015/292505.
17. Shin JG, Park BL, Kim LH, Namgoong S, Kim JO, Chang HS, Park JS, Jang AS, Park SW, Kim DJ, Kim KU, Kim YG, Uh ST, et al. Association study of polymorphisms in interferon-γ receptor genes with the risk of pulmonary tuberculosis. Mol Med Rep. 2015; 12: 1568-1578. https://doi.org/10.3892/mmr.2015.3544.
18. Nikitina IY, Panteleev AV, Sosunova EV, Karpina NL, Bagdasarian TR, Burmistrova IA, Andreevskaya SN, Chernousova LN, Vasilyeva IA, Lyadova IV. Antigen-Specific IFN-γ Responses Correlate with the Activity of M. tuberculosis Infection but Are Not Associated with the Severity of Tuberculosis Disease. J Immunol Res. 2016; 2016:7249369. https://doi.org/10.1155/2016/7249369.
19. Lee J, Kornfeld H. Interferon-γ Regulates the Death of M. tuberculosis-Infected Macrophages. J Cell Death. 2010; 3: 1-11. https://doi.org/10.4137/JCD.S2822.
20. Abhimanyu, Mridula B, Pankaj J. Footprints of genetic susceptibility to pulmonary tuberculosis: Cytokine gene variants in north Indians. Indian J Med Res. 2012; 135: 763-770.
21. Li H, Liu F, Zhu H, Zhou X, Lu J, Hong C, Hu J. Interaction Between Polymorphisms of IFN-γ and MICA Correlated with Hepatocellular Carcinoma. Med Sci Monit 2016; 22: 549-553. https://doi.org/10.12659/MSM.895101.
22. Leng RX, Pan HF, Liu J, Yang XK, Zhang C, Tao SS, Wang DG, Li XM, Li XP, Yang W, Ye DQ. Evidence for genetic association of TBX21 and IFNG with systemic lupus erythematosus in a Chinese Han population. Sci Rep. 2016; 6: 22081. https://doi.org/10.1038/srep22081.
23. Naderi M, Hashemi M, Kouhpayeh H, Ahmadi R. The status of serum procalcitonin in pulmonary tuberculosis and nontuberculosis pulmonary disease. J Pak Med Assoc. 2009; 59: 647-648.
24. Kouhpayeh HR, Hashemi M, Hashemi SA, Moazeniroodi A, Naderi M, Sharifimood B, Taheri M, Mohammadi M, Ghavami S. R620W functional polymorphism of protein tyrosine phosphatase non-receptor type 22 is not associated with pulmonary tuberculosis in Zahedan, southeast Iran. Genet Mol Res. 2012; 11: 1075-1081. https://doi.org/10.4238/2012.
25. Carracedo. Forensic DNA Typing Protocols. Springer Berlin. 2007; 297.
26. Trembizki E, Smith H, Lahra MM, Chen M, Donovan B, Fairley CK, Guy R, Kaldor J, Regan D, Ward J, Nissen MD, Sloots TP, Whiley DM. High-throughput informative single nucleotide polymorphism-based typing of Neisseria gonorrhoeae using the Sequenom MassARRAY iPLEX platform. J Antimicrob Chemother. 2014; 69: 1526-1532. https://doi.org/10.1093/jac/dkt544.
27. Thomas RK, Baker AC, Debiasi RM, Winckler W, Laframboise T, Lin WM, Wang M, Feng W, Zander T, Macconaill L, Lee JC, Nicoletti R, Hatton C, et al. High-throughput oncogene mutation profiling in human cancer. Nat Genet. 2007; 39: 347-351. https://doi.org/10.1038/ng1975.
28. Adamec C. Example of the use of the nonparametric test. Test X2 for comparison of 2 independent examples. Cesk Zdrav. 1964; 12: 613-619.
29. Bland JM, Altman DG. Statitics Notes. The odds ratio. BMJ. 2000; 320: 1468.
30. Li Z, Zhang Z, He Z, Ting W, Li T, Zeng Z, He L, Shi Y. A partition-ligation-combination-subdivision EM algorithm for haplotype inference with multiallelic markers: update of the SHEsis (http://analysis.bio-x.cn). Cell Res. 2009; 19: 519-523. https://doi.org/10.1038/cr.2009.33.