
INTRODUCTION
Intratumoral heterogeneity (ITH), referring to phenotypic differences between cancer cells within the same tumor, has become a major focus of research with advances in molecular technologies. It affects important behavioral features including metastatic potential, angiogenesis, migration, evasion of antitumor immunity, and activation of metabolic pathways [1, 2]. This intratumoral diversity leads to therapeutic resistance and presents a major obstacle to cure [3].
Traditionally, genetic differences between cancer cells received most of the attention as causes of heterogeneity. However, epigenetic factors as well as environmental and stochastic factors are now also being examined. Epigenetic heterogeneity contributes even more to ITH than genetic heterogeneity, as it usually involves epigenetic silencing by DNA methylation and is enzymatically reversible [4, 5]. Environmental factors influencing heterogeneity include selection pressure on tumor cells (e.g. chemotherapy), as well as interactions with stromal cells and non-cellular elements in the tumor milieu [6, 7], while stochastic mechanisms introduce transient phenotypic variants within isogenic tumors [8]. Prevailing models of ITH include the clonal evolution model and the cancer stem cell model; rather than being mutually exclusive, these models contribute to varying extents to different tumors and create both spatial and temporal ITH [6, 9, 10].
Studies of ITH have explored somatic mutations, gene copy number alterations, and RNA expression, using both bulk tumors and single cells, comparing premalignant and malignant counterparts and multiple regions in the same tumor, as well as primary tumors and metastases [6, 11-20]. While the importance of ITH in tumors is clear, the difficulty in measuring the extent of ITH and interpreting its impact on clinical outcomes has limited its use in the clinical setting.
In a previous study, Park et al. investigated the cellular and genetic heterogeneity of breast cancers using two ecological diversity indices: the Shannon index and the Simpson index [19]. Although the Shannon index has been used in subsequent studies [6, 13, 15, 21], its prognostic significance has not been evaluated. In this study, we investigated the correlation between the Shannon index for gene copy number variation and clinicopathologic features of breast cancer, and evaluated its prognostic value in breast cancer.
RESULTS
c-MYC copy number variation and diversity indices
We chose to investigate intratumoral genetic heterogeneity using c-MYC, since the c-MYC locus (8q24) is in one of the most unstable chromosomal regions and displays frequent copy number gain or amplification in all subtypes of breast cancer [22-24]. c-MYC amplification, defined as a mean c-MYC copy number of 6.0 or higher, was found in 22 (7.8%) of 283 invasive breast cancer samples in the test set (Figure 1A). c-MYC copy number gain, defined as a c-MYC copy number greater than or equal to three, was found in 115 cases (40.6%; Figure 1B). Regional heterogeneity was observed in 32 cases (11.3%), and genetic heterogeneity in 77 cases (27.2%).
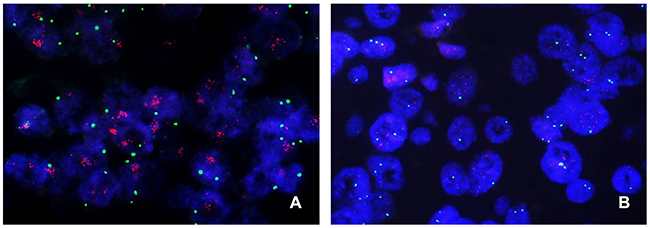
Figure 1: Representative images of c-MYC FISH in breast cancer. (A) A case of c-MYC amplification with a substantially higher number of c-MYC (red) signals as large clusters than the normal number of centromeric (green) signals. (B) A case of c-MYC copy number gain with an increased number of three or more c-MYC signals per cell. Note that some cells have a copy number of greater than six.
We then calculated the Shannon index of c-MYC copy number, which ranged from 0.071 to 2.827, with a median of 1.034. We also calculated the Simpson index and found that it ranged from 0.026 to 0.934, with a median value of 0.551. Since the two diversity indices were strongly correlated (r=0.966; p<0.001; Figure 2A), we used only the Shannon index from then on. The Shannon index was highly correlated with average c-MYC copy number (r=0.849; p<0.001; Figure 2B), and when we analyzed the distribution of the index with respect to c-MYC heterogeneity and amplification, its average was higher in tumors with genetic heterogeneity than in those with neither heterogeneity nor amplification (p<0.001), but it was lower than in tumors with amplification but without heterogeneity (p<0.001) (Figure 2C). In terms of regional heterogeneity, the index was higher in tumors with regional heterogeneity than in those that had neither heterogeneity nor amplification (p<0.001), and it tended to be lower than in tumors with amplification without heterogeneity (p=0.059) (Figure 2D).
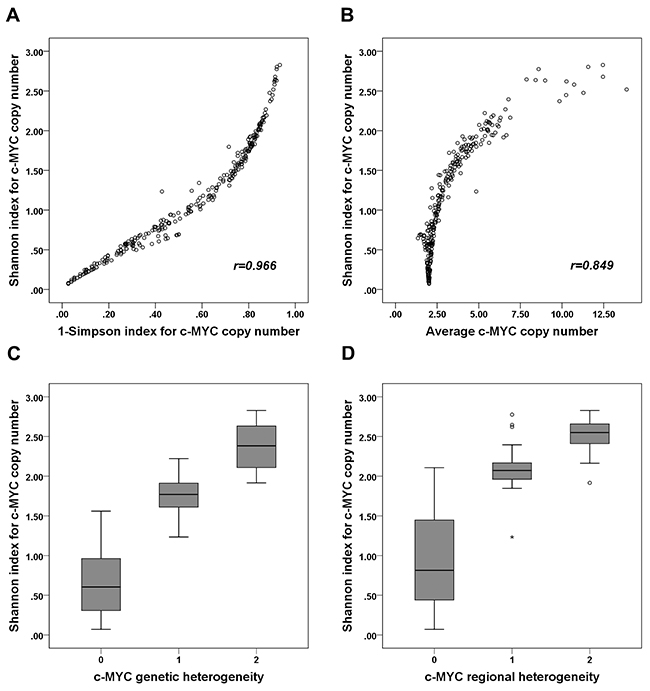
Figure 2: Correlation between Shannon index and 1-Simpson index, average c-MYC copy number, and c-MYC heterogeneity. (A) The Shannon and 1-Simpson indices of c-MYC copy number are strongly positively correlated (r=0.966). (B) The Shannon index and average c-MYC copy number are also strongly positively correlated (r=0.849). (C) The Shannon index of c-MYC copy number is higher in tumors with genetic heterogeneity than in those with neither heterogeneity nor amplification, but it is lower than in those with amplification (without heterogeneity). (D) The Shannon index of c-MYC copy number is higher in tumors with regional heterogeneity than in those with neither regional heterogeneity nor amplification, but it tends to be lower than in those with amplification (without heterogeneity). (C, D: 0, tumors with neither heterogeneity nor amplification; 1, tumors with heterogeneity; 2; tumors with amplification without heterogeneity).
The association between c-MYC copy number variation and clinicopathologic features
We evaluated the relationship between c-MYC copy number variation and clinicopathologic features (Table 1). c-MYC amplification was associated with high histologic grade, p53 overexpression, high Ki-67 proliferation index, and negative hormone receptor status (all p<0.05). c-MYC copy number gain was also associated with all of the clinicopathologic features associated with c-MYC amplification in addition to HER2 amplification (all p<0.01). When we divided the samples into high index and low index groups using the median value, high Shannon index was associated with high histologic grade, lymphovascular invasion, p53 overexpression, high Ki-67 index, negative hormone receptor status, and HER2 amplification (all p<0.05). The index was also significantly different according to breast cancer subtype (p<0.001, ANOVA test): it was significantly higher in the luminal B, HER2-positive, and triple-negative subtypes than in the luminal A subtype (p<0.001, p=0.004, p<0.001, respectively; Figure 3).
Table 1: Relationship between c-MYC copy number variation and clinicopathological features of tumors in the test set
Clinicopathologic characteristic |
c-MYC amplification |
p value |
c-MYC copy number gain |
p value |
Shannon index for c-MYC copy number variation |
p value |
|||
|---|---|---|---|---|---|---|---|---|---|
Absent No. (%) |
Present No. (%) |
Absent No. (%) |
Present No. (%) |
Low No. (%) |
High No. (%) |
||||
T stage |
1.000 |
0.578 |
0.206 |
||||||
T1-T2 |
245 (93.9) |
21 (95.5) |
159 (94.6) |
107 (93.0) |
136 (95.8) |
130 (92.2) |
|||
T3-T4 |
16 (6.1) |
1 (4.5) |
9 (5.4) |
8 (7.0) |
6 (4.2) |
11 (7.8) |
|||
N stage |
0.746 |
0.323 |
0.108 |
||||||
N0 |
128 (49.0) |
10 (45.5) |
86 (51.2) |
52 (45.2) |
76 (53.5) |
62 (44.0) |
|||
N1-N3 |
133 (51.0) |
12 (54.5) |
82 (48.8) |
63 (54.8) |
66 (46.5) |
79 (56.0) |
|||
Histologic grade |
<0.001 |
<0.001 |
<0.001 |
||||||
I & II |
153 (58.6) |
4 (18.2) |
127 (75.6) |
30 (26.1) |
115 (81.0) |
42 (29.8) |
|||
III |
108 (41.4) |
18 (81.8) |
41 (24.4) |
85 (73.9) |
27 (19.0) |
99 (70.2) |
|||
LVI |
0.795 |
0.390 |
0.028 |
||||||
Absent |
138 (52.9) |
11 (50.0) |
92 (54.8) |
57 (49.6) |
82 (59.2) |
65 (46.1) |
|||
Present |
123 (47.1) |
11 (50.0) |
76 (45.2) |
58 (50.4) |
58 (40.8) |
76 (53.9) |
|||
P53 overexpression |
0.002 |
0.004 |
<0.001 |
||||||
Absent |
210 (80.5) |
11 (50.0) |
141 (83.9) |
80 (69.6) |
124 (87.3) |
97 (68.8) |
|||
Present |
51 (19.5) |
11 (50.0) |
27 (1.1) |
35 (30.4) |
18 (12.7) |
44 (31.2) |
|||
Ki-67 index |
0.004 |
<0.001 |
<0.001 |
||||||
<20% |
153 (58.6) |
6 (27.3) |
118 (70.2) |
41 (35.7) |
107 (75.4) |
52 (36.9) |
|||
≥20% |
108 (41.4) |
16 (72.7) |
50 (29.8) |
74 (64.3) |
35 (24.6) |
89 (63.1) |
|||
ER |
0.033 |
<0.001 |
<0.001 |
||||||
Negative |
74 (28.4) |
11 (50.0) |
31 (18.5) |
54 (47.0) |
23 (16.2) |
62 (44.0) |
|||
Positive |
187 (71.6) |
11 (50.0) |
137 (81.5) |
61 (53.0) |
119 (83.8) |
79 (56.0) |
|||
PR |
0.036 |
<0.001 |
<0.001 |
||||||
Negative |
106 (40.6) |
14 (63.6) |
54 (32.1) |
66 (57.4) |
43 (30.3) |
77 (54.6) |
|||
Positive |
155 (59.4) |
8 (36.4) |
114 (67.9) |
49 (42.6) |
99 (69.7) |
64 (45.4) |
|||
HER2 |
0.552 |
0.002 |
0.010 |
||||||
Negative |
218 (83.5) |
17 (77.3) |
149 (88.7) |
86 (74.8) |
126 (88.7) |
109 (77.3) |
|||
Positive |
43 (16.5) |
5 (22.7) |
19 (11.3) |
29 (25.2) |
16 (11.3) |
32 (22.7) |
|||
P values were calculated by the chi-square or Fisher’s exact test.
LVI, lymphovascular invasion; ER, estrogen receptor; PR, progesterone receptor; HER2, human epidermal growth factor receptor 2
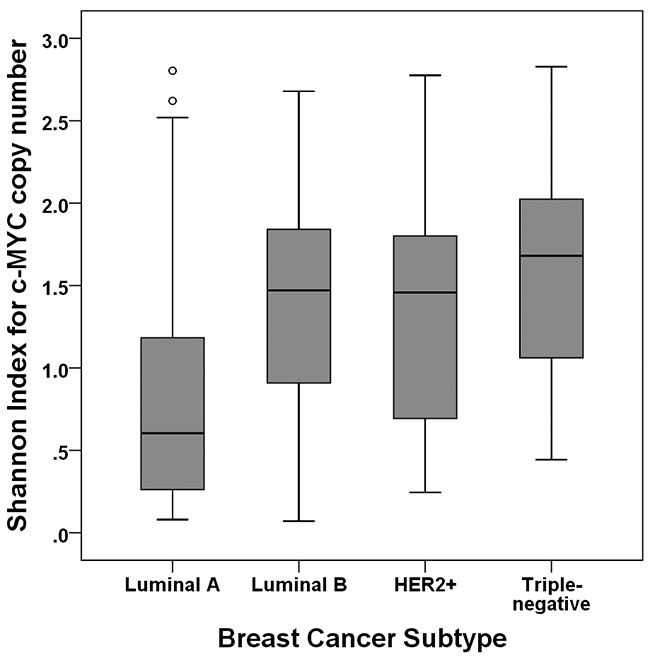
Figure 3: Shannon index according to subtype of breast cancer. The Shannon index is significantly higher in the luminal B, HER2-positive, and triple-negative subtypes than in the luminal A subtype.
Association between Shannon index and clinical outcome
Most of the patients in the test set received the standard treatment and regular follow-up. The median follow-up period was 84 months (range, 1-144 months). When we analyzed the disease-free survival of patients with respect to c-MYC amplification and copy number gain, we found that amplification of the c-MYC gene was not associated with patient survival (p=0.324) whereas c-MYC copy number gain showed a tendency to be correlated with decreased disease-free survival (p=0.097). However a high Shannon index calculated using c-MYC copy number and the cutoff values obtained by ROC curve analysis revealed a significant association with poor disease-free survival (p=0.030, log rank test; Figure 4A). Because the Shannon index was high in tumors with c-MYC amplification, we performed a subgroup analysis using cases without c-MYC amplification to rule out the influence of c-MYC amplification on the Shannon index. This showed that a high Shannon index was associated with decreased survival in this subgroup as well (p=0.014; Figure 4B).
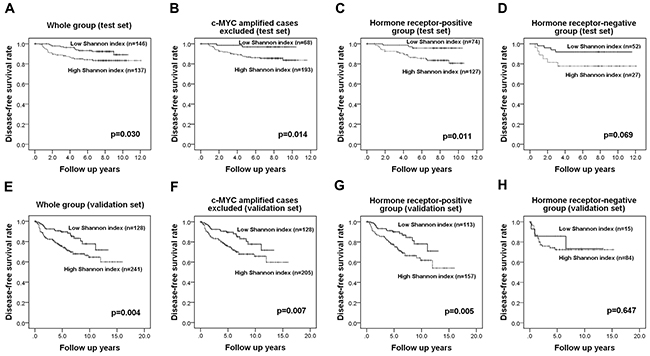
Figure 4: Kaplan-Meier survival analyses based on the Shannon index of c-MYC copy number variation. In the test set, a high Shannon index is a significant adverse prognostic factor in the whole group (A), in tumors without c-MYC amplification (B), and in the hormone receptor-positive group (C) and shows a tendency be associated with adverse outcome in the hormone receptor-negative group (D). Survival analyses in the validation set shows that the index is also a significant prognostic factor in the whole group (E), in cases without c-MYC amplification (F), and in the hormone receptor-positive subgroup (G) but it is not proven to be a prognostic factor in the hormone receptor-negative group (H).
In univariate Cox regression analyses, high T stage (p=0.002), lymph node metastasis (p=0.002), lymphovascular invasion (p=0.005), and high Shannon index (p=0.035) correlated with an adverse clinical outcome in the whole group (Table 2). Adjuvant chemotherapy, radiation therapy, and endocrine therapy were not related to survival differences. In a multivariate analysis incorporating these covariates, only high T stage (p=0.024) and N stage (p=0.007) remained independent prognostic factors. However, when c-MYC-amplified cases were excluded, lymph node metastasis (p=0.005) and high Shannon index (p=0.046) also proved to be independent prognostic indicators of adverse outcome.
Table 2: Univariate and multivariate analyses of the association of disease-free survival in the test set with the Shannon index for c-MYC copy number variation
Variable |
Category |
Univariate analysis |
Multivariate analysis |
||||
|---|---|---|---|---|---|---|---|
HR |
95% CI |
P value |
HR |
95% CI |
P value |
||
Whole group |
|||||||
pT stage |
T1-2 vs. T3-4 |
3.991 |
1.646-9.678 |
0.002 |
2.818 |
1.147-6.922 |
0.024 |
pN stage |
N0 vs. N1-3 |
3.722 |
1.616-8.576 |
0.002 |
3.208 |
1.378-7.468 |
0.007 |
LVI |
Absent vs. Present |
3.026 |
1.407-6.512 |
0.005 |
1.780 |
0.764-4.146 |
0.181 |
Histologic grade |
I & II vs. III |
1.158 |
0.585-2.293 |
0.673 |
- |
- |
- |
Ki-67 index |
<20% vs. ≥20% |
1.571 |
0.792-3.118 |
0.196 |
- |
- |
- |
Hormone receptor |
Positive vs. Negative |
1.154 |
0.549-2.424 |
0.706 |
- |
- |
- |
HER2 amplification |
Negative vs. Positive |
1.932 |
0.898-4.158 |
0.092 |
1.571 |
0.717-3.440 |
0.259 |
Shannon index (c-MYC) |
Low vs. High |
2.181 |
1.058-4.499 |
0.035 |
1.897 |
0.916-3.929 |
0.085 |
Subgroup excluding C-MYC amplified cases |
|||||||
pT stage |
T1-2 vs. T3-4 |
3.413 |
1.300-8.956 |
0.013 |
1.972 |
0.736-5.283 |
0.177 |
pN stage |
N0 vs. N1-3 |
3.817 |
1.554-9.376 |
0.003 |
3.676 |
1.496-9.031 |
0.005 |
LVI |
Absent vs. Present |
2.534 |
1.154-5.567 |
0.021 |
1.321 |
0.557-3.134 |
0.527 |
Histologic grade |
I & II vs. III |
1.142 |
0.549-2.376 |
0.722 |
- |
- |
- |
Ki-67 index |
<20% vs. ≥20% |
1.560 |
0.753-3.231 |
0.232 |
- |
- |
- |
Hormone receptor |
Positive vs. Negative |
1.105 |
0.489-2.494 |
0.811 |
- |
- |
- |
HER2 amplification |
Negative vs. Positive |
2.471 |
1.124-5.430 |
0.024 |
2.089 |
0.946-4.611 |
0.068 |
Shannon index (c-MYC) |
Low vs. High |
5.059 |
1.203-21.281 |
0.027 |
4.359 |
1.029-18.471 |
0.046 |
Hormone receptor-positive subgroup |
|||||||
pT stage |
T1-2 vs. T3-4 |
3.083 |
0.915-10.391 |
0.069 |
1.605 |
0.464-5.557 |
0.455 |
pN stage |
N0 vs. N1-3 |
4.211 |
1.432-12.381 |
0.009 |
3.860 |
1.311-11.366 |
0.014 |
LVI |
Absent vs. Present |
2.410 |
0.991-5.860 |
0.052 |
1.313 |
0.505-3.411 |
0.576 |
Histologic grade |
I & II vs. III |
1.307 |
0.554-3.084 |
0.541 |
- |
- |
- |
Ki-67 index |
<20% vs. ≥20% |
2.091 |
0.916-4.770 |
0.080 |
1.454 |
0.621-3.405 |
0.389 |
HER2 amplification |
Negative vs. Positive |
1.727 |
0.587-5.079 |
0.321 |
- |
- |
- |
Shannon index (c-MYC) |
Low vs. High |
4.269 |
1.268-14.370 |
0.019 |
3.862 |
1.145-13.023 |
0.029 |
HR, hazard ratio; LVI, lymphovascular invasion; HER2, human epidermal growth factor receptor 2; CI, confidence interval
Since the Shannon index also varied greatly according to hormone receptor status, we also performed a subgroup analysis by hormone receptor status using cut-off values based on ROC curve analysis in each subgroup. In the hormone receptor-positive group, a high Shannon index was correlated with a worse prognosis (p=0.011, log rank test; Figure 4C) while in the hormone receptor-negative group, it only showed a tendency to be correlated with poor clinical outcome (p=0.069, log rank test; Figure 4D). In a multivariate Cox regression analysis (Table 2), high N stage (p=0.014), and high Shannon index (p=0.029) proved to be independent predictive factors for poor clinical outcome in the hormone receptor-positive group.
Prognostic performance of the Shannon index of c-MYC copy number variation in a validation set
In a validation set of 369 invasive breast cancers, high Shannon index for c-MYC copy number variation also correlated with adverse clinicopathologic features including high histologic grade, lymphovascular invasion, p53 overexpression, high Ki-67 proliferation index, and negative hormone receptor status (all p<0.001; Supplementary Table 1). The median patient follow-up period was 72 months (range, 1-191 months), and there were no survival differences with regard to post-operative treatment modalities. In survival analyses, high Shannon index was associated with decreased disease-free survival in the whole group and in the subgroup excluding c-MYC- amplified cases (p=0.004, p=0.007, respectively, log-rank test; Figure 4E-4F). In subgroup analyses by hormone receptor status, a high Shannon index was associated with poor patient survival in the hormone receptor-positive group, but not in the hormone receptor-negative group (p=0.005, p=0.647, respectively; Figure 4G-4H). In addition to the Shannon index for c-MYC copy number, high T stage, lymph node metastasis, and lymphovascular invasion were found to be significant prognostic factors in univariate analyses. However, in multivariate analysis, Shannon index was not found to be an independent prognostic factor for disease-free survival in the whole group, in the subgroup excluding c-MYC-amplified cases, or in the hormone receptor-positive subgroup (Supplementary Table 2).
Validation of the prognostic impact of the Shannon index using FGFR1
We wondered whether the Shannon index for a different gene would also have significance as a prognostic factor. We therefore followed the same procedures in the test set with FGFR1 as we did with c-MYC. FGFR1 copy number variation was assessed in 281 of the 283 invasive breast cancers by FISH (all the tissue microarray cores has been lost in two cases). FGFR1 amplification was not significantly associated with any clinicopathologic features of breast cancer, but p53 overexpression and HER2 amplification tended to be elevated in tumors with FGFR1 amplification (p=0.089, p=0.085, respectively; Supplementary Table 3). A high Shannon index of FGFR1 copy number was correlated with high histologic grade and p53 overexpression (p=0.044, p=0.007, respectively; Supplementary Table 3), and the Shannon indices for c-MYC and FGFR1 were correlated (r=0.233; p<0.001; Figure 5). FGFR1 amplification is a well-known adverse prognostic factor in breast cancer, especially in hormone receptor-positive cases [25-27], and we found that FGFR1 amplification was correlated with decreased disease-free survival in the whole group and in the hormone receptor-positive subgroup, but not in the hormone receptor-negative subgroup (p=0.003, p=0.009, p=0.143, respectively). A high Shannon index for FGFR1 copy number variation was also correlated with decreased disease-free survival (p=0.003; Figure 6A). Again, when FGFR1-amplified cases were excluded, high Shannon index for FGFR1 copy number variation was associated with poor clinical outcome (p=0.032; Figure 6B). In a subgroup analysis by hormone receptor status, high Shannon index for FGFR1 copy number variation was correlated with poor clinical outcome in the hormone receptor-positive subgroup (p=0.002; Figure 6C) but not in the receptor-negative subgroup (p=0.532).
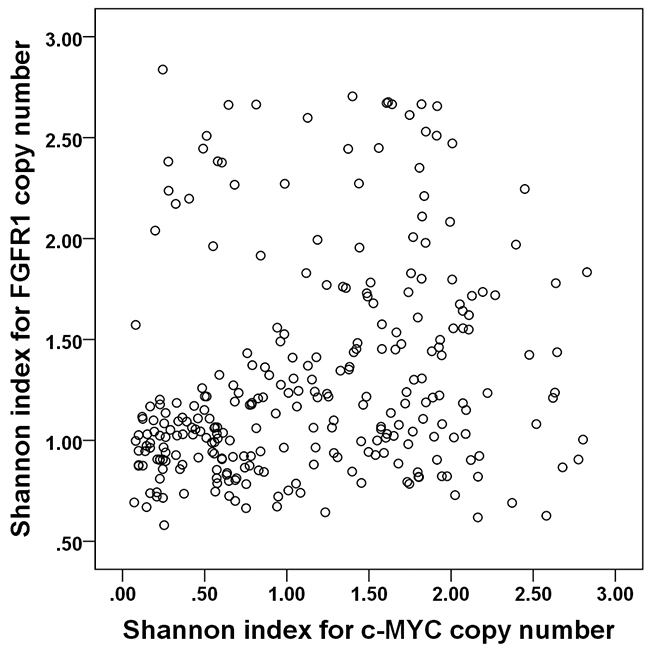
Figure 5: Correlation between Shannon indices of c-MYC and FGFR1 copy number variation. The Shannon indices for c-MYC and FGFR1 copy number variations are positively correlated (r=0.233).
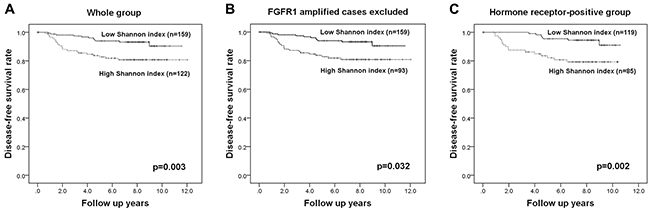
Figure 6: Kaplan-Meier survival analyses based on the Shannon index of FGFR1 copy number variation. High Shannon indices for FGFR1 copy number variation are associated with poor disease-free survival in the whole group (A), in those without FGFR1 amplification (B), and in the hormone receptor-positive subgroup (C).
In multivariate analyses (Table 3), high Shannon index proved to be an independent poor prognostic factor in the whole group as well as in the subgroup excluding FGFR1-amplified cases and in the hormone receptor-positive subgroup (p=0.003, p=0.028, p=0.005, respectively).
Table 3: Univariate and multivariate analyses of the association of disease-free survival in the test set with the Shannon index for FGFR1 copy number variation
Variable |
Category |
Univariate analysis |
Multivariate analysis |
||||
|---|---|---|---|---|---|---|---|
HR |
95% CI |
P value |
HR |
95% CI |
P value |
||
Whole group |
|||||||
pT stage |
T1-2 vs. T3-4 |
3.991 |
1.646-9.678 |
0.002 |
3.221 |
1.299-7.990 |
0.012 |
pN stage |
N0 vs. N1-3 |
3.722 |
1.616-8.576 |
0.002 |
3.390 |
1.446-7.945 |
0.005 |
LVI |
Absent vs. Present |
3.026 |
1.407-6.512 |
0.005 |
1.732 |
0.747-4.012 |
0.200 |
Histologic grade |
I & II vs. III |
1.158 |
0.585-2.293 |
0.673 |
- |
- |
- |
Ki-67 index |
<20% vs. ≥20% |
1.571 |
0.792-3.118 |
0.196 |
- |
- |
- |
Hormone receptor |
Positive vs. Negative |
1.154 |
0.549-2.424 |
0.706 |
- |
- |
- |
HER2 amplification |
Negative vs. Positive |
1.932 |
0.898-4.158 |
0.092 |
2.021 |
0.936-4.362 |
0.073 |
Shannon index (FGFR1) |
Low vs. High |
2.844 |
1.379-5.866 |
0.005 |
3.041 |
1.472-6.316 |
0.003 |
Subgroup excluding FGFR1-amplified cases |
|||||||
pT stage |
T1-2 vs. T3-4 |
5.596 |
2.231-14.038 |
<0.001 |
4.550 |
1.779-11.639 |
0.002 |
pN stage |
N0 vs. N1-3 |
3.987 |
1.496-10.624 |
0.006 |
3.334 |
1.227-9.059 |
0.018 |
LVI |
Absent vs. Present |
3.143 |
1.313-7.526 |
0.010 |
1.687 |
0.647-4.401 |
0.285 |
Histologic grade |
I & II vs. III |
1.368 |
0.624-2.998 |
0.434 |
- |
- |
- |
Ki-67 index |
<20% vs. ≥20% |
1.716 |
0.779-3.781 |
0.180 |
- |
- |
- |
Hormone receptor |
Positive vs. Negative |
1.226 |
0.529-2.842 |
0.634 |
- |
- |
- |
HER2 amplification |
Negative vs. Positive |
2.345 |
0.979-5.621 |
0.056 |
2.194 |
0.907-5.311 |
0.081 |
Shannon index (FGFR1) |
Low vs. High |
2.312 |
1.050-5.094 |
0.038 |
2.430 |
1.102-5.360 |
0.028 |
Hormone receptor-positive subgroup |
|||||||
pT stage |
T1-2 vs. T3-4 |
3.083 |
0.915-10.391 |
0.069 |
1.609 |
0.460-5.622 |
0.457 |
pN stage |
N0 vs. N1-3 |
4.211 |
1.432-12.381 |
0.009 |
4.223 |
1.436-12.423 |
0.009 |
LVI |
Absent vs. Present |
2.410 |
0.991-5.860 |
0.052 |
1.261 |
0.484-3.286 |
0.635 |
Histologic grade |
I & II vs. III |
1.307 |
0.554-3.084 |
0.541 |
- |
- |
- |
Ki-67index |
<20% vs. ≥20% |
2.091 |
0.916-4.770 |
0.080 |
1.954 |
0.856-4.460 |
0.112 |
HER2 amplification |
Negative vs. Positive |
1.727 |
0.587-5.079 |
0.321 |
- |
- |
- |
Shannon index (FGFR1) |
Low vs. High |
3.710 |
1.526-9.021 |
0.004 |
3.600 |
1.480-8.759 |
0.005 |
HR, hazard ratio; LVI, lymphovascular invasion; HER2, human epidermal growth factor receptor 2; CI, confidence interval
DISCUSSION
Understanding intratumoral heterogeneity (ITH) is critical for both cancer research and treatment, since it ultimately leads to tumor progression. Previous studies in breast cancer have investigated intratumoral genetic heterogeneity using somatic mutations, gene copy number alterations, mRNA expression, and microRNA expression [11, 13, 15, 16, 18, 21, 28-30]. While the vast majority of such studies confirmed the presence of ITH, only a few studies investigated its impact on response to treatment or patient prognosis. Of the factors affected by ITH in breast cancer, HER2 heterogeneity can be easily evaluated in breast cancer and can be matched with the response to HER2-targeted therapy, and thus has been the subject of many investigations including one by our group [31-33]. It is accepted that HER2 heterogeneity is associated with poor clinical outcome and therapeutic resistance to HER2-targeted agents such as trastuzumab. However, in general, measurement of intratumoral genetic heterogeneity is complicated, and thus, its application as a biomarker representing disease progression and therapeutic resistance has been limited. To our knowledge, this is the first study investigating the use of the index as an indicator of tumor progression in breast cancer.
We conducted this study using the c-MYC gene, one of the genes most frequently amplified across all cancer types [34], and we validated our results using a different set of tumor samples from another institution and another frequently-amplified gene, FGFR1. We found that a high Shannon index of c-MYC copy number variation was associated with poor disease-free survival in both the test and validation sets, and we obtained similar results after excluding cases in which c-MYC was amplified, so ruling out the effect of c-MYC amplification on the diversity index. Using FGFR1 in place of c-MYC for calculating the diversity index confirmed the generality of these results.
In the previous study that quantified the degree of ITH of breast cancer using the Shannon diversity index [19], the authors discovered that a high degree of genetic heterogeneity existed not only between distinct tumor cell populations but also between the tumor cells within the same population. While it was suggested that a larger tumor cell population size, and hypoxia, might increase intratumoral genetic diversity, the association between the Shannon index and the histopathologic features was not statistically significant due to the small sample size. In the present study, we were able to show that the histopathological features associated with aggressive tumor behaviors (high histologic grade, lymphovascular invasion, p53 overexpression, high Ki-67 index, and negative hormone receptor status) were significantly associated with a high diversity index for c-MYC copy number variation in both a test set and a validation set. As c-MYC dysregulation promotes chromosomal instability [35], the diversity index for c-MYC copy number variation may reflect the degree of chromosomal instability. Therefore, the association between high diversity index and aggressive features of breast cancer is in line with the results from a previous study by Endesfelder et al. who found that chromosomal instability in breast cancer was associated with high histologic grade and hormone receptor negativity [36]. The Shannon index based on FGFR1 copy number variation, on the other hand, was not associated with any of those clinicopathologic features, and a possible explanation is that the diversity index for copy number variation of a given gene represents the effects of both amplification of that gene and genetic heterogeneity for that gene. In this study, FGFR1 amplification was not associated with any clinicopathologic features of breast cancer, but it tended to show an association with p53 overexpression. Accordingly, the Shannon index for FGFR1 copy number variation was significantly associated with high histologic grade and p53 overexpression.
Recently, Almendro et al. evaluated ITH using the Shannon index in primary and metastatic breast cancer samples using seven different genes [21]. They found that the extent of intratumoral genetic diversity in a tumor was similar regardless of the chromosomal region analyzed, suggesting that it may be an inherent property of a tumor. We also observed that the Shannon diversity indices for c-MYC and FGFR1 copy number variation were correlated, again suggesting that the degree of ITH in a tumor is an intrinsic feature of that tumor. Almendro et al. investigated the genetic and phenotypic diversity of primary tumors, and matched lymph nodes and distant metastases, and found that the diversity was greatest among the distant metastases; we also plan to perform a study of tumor progression comparing primary and metastatic tumors to clarify the significance of the association between high diversity index and disease progression.
We observed that a high Shannon index using c-MYC copy number was an adverse prognostic factor in the hormone receptor-positive subgroup, but not in the hormone receptor-negative subgroup in both the test and validation sets. Similarly, a high Shannon index based on FGFR1 copy number variation was an independent poor prognostic factor only in the hormone receptor-positive subgroup. This result may be explained by the different extents of genomic instability in different subtypes of breast cancer. Kwei et al. divided the genetic alterations in breast cancer into three types: a “simple” type harboring only a few copy number alterations characteristic of the luminal A subtype, an “amplifier” type with focal high-level DNA amplification in the luminal B and HER2 subtypes, and, lastly, a “complex” type characteristic of the triple-negative subtype [37]. In our subgroup analysis, the hormone receptor-negative group included HER2-positive and triple-negative tumors; these subtypes usually show high levels of genomic instability and have high diversity indices, which may be the reason that the Shannon diversity index had no prognostic value in this subgroup. On the other hand, in the hormone receptor-positive group, a high diversity index may reflect the contribution of the luminal B subtype, which has a higher level of genomic instability than the luminal A subtype. However, we have observed that even when a survival analysis was restricted to the luminal A subtypes, a high diversity index had prognostic significance (data not shown).
There are some limitations to this study. First, although the treatment per se did not affect the survival of patients, this was a retrospective study and the patients were not treated uniformly. A large-scale prospective study in a uniformly-treated patient population may be needed to confirm the prognostic value of the diversity index. Second, we counted gene signals per cell by FISH using tissue section, which inevitably includes truncation artifacts that may lead to artificial heterogeneity. The diversity index measured in this study included some artificial heterogeneity, but this was true for all of the cases. Lastly, our analysis was confined to the c-MYC and FGFR1 genes. Although we showed that high diversity indices for c-MYC and FGFR1 gene copy number variation were associated with adverse clinical outcomes, it is not clear that this association is true for other genes. This warrants further study.
To conclude, we have shown that high Shannon indices of c-MYC and FGFR1 copy number variation are associated with adverse features of breast cancer. A high diversity index is also a significant prognostic factor for decreased patient survival. Thus it appears that the Shannon diversity index is a measure of ITH and a prognostic factor in breast cancer that can identify those at high risk of recurrence or progression, and it can be used in the clinical setting for deciding the optimal treatment.
MATERIALS AND METHODS
Patients and tissue samples
Our test set consisted of 283 invasive breast cancer samples that had been resected consecutively from 2003 to 2007 at Seoul National University Bundang Hospital. We validated our results using 369 cases of invasive breast cancer resected at Seoul National University Boramae Hospital between 1999 and 2012. Recurrent breast cancers, advanced breast cancers with distant metastasis at presentation, and cases with incomplete resection, were excluded. Clinicopathologic data were collected from electronic medical records and pathology reports. The following histopathologic variables were recorded: tumor size, T stage, N stage, histologic subtype (by WHO classification), histologic grade (by the Bloom and Richardson grading system), lymphovascular invasion, estrogen receptor (ER), progesterone receptor (PR) and HER2 status, Ki-67 proliferation index, and p53 overexpression. The baseline characteristics of the test set and validation set are listed in Supplementary Table 4. This study was approved by the Institutional Review Board (protocol # B-1601/332-304), and informed consent was waived.
Tissue microarray construction
All of the slides from surgically-resected specimens in the test set and the validation set were reviewed, and three representative regions were selected. In tumors that showed different histologic features, areas with different histologies were chosen. We constructed tissue microarrays (TMAs) of 2mm diameter from each of these regions, yielding three cores per case (SuperBioChips Laboratories, Seoul, South Korea) for immunohistochemistry and fluorescence in situ hybridization.
Fluorescence in situ hybridization assays for c-MYC and FGFR1
Fluorescence in situ hybridization (FISH) for c-MYC was performed with the following commercially available locus-specific probes and chromosome enumeration probes (CEPs): LSI c-MYC SpectrumOrange probe (8q24.12-q24.13) and CEP 8 SpectrumGreen probe (8p11.1-q11.1) (Abbott Molecular, Downers Grove, IL, USA). Fibroblast growth factor receptor 1 (FGFR1) FISH was performed with locus-specific BAC, RP11-100B16 (chr8:38,358,839-38,522,417) and CEP 8 SpectrumGreen probes (8p11.1-q11.1) (Abbott Molecular). We obtained the BAC clone from Invitrogen (Carlsbad, CA, USA) and purified it with a large construction kit (Qiagen, Valencia, CA, USA). DNA from the BAC clone was labeled with SpectrumOrange using a nick translation kit (Abbott Molecular).
Briefly, 4-μm deparaffinized TMA cores were incubated in pretreatment solution (Abbott Molecular) at 80°C for 30 min followed by protease solution (Abbott Molecular) for 20 min at 37°C. The probes were diluted in tDen-Hyb-2 hybridization buffer (InSitus Biotechnologies, Albuquerque, NM, USA). DNA denaturation of the probes and the tissue sections was achieved by incubating them in HYBriteTM (Abbott Molecular) for 5 min at 73°C followed by hybridization at 37°C for 16 hours. Post-hybridization washes were performed according to the manufacturer’s instructions. Slides were mounted in 4, 6-diamidino-2-phenylindole/anti-fade and viewed under a fluorescence microscope.
Gene signals per cell in 50 tumor nuclei were evaluated for each TMA core: 150 tumor cells were thus counted in each case. Average gene copy number was calculated separately for each TMA core and in combination. Gene amplification was considered to be present when the average gene copy number of the three TMA cores was 6.0 or higher, and copy number gain was defined as an average gene copy number of ≥3 in the three TMA cores. Cases that showed both amplification and non-amplification depending on the core were considered to have regional heterogeneity. Following the guidelines for defining HER2 genetic heterogeneity [38], cases in which the proportion of cells with amplification was between 5 and 50% were considered to be genetically heterogeneous. The presence of regional and genetic heterogeneity was assessed, and the degree of heterogeneity was evaluated using two diversity indices as described below.
Diversity indices
The Shannon index is a diversity index that quantifies the uncertainty in assigning the species identity of an individual in a population, and is a popular index in ecology. It is calculated as
H’ = -∑ pi ln(pi), where pi equals the frequency of species i in the population [39]. A species, in this study, represents those tumor cells with the same copy number of c-MYC or FGFR1. As pointed out in a previous study [19], one of the shortcomings of the Shannon index is a tendency to confound species richness and evenness, and therefore we calculated the Simpson index for comparison. The Simpson index (D=∑ piz) is another well-known ecological index; it has the advantage that it has a clear biological and probabilistic interpretation but it has the disadvantage that the most abundant species contribute disproportionately to the value obtained [19, 40, 41]. We computed the Simpson index along with Shannon index in our initial analysis.
Definition of breast cancer subtypes
Immunohistochemical expression of the standard biomarkers that had been evaluated in whole sections at the time of diagnosis (and during the study in cases with missing data) were used to categorize the tumor samples into breast cancer subtypes according to the 2011 St. Gallen Expert Consensus [42] as follows: luminal A (ER+ and/or PR+, HER2-, Ki-67<14%), luminal B (ER+ and/or PR+, HER2-, Ki-67≥14%; ER+ and/or PR+, HER2+), HER2+ (ER-, PR-, HER2+), and triple-negative subtype (ER-, PR-, HER2-). ER and PR expression was measured in 10% increments, and 1% or more stained nuclei were considered positive. For HER2, 3+ on immunohistochemistry or the presence of gene amplification in FISH was considered positive.
Statistical analysis
We analyzed our data using Statistical Package, SPSS version 22.0 for Windows (SPSS Inc, Chicago, IL, USA). Correlations between Shannon index, Simpson index, and c-MYC copy number were evaluated by Pearson’s correlation test. The median value of the Shannon index was used as a cutoff point for assigning tumors into the low or high Shannon index categories, and the associations between Shannon index and clinicopathologic features of the tumors were evaluated by the Chi-square test or Fisher’s exact test. Differences in Shannon index between multiple groups were analyzed by one-way analysis of variance (ANOVA) and the Turkey post hoc test. A receiver operating characteristic (ROC) curve analysis was performed to identify the cut-off values of the Shannon index that maximized the sum of sensitivity and specificity in predicting clinical outcomes. Disease-free survival was analyzed by drawing Kaplan-Meier curves, and differences were determined with the log-rank test. Multivariate analysis was performed with a Cox proportional hazard regression model using a backward stepwise selection method using the covariates significantly associated with patient outcome in the univariate analyses. Hazard ratios (HR) and their 95% confidence intervals (CI) were calculated for each variable. P-values < 0.05 were considered statistically significant. All p-values were two-sided.
CONFLICTS OF INTEREST
All authors declare no conflicts of interest.
GRANT SUPPORT
This study was funded by a grant from the National Research Foundation of Korea (NRF)’s Basic Science Research Program endowed by the Ministry of Science, ICT and Future Planning (Grant No. NRF-2015R1A2A2A01007907) to Park SY.
REFERENCES
1. Fidler IJ. Tumor heterogeneity and the biology of cancer invasion and metastasis. Cancer Res. 1978; 38: 2651-60.
2. Yap TA, Gerlinger M, Futreal PA, Pusztai L, Swanton C. Intratumor heterogeneity: seeing the wood for the trees. Sci Transl Med. 2012; 4: 127ps10.
3. Turner NC, Reis-Filho JS. Genetic heterogeneity and cancer drug resistance. Lancet Oncol. 2012; 13: e178-85.
4. Mazor T, Pankov A, Song JS, Costello JF. Intratumoral Heterogeneity of the Epigenome. Cancer Cell. 2016; 29: 440-51.
5. Almendro V, Marusyk A, Polyak K. Cellular heterogeneity and molecular evolution in cancer. Annu Rev Pathol. 2013; 8: 277-302.
6. Almendro V, Cheng YK, Randles A, Itzkovitz S, Marusyk A, Ametller E, Gonzalez-Farre X, Munoz M, Russnes HG, Helland A, Rye IH, Borresen-Dale AL, Maruyama R, et al. Inference of tumor evolution during chemotherapy by computational modeling and in situ analysis of genetic and phenotypic cellular diversity. Cell Reports. 2014; 6: 514-27.
7. Polyak K, Haviv I, Campbell IG. Co-evolution of tumor cells and their microenvironment. Trends Genet. 2009; 25: 30-8.
8. Beca F, Polyak K. Intratumor Heterogeneity in Breast Cancer. Adv Exp Med Biol. 2016; 882: 169-89.
9. Campbell LL, Polyak K. Breast tumor heterogeneity: cancer stem cells or clonal evolution? Cell Cycle. 2007; 6: 2332-8.
10. Martelotto LG, Ng CK, Piscuoglio S, Weigelt B, Reis-Filho JS. Breast cancer intra-tumor heterogeneity. Breast Cancer Res. 2014; 16: 210.
11. Allred DC, Wu Y, Mao S, Nagtegaal ID, Lee S, Perou CM, Mohsin SK, O’Connell P, Tsimelzon A, Medina D. Ductal carcinoma in situ and the emergence of diversity during breast cancer evolution. Clin Cancer Res. 2008; 14: 370-8.
12. Gerlinger M, Rowan AJ, Horswell S, Math M, Larkin J, Endesfelder D, Gronroos E, Martinez P, Matthews N, Stewart A, Tarpey P, Varela I, Phillimore B, et al. Intratumor heterogeneity and branched evolution revealed by multiregion sequencing. N Engl J Med. 2012; 366: 883-92.
13. Janiszewska M, Liu L, Almendro V, Kuang Y, Paweletz C, Sakr RA, Weigelt B, Hanker AB, Chandarlapaty S, King TA, Reis-Filho JS, Arteaga CL, Park SY, et al. In situ single-cell analysis identifies heterogeneity for PIK3CA mutation and HER2 amplification in HER2-positive breast cancer. Nat Genet. 2015; 47: 1212-9.
14. Maley CC, Galipeau PC, Finley JC, Wongsurawat VJ, Li X, Sanchez CA, Paulson TG, Blount PL, Risques RA, Rabinovitch PS, Reid BJ. Genetic clonal diversity predicts progression to esophageal adenocarcinoma. Nat Genet. 2006; 38: 468-73.
15. Morris LG, Riaz N, Desrichard A, Senbabaoglu Y, Hakimi AA, Makarov V, Reis-Filho JS, Chan TA. Pan-cancer analysis of intratumor heterogeneity as a prognostic determinant of survival. Oncotarget. 2016; 7: 10051-63. https://doi.org/10.18632/oncotarget.7067.
16. Navin N, Kendall J, Troge J, Andrews P, Rodgers L, McIndoo J, Cook K, Stepansky A, Levy D, Esposito D, Muthuswamy L, Krasnitz A, McCombie WR, et al. Tumour evolution inferred by single-cell sequencing. Nature. 2011; 472: 90-4.
17. Paulson TG, Maley CC, Li X, Li H, Sanchez CA, Chao DL, Odze RD, Vaughan TL, Blount PL, Reid BJ. Chromosomal instability and copy number alterations in Barrett’s esophagus and esophageal adenocarcinoma. Clin Cancer Res. 2009; 15: 3305-14.
18. Yates LR, Gerstung M, Knappskog S, Desmedt C, Gundem G, Van Loo P, Aas T, Alexandrov LB, Larsimont D, Davies H, Li Y, Ju YS, Ramakrishna M, et al. Subclonal diversification of primary breast cancer revealed by multiregion sequencing. Nat Med. 2015; 21: 751-9.
19. Park SY, Gonen M, Kim HJ, Michor F, Polyak K. Cellular and genetic diversity in the progression of in situ human breast carcinomas to an invasive phenotype. J Clin Invest. 2010; 120: 636-44.
20. Patel AP, Tirosh I, Trombetta JJ, Shalek AK, Gillespie SM, Wakimoto H, Cahill DP, Nahed BV, Curry WT, Martuza RL, Louis DN, Rozenblatt-Rosen O, Suva ML, et al. Single-cell RNA-seq highlights intratumoral heterogeneity in primary glioblastoma. Science. 2014; 344: 1396-401.
21. Almendro V, Kim HJ, Cheng YK, Gonen M, Itzkovitz S, Argani P, van Oudenaarden A, Sukumar S, Michor F, Polyak K. Genetic and phenotypic diversity in breast tumor metastases. Cancer Res. 2014; 74: 1338-48.
22. Deming SL, Nass SJ, Dickson RB, Trock BJ. C-myc amplification in breast cancer: a meta-analysis of its occurrence and prognostic relevance. Br J Cancer. 2000; 83: 1688-95.
23. Adelaide J, Finetti P, Bekhouche I, Repellini L, Geneix J, Sircoulomb F, Charafe-Jauffret E, Cervera N, Desplans J, Parzy D, Schoenmakers E, Viens P, Jacquemier J, et al. Integrated profiling of basal and luminal breast cancers. Cancer Res. 2007; 67: 11565-75.
24. Huppi K, Pitt JJ, Wahlberg BM, Caplen NJ. The 8q24 gene desert: an oasis of non-coding transcriptional activity. Front Genet. 2012; 3: 69.
25. Elsheikh SE, Green A, Lambros MB, Powe D, Ellis IO, Reis JS. FGFR1 amplification in breast carcinomas: A chromogenic in situ hybridisation analysis. Modern Pathology. 2007; 20: 30a-a.
26. Turner N, Pearson A, Sharpe R, Lambros M, Geyer F, Lopez-Garcia MA, Natrajan R, Marchio C, Iorns E, Mackay A, Gillett C, Grigoriadis A, Tutt A, et al. FGFR1 amplification drives endocrine therapy resistance and is a therapeutic target in breast cancer. Cancer Res. 2010; 70: 2085-94.
27. Jang M, Kim E, Choi Y, Lee H, Kim Y, Kim J, Kang E, Kim SW, Kim I, Park S. FGFR1 is amplified during the progression of in situ to invasive breast carcinoma. Breast Cancer Res. 2012; 14: R115.
28. Pan A, Zhou Y, Mu K, Liu Y, Sun F, Li P, Li L. Detection of gene copy number alterations in DCIS and invasive breast cancer by QM-FISH. Am J Transl Res. 2016; 8: 4994-5004.
29. Raychaudhuri M, Schuster T, Buchner T, Malinowsky K, Bronger H, Schwarz-Boeger U, Hofler H, Avril S. Intratumoral heterogeneity of microRNA expression in breast cancer. J Mol Diagn. 2012; 14: 376-84.
30. Miron A, Varadi M, Carrasco D, Li H, Luongo L, Kim HJ, Park SY, Cho EY, Lewis G, Kehoe S, Iglehart JD, Dillon D, Allred DC, et al. PIK3CA mutations in in situ and invasive breast carcinomas. Cancer Res. 2010; 70: 5674-8.
31. Seol H, Lee HJ, Choi Y, Lee HE, Kim YJ, Kim JH, Kang E, Kim SW, Park SY. Intratumoral heterogeneity of HER2 gene amplification in breast cancer: its clinicopathological significance. Mod Pathol. 2012; 25: 938-48.
32. Lee HJ, Seo AN, Kim EJ, Jang MH, Suh KJ, Ryu HS, Kim YJ, Kim JH, Im SA, Gong G, Jung KH, Park IA, Park SY. HER2 heterogeneity affects trastuzumab responses and survival in patients with HER2-positive metastatic breast cancer. Am J Clin Pathol. 2014; 142: 755-66.
33. Lee HJ, Kim JY, Park SY, Park IA, Song IH, Yu JH, Ahn JH, Gong G. Clinicopathologic significance of the intratumoral heterogeneity of HER2 gene amplification in HER2-positive breast cancer patients treated with adjuvant trastuzumab. Am J Clin Pathol. 2015; 144: 570-8.
34. Beroukhim R, Mermel CH, Porter D, Wei G, Raychaudhuri S, Donovan J, Barretina J, Boehm JS, Dobson J, Urashima M, Mc Henry KT, Pinchback RM, Ligon AH, et al. The landscape of somatic copy-number alteration across human cancers. Nature. 2010; 463: 899-905.
35. Kuzyk A, Mai S. c-MYC-induced genomic instability. Cold Spring Harb Perspect Med. 2014; 4: a014373.
36. Endesfelder D, McGranahan N, Birkbak NJ, Szallasi Z, Kschischo M, Graham TA, Swanton C. A breast cancer meta-analysis of two expression measures of chromosomal instability reveals a relationship with younger age at diagnosis and high risk histopathological variables. Oncotarget. 2011; 2: 529-37. https://doi.org/10.18632/oncotarget.298.
37. Kwei KA, Kung Y, Salari K, Holcomb IN, Pollack JR. Genomic instability in breast cancer: pathogenesis and clinical implications. Mol Oncol. 2010; 4: 255-66.
38. Vance GH, Barry TS, Bloom KJ, Fitzgibbons PL, Hicks DG, Jenkins RB, Persons DL, Tubbs RR, Hammond ME, and College of American Pathologists. Genetic heterogeneity in HER2 testing in breast cancer: panel summary and guidelines. Arch Pathol Lab Med. 2009; 133:611-12.
39. Shannon CE. The mathematical theory of communication. 1963. MD Comput. 1997; 14:306-17.
40. Simpson EH. Measurement of diversity. Nature. 1949; 163: 688.
41. Potts SJ, Krueger JS, Landis ND, Eberhard DA, Young GD, Schmechel SC, Lange H. Evaluating tumor heterogeneity in immunohistochemistry-stained breast cancer tissue. Lab Invest. 2012; 92: 1342-57.
42. Goldhirsch A, Wood WC, Coates AS, Gelber RD, Thürlimann B, Senn HJ, and Panel members. Strategies for subtypes--dealing with the diversity of breast cancer: highlights of the St. Gallen International Expert Consensus on the Primary Therapy of Early Breast Cancer 2011. Ann Oncol. 2011; 22: 1736-47.