
INTRODUCTION
Colorectal carcinoma (CRC) is one of the most important causes of death worldwide [1]. According to recent reports, 376,300 new cases and 191,000 deaths occurred due to CRC, in China, 2015 [2]. Currently, the prognosis of colorectal cancer is controversial in stage II and III colorectal carcinoma [3]. Although the staging system is mature, some stage II colorectal adenocarcinoma patients have relatively poorer prognosis than stage III CRC patients. This indicates that clinical observations, including stage, could not distinguish the good or poor prognosis of colorectal carcinoma well in stage II/III CRC.
During the past years, numerous molecular biomarkers have been reported to be able to predict the survival of stage II and III colorectal carcinoma patients [4–8]. However, the single biomarker’s prognostic value is usually unfavorable across datasets. In order to elevate the performance on prognosis, multiple gene models for predicting survival of carcinomas have been developed [9–12]. The expression of genes, especially cancer-related genes, are regulated by critical signaling pathways and transcription factors [13–15], The transcription factor activity of core signaling pathways reflects the cell status and cancer heterogeneity.
In this article, we evaluated the activities of regulatory factors, and then developed a Cox multivariate model to predict the survival of stage II and III colorectal carcinoma patients from GSE39582 dataset. The risk score is significantly associated with overall and recurrence-free survival. The performance of risk score model in predicting survival of stage II and III colorectal adenocarcinoma was further validated in five independent datasets. Association analysis showed that the risk score was independent from clinical information including age, stage and gender. A nomogram was plotted to facilitate the utilization of risk score. In conclusion, transcription regulation activity based risk score successfully predict the survival of stage II and III colorectal carcinoma.
RESULTS
Candidate gene selection and model development
Detailed information of datasets used in this study were listed in Table 1. Regulators including transcription factors and core pathway genes were important for cancer development. However, the activity of these regulators could not be assessed by the mRNA level because some regulators took effect by protein modifications, thus, the regulatory activity of regulators was calculated based on the expression levels of target genes downstream. The survival significance of candidate regulators (based on their regulatory activity) was evaluated using cox univariate regression (p<0.05). Forty-four regulator activities were detected to be correlated with survival, then random forest was implemented for variable hunting. Totally, ten regulators’ activities (EPAS1, TP73, TEAD1, DBP, NME2, GFI1, NR5A1, ELK1, NANOG and ETS2) were selected as candidate features (regulators). Cox multivariate analysis was performed with above candidate regulators, and the coefficients of each regulator were assigned as its weighting, respectively (Table 2). The hazard ratios <1 suggested that their corresponding regulators were tumor suppressor genes, while genes with hazard ratios >1 were cancerous genes.
Table 1: Sample size and survival information of datasets used in this article
Datasets |
Sampls |
Survival info provided |
|---|---|---|
GSE143 |
162 |
Disease-free survival |
GSE176 |
115 |
Overall survival |
GSE177 |
55 |
Overall survival |
GSE333 |
90 |
Progression-free survival |
GSE272 |
130 |
Metastasis-fee survival |
GSE396 |
469 |
Overall survival |
Table 2: Basic parameters of regulatory factors used for risk score
TFs |
Genes downstream |
Coefficiens |
Frequeny |
Hzazad ratio |
CI 95% |
p Value |
|---|---|---|---|---|---|---|
DBP |
1 |
1.4199301 |
25 |
1.39 |
1.04-1.85 |
0.026 |
ELK1 |
3 |
0.1978697 |
28 |
1.77 |
1.21-2.59 |
0.0036 |
EPAS1 |
3 |
0.219671 |
24 |
1.59 |
1.09-2.31 |
0.015 |
ETS2 |
2 |
0.3803902 |
34 |
1.93 |
1.16-3.22 |
0.011 |
GFI1 |
5 |
-0.237219 |
26 |
0.523 |
0.331-0.829 |
0.0057 |
NANOG |
2 |
-3.168149 |
33 |
0.642 |
0.415-0.993 |
0.046 |
NME2 |
5 |
-0.130288 |
26 |
0.736 |
0.607-0.893 |
0.0018 |
NR5A1 |
2 |
0.0413388 |
28 |
3.83 |
1.09-13.5 |
0.037 |
TEAD1 |
1 |
0.5805332 |
25 |
1.22 |
1.1-1.35 |
0.000091 |
TP73 |
383 |
-0.166284 |
25 |
34.9 |
1.33-920 |
0.032 |
The columns are number of genes used for regulatory factor evaluation, Cox univariate regression p value, Cox multivariate regression beta values, and frequencies of regulatory factors of random forest variable hunting.
Risk score predicts survival in the training dataset
After developing risk score staging model in the training dataset, the survival-predicting value of risk score was evaluated. The patients were subtyped into high risk (n = 235) and low risk (n = 234) group by using the median risk score value as cutoff. The overall survival (OS) of high-risk group was significantly shorter than the low-risk group (Figure 1A, p=0.00059). In addition, the recurrence-free survival (RFS) profile of high-risk group resembled that of its overall survival (Figure 1B, p<0.05). Detailed survival information and risk scores were shown in Figure 1C. The regulatory activity pattern of the candidate genes was consistent with their coefficients. The risk score performs better in predicting the three-year survival of stage II and III CRC patients compared with clinicopathological indicators (Figure 2D). Area under receiving operating characteristic curve (AUROC) for three-year survival was plotted, showing a result of 0.66 for risk score and 0.66, 0.53, 0.53 for age, gender, chemotherapy, respectively. This indicated that the risk score was an important survival indicator for stage II and III colorectal carcinoma.
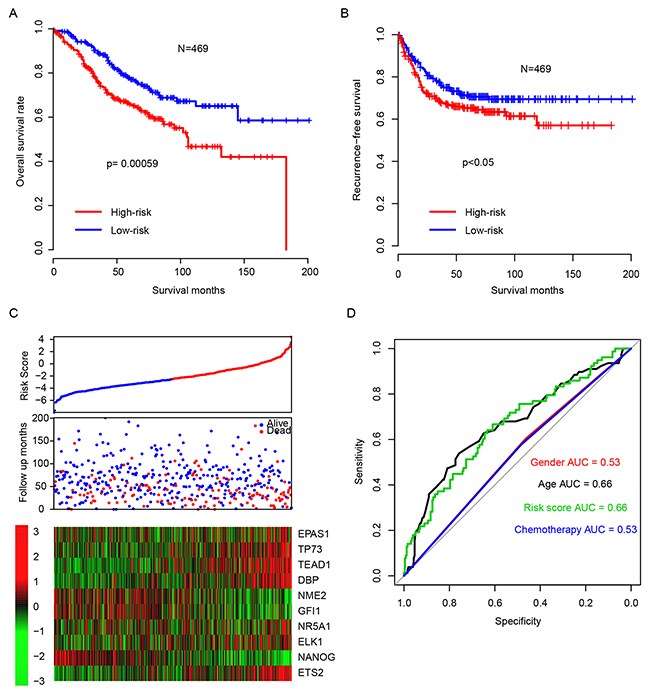
Figure 1: Performance of regulatory factor activity based risk score. The high-risk group has a significant longer overall survival (A) and recurrence-free survival (B) time than low-risk group. The detailed survival information and regulatory factor activity (C) and three-year survival ROC (D) was shown.
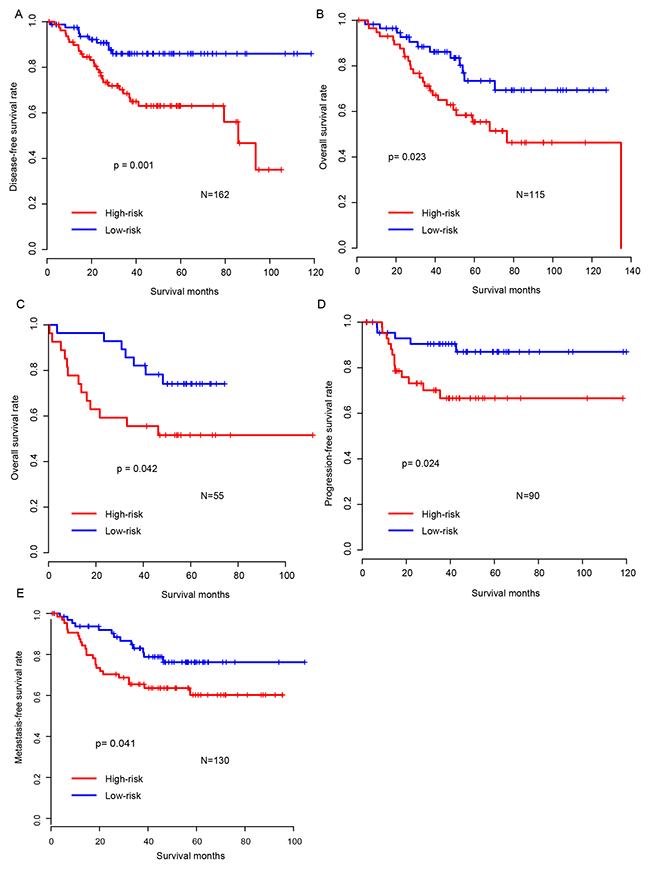
Figure 2: Validation of survival-predicting performance of risk score. The performance of risk score was further validated in five independent datasets (A: GSE14333, B: GSE17536, C: GSE17537, D: GSE33113, E: GSE37892).
Risk score model is robust across the test datasets
The high performance of risk score model in the training dataset may result from over-fitting. To assess its robustness, we carried out risk score performance evaluation on five independent public CRC cohorts, after locking the coefficients of the model. It was shown that the survival time of patients in the high-risk group was significantly shorter than in that the low-risk group, which was in consistent with the survival profile of training datasets (Figure 2A-E). In addition, the regulatory activity of candidate genes in the test datasets also resembled that in training datasets (Supplementary Figure 1A-E). These results above indicate that our risk score model was robust across datasets.
Risk score and clinical/pathological indicators
The relationship between the risk score we developed and clinical/pathological information was measured as well (Figure 3A). It was found to be independent from gender, age and stage (p>0.05). Multiple cox hazard ratio analysis results showed that risk score was an important indicator for predicting survival (Figure 3B). In order to facilitate the utilization of risk score model, a nomogram including gender, age, stage, risk score and chemotherapy was plotted (Figure 3C). The Cox univariate and multivariate regression of risk score and more detailed information indicated that risk score was the most important indicator for prognosis, as shown in Table 3. These results indicated that risk score was an independent and critical indicator for prognosis.
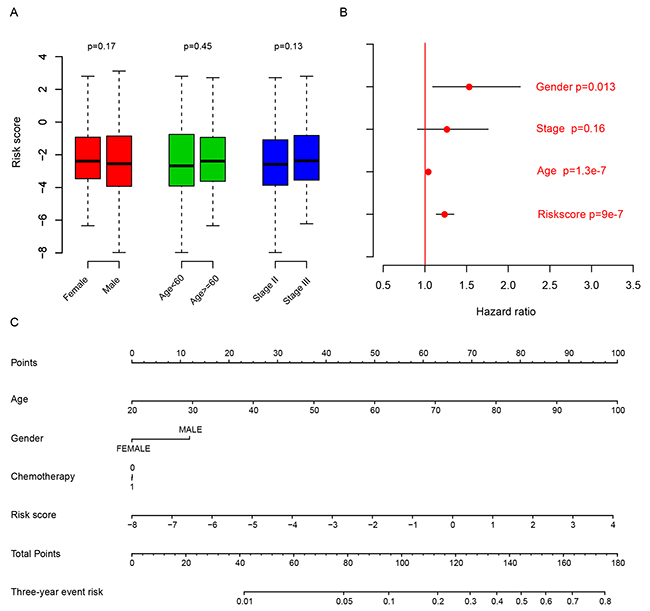
Figure 3: Risk score and another clinical indicator. The risk score is independent from age, gender, and stage (A), and is an important clinical indicator for survival according to multivariate hazard analysis (B) and nomogram (C).
Table 3: Cox univariate and multivariate regression of clinical indicators in GSE39582
Gene |
Univariate regression |
Multivariate regression |
||||
|---|---|---|---|---|---|---|
HR |
95%CI |
p Value |
HR |
95%CI |
p Value |
|
Riskscore |
1.2 |
1.1-1.3 |
0 |
1.15 |
1.04-1.27 |
0.00692 |
SexM |
1.3 |
0.91-1.8 |
0.16885 |
1.35 |
0.91-2 |
0.13668 |
Stage |
1.2 |
0.89-1.7 |
0.20707 |
1.17 |
0.79-1.73 |
0.44657 |
Location |
1.1 |
0.81-1.6 |
0.472 |
1.04 |
0.67-1.6 |
0.86886 |
CIMP |
0.93 |
0.57-1.5 |
0.76494 |
0.73 |
0.34-1.55 |
0.41108 |
CIN |
0.99 |
0.62-1.6 |
0.9745 |
0.93 |
0.54-1.58 |
0.78014 |
KRASmut |
1.4 |
1-2 |
0.03751 |
1.47 |
0.97-2.24 |
0.07001 |
BRAFmut |
0.89 |
0.46-1.7 |
0.71906 |
1.35 |
0.52-3.5 |
0.53881 |
CDX2 |
0.83 |
0.7-0.98 |
0.02838 |
0.92 |
0.7-1.19 |
0.50933 |
Risk score and chemotherapy
Chemotherapy is the one of most important adjuvant treatment strategies following surgery. Thus, the correlation between risk score and chemotherapy was evaluated. We used overall survival and recurrence-free survival information to estimate the availability of our risk score model for predicting the survival of patients with chemotherapy. As expected, the chemotherapy received patients with high risk score had a worse prognosis both on overall survival (Figure 4A) and recurrence-free survival (Figure 4B), compared to the low risk group. The prognostic value of risk score was also evaluated in patients without chemotherapy, and it was similar with chemotherapy-receiving group (Not shown). These results indicated that the regulatory activity based risk score was also available for the prognosis of CRC patients with chemotherapy.
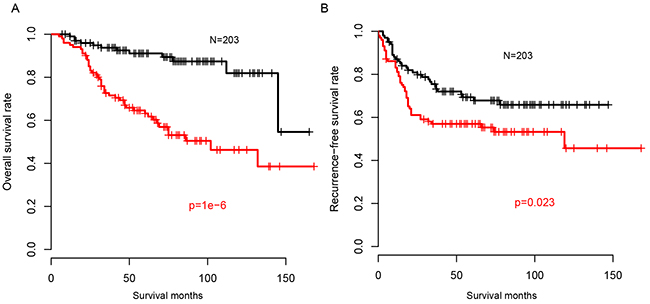
Figure 4: Risk score and chemotherapy. Overall survival (A) and recurrence-free survival (B) of patients underwent chemotherapy in high risk group is longer than in low risk group.
Identification of biological pathways associated with risk score
In order to investigate why the risk score can predict the survival of colorectal carcinoma, the comparison of gene expression profile between high-risk and low-risk group was performed, according to the median value of risk score in the largest cohort, GSE39582. The altered KEGG pathways was evaluated using Gene Set Enrichment Analysis (Figure 5A). The results showed that the most altered and enriched KEGG pathways were “complements and coagulation cascades” (Figure 5B), “ECM receptor interaction” (Figure 5C), “cell adhesion molecular” (Figure 5D), and “Cytokine-cytokine receptor interaction” (Figure 5E). These results indicated a possible molecular mechanism of the clinical outcome in stage II and III colorectal adenocarcinoma reflected by risk model.
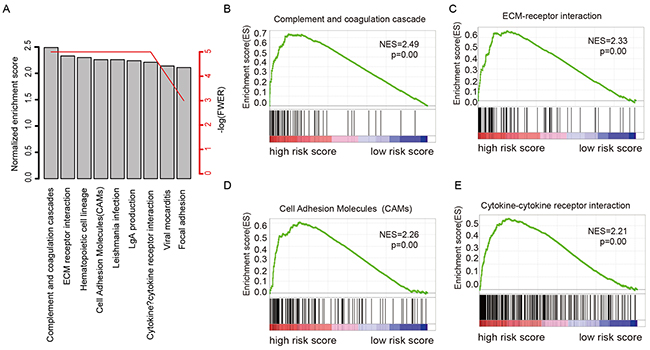
Figure 5: KEGG pathways associated with risk score. Of the KEGG pathways significantly associated with risks score (A), complements and coagulation cascades (B), ECM receptor interaction (C), cell adhesion molecular cams (D), and “cytokine-cytokine receptor interaction” were noted.
Publication bias evaluation
Publication bias inspection regarding basic clinical information, including age, gender, and events (relapse, metastasis, death) was performed. Funnel plots indicated that no publication bias for gender, age, or events was detected (Figure 6A, p>0.05). The forest plot showed that no data heterogeneity exists (Figure 6B). Publication bias was not investigated when the number of studies was less than 10 because of the low sensitivity of the qualitative and quantitative tests [16].
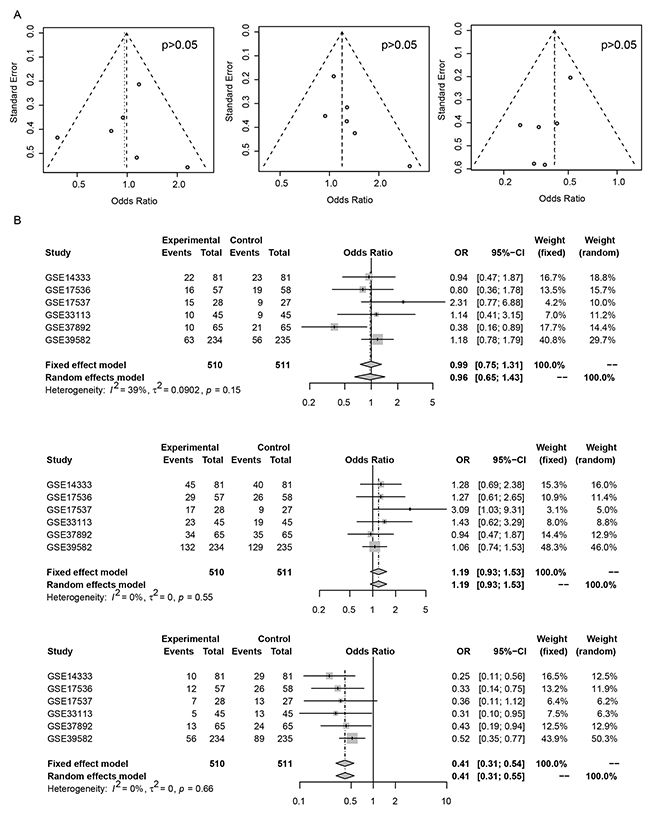
Figure 6: Publication bias of risk score and clinical indicator. Funnel plot of age (A, left), gender (A, middle), and events (A, right) has no bias. Forest plot suggests the similar results (B, top-down, age, gender, events).
DISCUSSION
Prognosis of stage II and III colorectal carcinoma still remains a problem. Although single biomarker has been reported for survival prediction [8, 17, 18], the robustness of these biomarkers still remains a huge concern. One of the reasons may be that single biomarker fails to reflect the genomic heterogeneity of tumors. Regulatory factors control the expression of genes downstream, and further determine the status of crucial pathways. Activity of multiple core regulatory and transcription factors may reflect the genomic status of cancer cells. In this vein, we evaluated the activities of transcription and regulatory factors by considering the expression of target genes downstream of stage II and III colorectal carcinoma. Using cox univariate regression and random forest variable hunting, activities of ten regulatory factors were identified to develop a risk score model for prognosis. The model successfully predicted survival of 1021 stage II and III colorectal carcinoma patients in six independent datasets. It is also independent from other clinical indicators and performs exceedingly in survival-predicting.
We noticed that the most of the 42 regulators are important for prognosis, the combination of the ten regulators effectively reduced the panel and retained the useful information. Among the ten transcription regulators, we noted that the overexpression of EPAS1 was associated with poor prognosis in colorectal carcinoma, according to previous reports [19–21]. Polymorphism and expression of TP73 were associated with carcinogenesis and colorectal carcinoma development [22, 23]. TEAD1 was reported to enhance the proliferation in colorectal carcinoma [24]. DBP and NME2 were associated with carcinogenesis and development of cancer types, including colorectal carcinoma [25–28]. It was similar for GFI1 [29–31], NR5A1 [32], and ELK1 [33–35]. NANOG was related to multiple colorectal tumor development functions, including liver metastasis [36], stemness maintaining [37] and prognosis [38]. ETS2 was shown to be associated with metastasis of colorectal carcinoma [39, 40]. These reports indicated that the regulatory factors included in the risk score model were essential prognostic genes, implying the reliability of this model.
The metastasis of CRC is among the most serious events during colorectal carcinoma development [41]. Among pathways and genes involved in CRC metastasis, cell-cell focal adhesion plays important roles [42, 43]. According to GSEA analysis, the most pathways involved in cell-cell interaction and focal adhesion were significantly enriched, which may explain why risk score is associated with stage II/III CRC prognosis.
In conclusion, our transcription activity based risk score model successfully predicts the survival of stage II and III colorectal carcinoma. To our knowledge, this is the first model using activities regulatory factors to predict survival of stage II/III colorectal carcinoma.
MATERIALS AND METHODS
Data preprocessing
The raw data of six datasets (GSE39582, GSE14333, GSE17536, GSE17537, GSE33113 and GSE37892) was downloaded in. CEL format. After background correction and normalization, the fold change between expression value of each sample and median expression value for each gene was calculated. Probes were matched to the gene names, and genes matching more than one probe were merged and average values were calculated as the expression of the corresponding genes. Duplicated values were excluded. The regulatory factor-downstream pairs were constructed according to the regulatory data provided by HTRI database [44]. Suppose the downstream genes of regulator k (Rk) are Gene1,2,3…j, and the dataset consist of samples 1,2,3…i.
Sample 1 sample 2 sample 3 … sample i
Gene 1 … … … … … …
Gene 2 … … … … … …
Gene 3 … … … … … …
… … … … … … …
Gene j … … … … … …
The regulator factor activity (RFA) of regulator k is calculated as the following,
Where Genej,i indicates the gene expression value of Genej in sample i, and median (Genej) refers to the median expression values of Genej, refers to the regulatory factor activity of regulator k in sample i. Construct a new matrix containing activity of regulators, in which the rows represent the regulators and the columns indicate the samples. All datasets included in this article was transformed using the same method.
Gene selection and model construction
Cox univariate regression was performed on GSE39582 dataset. Transcription factors that significantly associated with overall survival in this dataset were retained. Random forest variable hunting was performed with 100 replications and 100 steps. Multivariate Cox regression was implemented to construct the risk score model with the candidate genes, and coefficients were locked in the five test datasets. The risk scores (RS) of each sample were calculated as the following,
Where indicates the regulatory factor activity of regulator k in sample i, and βi refers to the coefficients for candidate regulators. Coefficients was evaluated using the training dataset, GSE39582, and locked to calculate the risk score in the other five datasets (GSE14333, GSE17536, GSE17537, GSE33113 and GSE37892). The median risk score values in each dataset were used as cutoff to identify the high-risk and low-risk group.
Statistical analyses
All statistical analysis was performed on R language and R packages. Microarray data pre-process was performed with R package “affy”. Survival analysis, Cox univariate regression and Cox multivariate regression were carried out with R package “survival”[45], and random forest variable hunting was implemented with R package “randomForestSRC”[46]. Survival ROC curve was plotted with R package “pROC”[47], and nomogram was drawn with R package “rms”[48]. Publication bias analysis was performed on R package “meta”. Gene Set Enrichment Analysis was carried out on java software “GSEA”[49].
Author contributions
Write manuscript: GL, CD, XW, YZ, HX; Experimental design: GL, LL, CD, XZ, GH; Data analysis: GL, CD, XW;
CONFLICTS OF INTEREST
None
FUNDING
Knowledge Database for Precision Medicine of Disease 2016YFC0901900 to Lei Liu and Omics Data QC and Clinical Implementation Normalization 2015AA020104 to Lei Liu.
REFERENCES
1. Torre LA, Bray F, Siegel RL, Ferlay J, Lortet-Tieulent J, Jemal A. Global cancer statistics, 2012. CA Cancer J Clin. 2015; 65:87-108.
2. Chen W, Zheng R, Baade PD, Zhang S, Zeng H, Bray F, Jemal A, Yu XQ, He J. Cancer statistics in China, 2015. CA Cancer J Clin. 2016; 66:115-132.
3. Sanz-Pamplona R, Berenguer A, Cordero D, Riccadonna S, Sole X, Crous-Bou M, Guino E, Sanjuan X, Biondo S, Soriano A, Jurman G, Capella G, Furlanello C, Moreno V. Clinical value of prognosis gene expression signatures in colorectal cancer: a systematic review. PLoS One. 2012; 7:e48877.
4. Li J, Liu Y, Wang C, Deng T, Liang H, Wang Y, Huang D, Fan Q, Wang X, Ning T, Liu R, Zhang CY, Zen K, et al. Serum miRNA expression profile as a prognostic biomarker of stage II/III colorectal adenocarcinoma. Sci Rep. 2015; 5:12921.
5. Masuda T, Ishikawa T, Mogushi K, Okazaki S, Ishiguro M, Iida S, Mizushima H, Tanaka H, Uetake H, Sugihara K. Overexpression of the S100A2 protein as a prognostic marker for patients with stage II and III colorectal cancer. Int J Oncol. 2016; 48:975-982.
6. Zheng HT, Shi DB, Wang YW, Li XX, Xu Y, Tripathi P, Gu WL, Cai GX, Cai SJ. High expression of lncRNA MALAT1 suggests a biomarker of poor prognosis in colorectal cancer. Int J Clin Exp Pathol. 2014; 7:3174-3181.
7. Wu T, Li Y, Liu X, Lu J, He X, Wang Q, Li J, Du X. Identification of high-risk stage II and stage III colorectal cancer by analysis of MMP-21 expression. J Surg Oncol. 2011; 104:787-791.
8. Perez-Carbonell L, Sinicrope FA, Alberts SR, Oberg AL, Balaguer F, Castells A, Boland CR, Goel A. MiR-320e is a novel prognostic biomarker in colorectal cancer. Br J Cancer. 2015; 113:83-90.
9. Kim SK, Kim SY, Kim JH, Roh SA, Cho DH, Kim YS, Kim JC. A nineteen gene-based risk score classifier predicts prognosis of colorectal cancer patients. Mol Oncol. 2014; 8:1653-1666.
10. Chang W, Gao X, Han Y, Du Y, Liu Q, Wang L, Tan X, Zhang Q, Liu Y, Zhu Y, Yu Y, Fan X, Zhang H, et al. Gene expression profiling-derived immunohistochemistry signature with high prognostic value in colorectal carcinoma. Gut. 2014; 63:1457-1467.
11. Ito H, Mo Q, Qin LX, Viale A, Maithel SK, Maker AV, Shia J, Kingham P, Allen P, DeMatteo RP, Fong Y, Jarnagin WR, D’Angelica M. Gene expression profiles accurately predict outcome following liver resection in patients with metastatic colorectal cancer. PLoS One. 2013; 8:e81680.
12. Salazar R, Roepman P, Capella G, Moreno V, Simon I, Dreezen C, Lopez-Doriga A, Santos C, Marijnen C, Westerga J, Bruin S, Kerr D, Kuppen P, et al. Gene expression signature to improve prognosis prediction of stage II and III colorectal cancer. J Clin Oncol. 2011; 29:17-24.
13. Olsen J, Espersen ML, Jess P, Kirkeby LT, Troelsen JT. The clinical perspectives of CDX2 expression in colorectal cancer: a qualitative systematic review. Surg Oncol. 2014; 23:167-176.
14. Nguyen AV, Wu YY, Lin EY. STAT3 and sphingosine-1-phosphate in inflammation-associated colorectal cancer. World J Gastroenterol. 2014; 20:10279-10287.
15. Wierzbicki PM, Rybarczyk A. The Hippo pathway in colorectal cancer. Folia Histochem Cytobiol. 2015; 53:105-119.
16. Ioannidis JP, Trikalinos TA. The appropriateness of asymmetry tests for publication bias in meta-analyses: a large survey. CMAJ. 2007; 176:1091-1096.
17. Tian X, Xu G. Clinical value of lncRNA MALAT1 as a prognostic marker in human cancer: systematic review and meta-analysis. BMJ Open. 2015; 5:e008653.
18. Chen Z, He A, Wang D, Liu Y, Huang W. Long noncoding RNA HOTTIP as a novel predictor of lymph node metastasis and survival in human cancer: a systematic review and meta-analysis. Oncotarget. 2017; 8:14126-14132. https://doi.org/10.18632/oncotarget.12981.
19. Rawluszko-Wieczorek AA, Horbacka K, Krokowicz P, Misztal M, Jagodzinski PP. Prognostic potential of DNA methylation and transcript levels of HIF1A and EPAS1 in colorectal cancer. Mol Cancer Res. 2014; 12:1112-1127.
20. Mohammed N, Rodriguez M, Garcia V, Garcia JM, Dominguez G, Pena C, Herrera M, Gomez I, Diaz R, Soldevilla B, Herrera A, Silva J, Bonilla F. EPAS1 mRNA in plasma from colorectal cancer patients is associated with poor outcome in advanced stages. Oncol Lett. 2011; 2:719-724.
21. Baba Y, Nosho K, Shima K, Irahara N, Chan AT, Meyerhardt JA, Chung DC, Giovannucci EL, Fuchs CS, Ogino S. HIF1A overexpression is associated with poor prognosis in a cohort of 731 colorectal cancers. Am J Pathol. 2010; 176:2292-2301.
22. Toumi AA, El Hadj Oel A, Ben Mahmoud LK, Ben Hmida Ael M, Chaar I, Gharbi L, Mzabi S, Bouraoui S. The prognostic value of p73 overexpression in colorectal carcinoma: a clinicopathologic, immunohistochemical, and statistical study of 204 patients. Appl Immunohistochem Mol Morphol. 2010; 18:128-136.
23. Yu XJ, Fang F, Xie J. Relationship between TP73 polymorphism (G4C14-A4T14) and cancer risk: a meta-analysis based on literatures. Gene. 2011; 484:42-46.
24. Yu MH, Zhang W. TEAD1 enhances proliferation via activating SP1 in colorectal cancer. Biomed Pharmacother. 2016; 83:496-501.
25. Anic GM, Weinstein SJ, Mondul AM, Mannisto S, Albanes D. Serum vitamin D, vitamin D binding protein, and risk of colorectal cancer. PLoS One. 2014; 9:e102966.
26. Liu YF, Yang A, Liu W, Wang C, Wang M, Zhang L, Wang D, Dong JF, Li M. NME2 reduces proliferation, migration and invasion of gastric cancer cells to limit metastasis. PLoS One. 2015; 10:e0115968.
27. Altman JK, Platanias LC. NME1 and NME2 as markers for myeloid leukemias. Leuk Lymphoma. 2012; 53:1441-1442.
28. Chang YW, Chiu CF, Lee KY, Hong CC, Wang YY, Cheng CC, Jan YH, Huang MS, Hsiao M, Ma JT, Su JL. CARMA3 represses metastasis suppressor NME2 to promote lung cancer stemness and metastasis. Am J Respir Crit Care Med. 2015; 192:64-75.
29. Khandanpour C, Moroy T. Growth factor independence 1 (Gfi1) as a regulator of p53 activity and a new therapeutical target for ALL. Oncotarget. 2013; 4:374-375. https://doi.org/10.18632/oncotarget.933.
30. Hones JM, Botezatu L, Helness A, Vadnais C, Vassen L, Robert F, Hergenhan SM, Thivakaran A, Schutte J, Al-Matary YS, Lams RF, Fraszscak J, Makishima H, et al. GFI1 as a novel prognostic and therapeutic factor for AML/MDS. Leukemia. 2016; 30:1237-1245.
31. Northcott PA, Lee C, Zichner T, Stutz AM, Erkek S, Kawauchi D, Shih DJ, Hovestadt V, Zapatka M, Sturm D, Jones DT, Kool M, Remke M, et al. Enhancer hijacking activates GFI1 family oncogenes in medulloblastoma. Nature. 2014; 511:428-434.
32. Miller S, Bhasin N, Urrego H, Moroz K, Rowan BG, Ramayya MS, Makridakis NM. Genetic and epigenetic alterations of steroidogenic factor1 in ovarian tumors. Int J Oncol. 2013; 42:627-634.
33. Kawahara T, Shareef HK, Aljarah AK, Ide H, Li Y, Kashiwagi E, Netto GJ, Zheng Y, Miyamoto H. ELK1 is up-regulated by androgen in bladder cancer cells and promotes tumor progression. Oncotarget. 2015; 6:29860-29876. https://doi.org/10.18632/oncotarget.5007.
34. Yan Q, Lou G, Qian Y, Qin B, Xu X, Wang Y, Liu Y, Dong X. SPAG9 is involved in hepatocarcinoma cell migration and invasion via modulation of ELK1 expression. Onco Targets Ther. 2016; 9:1067-1075.
35. Patki M, Chari V, Sivakumaran S, Gonit M, Trumbly R, Ratnam M. The ETS domain transcription factor ELK1 directs a critical component of growth signaling by the androgen receptor in prostate cancer cells. J Biol Chem. 2013; 288:11047-11065.
36. Xu F, Dai C, Zhang R, Zhao Y, Peng S, Jia C. Nanog: a potential biomarker for liver metastasis of colorectal cancer. Dig Dis Sci. 2012; 57:2340-2346.
37. Zhang J, Espinoza LA, Kinders RJ, Lawrence SM, Pfister TD, Zhou M, Veenstra TD, Thorgeirsson SS, Jessup JM. NANOG modulates stemness in human colorectal cancer. Oncogene. 2013; 32:4397-4405.
38. Meng HM, Zheng P, Wang XY, Liu C, Sui HM, Wu SJ, Zhou J, Ding YQ, Li J. Over-expression of Nanog predicts tumor progression and poor prognosis in colorectal cancer. Cancer Biol Ther. 2010; 9:295-302.
39. Mole DJ, O’Neill C, Hamilton P, Olabi B, Robinson V, Williams L, Diamond T, El-Tanani M, Campbell FC. Expression of osteopontin coregulators in primary colorectal cancer and associated liver metastases. Br J Cancer. 2011; 104:1007-1012.
40. Stange DE, Engel F, Longerich T, Koo BK, Koch M, Delhomme N, Aigner M, Toedt G, Schirmacher P, Lichter P, Weitz J, Radlwimmer B. Expression of an ASCL2 related stem cell signature and IGF2 in colorectal cancer liver metastases with 11p15.5 gain. Gut. 2010; 59:1236-1244.
41. Fakih MG. Metastatic colorectal cancer: current state and future directions. J Clin Oncol. 2015; 33:1809-1824.
42. Beauchemin N, Arabzadeh A. Carcinoembryonic antigen-related cell adhesion molecules (CEACAMs) in cancer progression and metastasis. Cancer Metastasis Rev. 2013; 32:643-671.
43. Buda A, Pignatelli M. E-cadherin and the cytoskeletal network in colorectal cancer development and metastasis. Cell Commun Adhes. 2011; 18:133-143.
44. Bovolenta LA, Acencio ML, Lemke N. HTRIdb: an open-access database for experimentally verified human transcriptional regulation interactions. BMC Genomics. 2012; 13:405.
45. Moreno-Betancur M, Sadaoui H, Piffaretti C, Rey G. Survival analysis with multiple causes of death: Extending the competing risks model. Epidemiology. 2017; 28:12-19.
46. Ishwaran H, Gerds TA, Kogalur UB, Moore RD, Gange SJ, Lau BM. Random survival forests for competing risks. Biostatistics. 2014; 15:757-773.
47. Robin X, Turck N, Hainard A, Tiberti N, Lisacek F, Sanchez JC, Muller M. pROC: an open-source package for R and S+ to analyze and compare ROC curves. BMC Bioinformatics. 2011; 12:77.
48. Miller ME, Hui SL, Tierney WM. Validation techniques for logistic regression models. Stat Med. 1991; 10:1213-1226.
49. Subramanian A, Tamayo P, Mootha VK, Mukherjee S, Ebert BL, Gillette MA, Paulovich A, Pomeroy SL, Golub TR, Lander ES, Mesirov JP. Gene set enrichment analysis: a knowledge-based approach for interpreting genome-wide expression profiles. Proc Natl Acad Sci U S A. 2005; 102:15545-15550.