Oncotarget

Research Papers:

miR-1 as a tumor suppressive microRNA targeting TAGLN2 in head and neck squamous cell carcinoma

PDF |  HTML  |  How to cite

Oncotarget. 2011; 2:29-42. https://doi.org/10.18632/oncotarget.213

Metrics: PDF 5173 views  |   HTML 5728 views  |   ?  

Nijiro Nohata, Yaeko Sone, Toyoyuki Hanazawa, Miki Fuse, Naoko Kikkawa, Hirofumi Yoshino, Takeshi Chiyomaru, Kazumori Kawakami, Hideki Enokida, Masayuki Nakagawa, Makio Shozu, Yoshitaka Okamoto and Naohiko Seki _

Abstract

Nijiro Nohata1,2,*, Yaeko Sone1,3,*, Toyoyuki Hanazawa2, Miki Fuse1, Naoko Kikkawa1,2, Hirofumi Yoshino4, Takeshi Chiyomaru4, Kazumori Kawakami4, Hideki Enokida4, Masayuki Nakagawa4, Makio Shozu3, Yoshitaka Okamoto2,and Naohiko Seki1

1Department of Functional Genomics, Chiba University Graduate School of Medicine, Chiba, Japan

2Department of Otorhinolaryngology/Head and Neck Surgery, Chiba University Graduate School of Medicine, Chiba, Japan

3Department of Gynecologic Oncology, Chiba University Graduate School of Medicine, Chiba, Japan

4Department of Urology, Graduate School of Medical and Dental Sciences, Kagoshima University, Kagoshima, Japan

*These authors contributed equally to this work.

Keywords: microRNA, miR-1, TAGLN2, tumor suppressor, HNSCC, microarray, oncogenes, oncotargets

Received: December 20, 2010; Accepted: January 23, 2011; Published: January 25, 2011;

Correspondence:

Nijiro Nohata, e-mail:

Abstract

Based on the microRNA (miRNA) expression signatures of hypopharyngeal and esophageal squamous cell carcinoma, we found that miR-1 was significantly down-regulated in cancer cells. In this study, we investigated the functional significance of miR-1 in head and neck squamous cell carcinoma (HNSCC) cells and identified miR-1-regulated novel cancer pathways. Gain-of-function studies using miR-1 revealed significant decreases in HNSCC cell proliferation, invasion, and migration. In addition, the promotion of cell apoptosis and cell cycle arrest was demonstrated following miR-1e transfection of cancer cells. A search for the targets of miR-1 revealed that transgelin 2 (TAGLN2) was directly regulated by miR-1. Silencing of TAGLN2 significantly inhibited cell proliferation and invasion in HNSCC cells. Down-regulation of miR-1 and up-regulation of TAGLN2 were confirmed in HNSCC clinical specimens. Our data indicate that TAGLN2 may have an oncogenic function and may be regulated by miR-1, a tumor suppressive miRNA in HNSCC. The identification of novel miR-1-regulated cancer pathways could provide new insights into potential molecular mechanisms of HNSCC carcinogenesis.


Introduction

Head and neck squamous cell carcinoma (HNSCC) constitutes the sixth most common malignancy worldwide [1]. In spite of considerable advances in multimodality therapy including surgery, radiotherapy, and chemotherapy, the overall five year survival rate for patients with this type of cancer is among the lowest of all major cancer types and has not improved during the last decade [2]. Local tumor recurrence and distant metastasis after conventional therapy appear to be major contributing factors for restricted survival of HNSCC patients. Therefore, understanding the molecular oncogenic pathways underlying HNSCC would help to improve diagnosis, approaches to therapy, and prevention of the disease.

MicroRNAs (miRNAs) are endogenous, short, non-coding RNA molecules which regulate gene expression by translational repression or degradation of mRNA in a sequence-specific manner [3]. Bioinformatic prediction indicates that miRNAs regulate more than 30% of the protein coding genes [4]. It is estimated that approximately 1,000 miRNAs exist in the vertebrate genome. At this time, 1,048 human miRNAs are registered at miRBase release 16.0 (http://microrna.sanger.ac.uk/). A growing body of evidence suggests that miRNAs are aberrantly expressed in many human cancers, and that they play significant roles in carcinogenesis and cancer progression [5]. miRNAs can be divided into two classes: those which are oncogenic miRNAs and those which are tumor suppressive miRNAs. Up-regulated miRNAs could act as oncogenes by negatively regulating tumor suppressor genes, while down-regulated miRNAs could function as tumor suppressors by repressing oncogenes [6,7].

Studies of tumor suppressive miRNAs and searches for their target genes are important for our understanding of miRNA-regulated cancer pathways, including those specific miRNAs altered in HNSCC [8-10]. Recently, our miRNA profiles showed that miR-133a was down-regulated in cancer cells and that miR-133a had tumor suppressive functions [11-13]. Interestingly, miR-1 and miR-133a are located on the same chromosomal locus, forming a so called cluster. miR-1 and miR-133a are expressed in muscle and might be the most studied miRNAs in skeletal and cardiac muscle development [14,15].

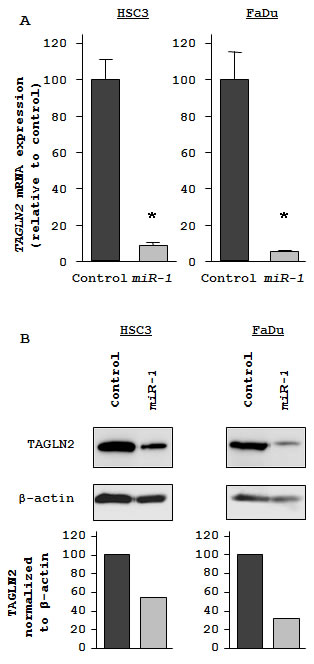
miR-1 was also down-regulated in our miRNA screening of hypopharyngeal and esophageal squamous cell carcinoma [13,16]. However, the functional significance of miR-1 has not been clarified in HNSCC. The aim of this study was to investigate the function of miR-1 in HNSCC cell lines and to identify miR-1-regulated cancer pathways. For target genes searches of miR-1 in HNSCC cells, we performed genome-wide gene expression analysis. We focused on transgelin 2 (TAGLN2) as a candidate target of miR-1, as it was among the most down-regulated genes. Insight into the association between tumor suppressive miRNA and their target oncogene networks could enhance our understanding of the molecular mechanism of HNSCC carcinogenesis.

Results

Effect of miR-1 transfection on cell proliferation, migration, and invasion in HNSCC cell lines

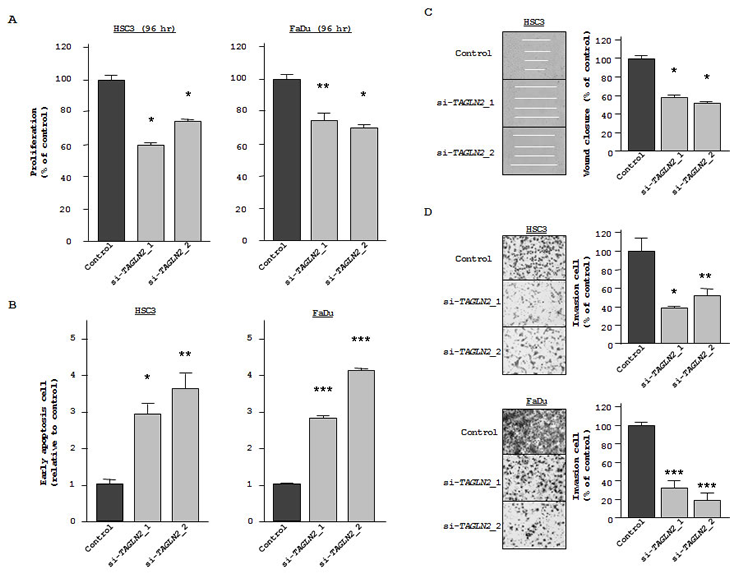
To determine the function of miR-1, we performed gain-of-function analysis using miR-1 transfectants. The XTT assay showed statistically significant inhibition of cell proliferation in miR-1 transfectants in comparison with miRNA controls after 72 hr and 96 hr. For example, after 72 hr, both miR-1 transfected HSC3 and FaDu cultures grew only ~42% as much as control cultures (both P < 0.05, Figure 1A, top), while after 96 hr, proliferation fell to 23% and 9% of controls, respectively, (both P < 0.05, Figure 1A, bottom). Wound healing assays of miR-1-transfected HSC3 demonstrated that cell migration was significantly inhibited to 5% that of control (P < 0.05; Figure 1B).The Matrigel invasion assay showed that the number of invading cells was significantly decreased in miR-1 transfectants. Relative to control values (100%), the percentages of invading HSC3 and FaDu cells were only 45% and 27.1%, respectively (both P < 0.05; Figure 1C).

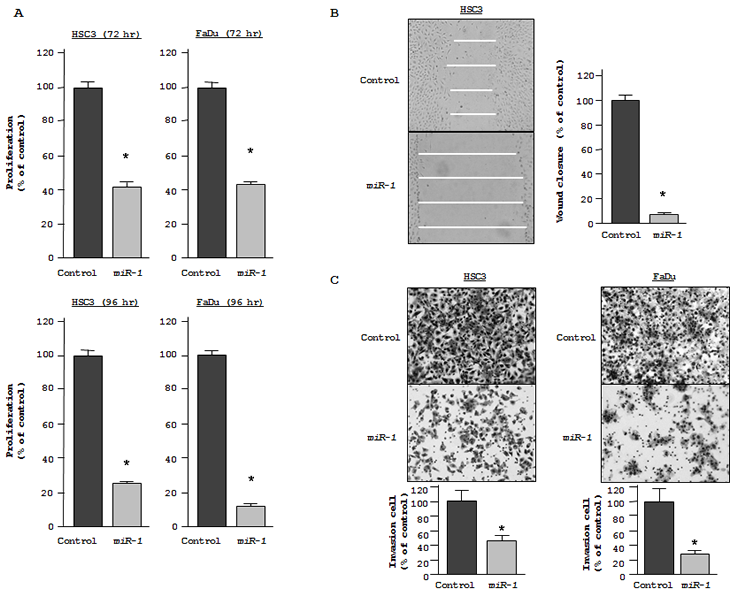
Figure 1: Gain-of-function studies using miR-1 transfected HNSCC cell lines (HSC3 and FaDu). (A) Cell growth as revealed by the XTT assay after 72 hr [above] and 96 hr [below]. (B) HSC3 cell migration activity (wound healing assay).(D) Cell invasion activity ( Matrigel invasion assay) in HSC3 and FaDu transfected with miR-1. *P < 0.05

Effect of miR-1 transfection on cell apoptosis and cell cycle in HNSCC cell lines

Cell apoptosis in miR-1 transfected cells was assessed by flow cytometry. The fraction of early apoptotic cells significantly increased in miR-1 transfectants approximately 3-fold in HSC3 and 12-fold in FaDu compared with controls (both P < 0.05, Figure 2A). We also confirmed induction of apoptosis approximately 4-fold in FaDu by ectopic miR-1 performing TUNEL assay (data not shown). As for cell cycle distribution, cells in G0/G1 phase were significantly greater in miR-1 transfectant than those in the control (Figure 2B). These results suggest that ectopic miR-1 expression induces G0/G1 arrest in both HNSCC cell lines

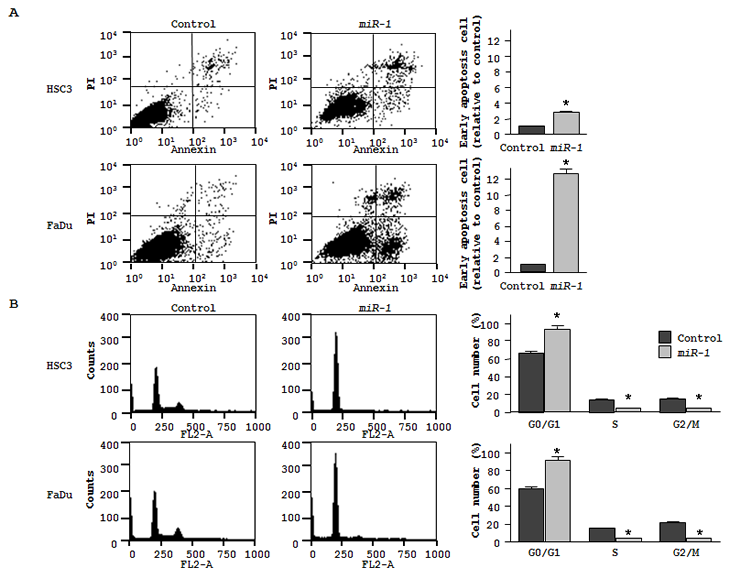
Figure 2: Effect of miR-1 transfection on cell apoptosis and cell cycle. (A) The representative quadrant figures of miRNA-control, or miR-1 transfectants in HSC3 [above] and FaDu [below] cells are shown. The bar chart shown on the right of each quadrant indicates the ratio of the early apoptotic cell fraction in miR-1 transfectants in comparison with miRNA-control transfectant. The data for the early apoptotic cell fraction is expressed as the relative value of the average expression of the miRNA-control transfectant. * P < 0.05. (B) The typical figures of cell cycle analysis of miRNA-control, or miR-1 transfectants are shown. The bar chart shown on the right of each figures represents the percentage of the cells in G0/G1, S, or G2/M phase as indicated. * P < 0.05.

Gene expression profiling identifies down-regulated genes in miR-1 transfectants

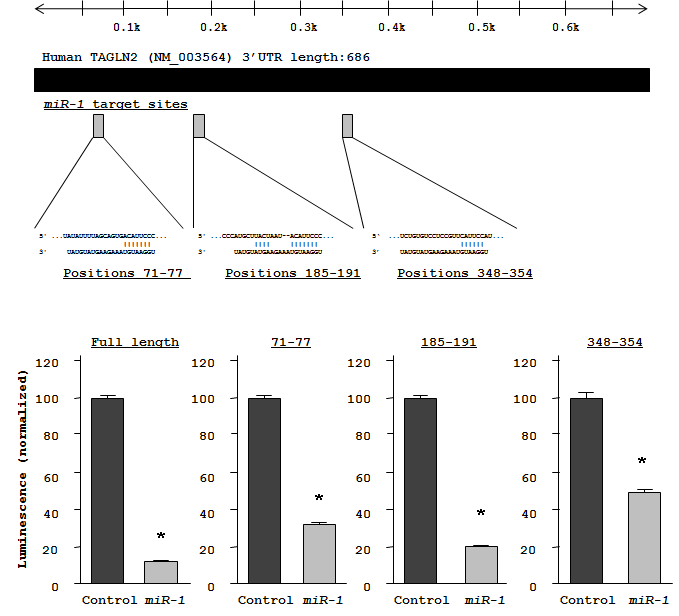
To investigate candidate molecular targets of miR-1 in HNSCC cells, we examined the effect of miR-1 on protein coding genes. Mature miR-1 was transiently transfected into HSC3 and FaDu cells, with negative miRNA transfection used as a control. Comprehensive gene expression analysis (see Methods) clearly showed changes in gene expression patterns between miR-1 and negative-control transfectants. To identify candidate miR-1 target genes, a cut-off of value less than -2.00-fold was applied to the array data. This filter resulted in the identification of 59 genes that were significantly down-regulated upon miR-1 transfection in both HSC3 and FaDu cells (top 20 genes are shown in Table 1). Entries from the microarray data were approved by the Gene Expression Omnibus (GEO), and were assigned GEO accession number GSE24782. The 3’ UTR of these down-regulated genes were examined for miR-1 target sites using the TargetScan database. Of the top 20 putative gene targets, 17 genes contained miR-1 target sites.

Table 1: Down-regulated genes in miR-1 transfectants

No. Entrez Gene ID Gene Symbol Gene Name Log2 ratio miR-1
target site
HSC3 FaDu Average
1 27230 SERP1 stress-associated endoplasmic reticulum protein 1 -1.61 -2.54 -2.08 +
2 8407 TAGLN2 transgelin 2 -1.77 -2.03 -1.90 +
3 23446 SLC44A1 solute carrier family 44, member 1 -1.62 -1.96 -1.79 +
4 9542 NRG2 neuregulin 2 -1.87 -1.60 -1.73 -
5 23531 MMD monocyte to macrophage differentiation-associated -1.38 -2.03 -1.71 +
6 5756 TWF1 twinfilin, actin-binding protein, homolog 1 (Drosophila) -1.57 -1.69 -1.63 +
7 5819 PVRL2 poliovirus receptor-related 2 (herpesvirus entry mediator B) -1.08 -2.02 -1.55 +
8 201895 C4orf34 chromosome 4 open reading frame 34 -1.53 -1.50 -1.52 +
9 3927 LASP1 LIM and SH3 protein 1 -1.33 -1.61 -1.47 +
10 7106 TSPAN4 tetraspanin 4 -1.26 -1.63 -1.45 +
11 4860 NP nucleoside phosphorylase -1.40 -1.48 -1.44 +
12 5757 PTMA prothymosin, alpha -1.33 -1.49 -1.41 +
13 84650 EBPL emopamil binding protein-like -1.48 -1.34 -1.41 +
14 303 ANXA2P1 annexin A2 pseudogene 1 -1.65 -1.15 -1.40 -
15 8683 SFRS9 splicing factor, arginine/serine-rich 9 -1.36 -1.38 -1.37 +
16 359845 FAM101B family with sequence similarity 101, member B -1.03 -1.68 -1.36 +
17 726 CAPN5 calpain 5 -1.46 -1.23 -1.35 +
18 64420 SUSD1 sushi domain containing 1 -1.25 -1.44 -1.34 +
19 9881 TRANK1 tetratricopeptide repeat and ankyrin repeat containing 1 -1.24 -1.40 -1.32 -
20 79794 C12orf49 chromosome 12 open reading frame 49 -0.98 -1.64 -1.31 +

TAGLN2 is a target of post-transcriptional repression by miR-1

TAGLN2 was the second ranked candidate gene in the genome-wide gene expression analysis. We focused on TAGLN2 and not the top ranked gene (SERP1), because the latter was not reported to be associated with carcinoma. The expression level of TAGLN2 mRNA was significantly decreased in both HNSCC cell lines (HSC3 and FaDu) transfected with miR-1 (Figure 3, upper). The protein expression levels were also markedly reduced in miR-1 transfectants (Figure 3, lower). HSC3 cells were used to determine the mechanism of miR-1 suppression of TAGLN2 expression. The TargetScan database identified three putative target sites in the 3’UTR of TAGLN2 (Figure 4, upper). A luciferase reporter assay confirmed the 3’UTR of TAGLN2 as the actual target of miR-1. Luciferase activity was significantly decreased by the full length 3’UTR of TAGLN2 as well as by all three predicted targeting sites of miR-1 (positions 71-77, 185-191, and 348-354 in the 3’UTR of TAGLN2) (Figure 4, lower).

Figure 3: Regulation of TAGLN2 expression in miR-1 transfectants. (A) RT-PCR revealed that TAGLN2 mRNA was markedly repressed in miR-1 transfectants compared with the miRNA-controls. * P < 0.05 (B) Western blots revealed that TAGLN2 protein was also decreased in miR-1.

Figure 4: Three target sites for miR-1 in the TAGLN2 3'UTR were identified with the TargetScan database. A luciferase reporter assay using the vector encoding full-length 3'UTR and respective putative target sites of TAGLN2 mRNA. The Renilla luciferase values were normalized by firefly luciferase values. * P < 0.05

Effects of TAGLN2 silencing on cell proliferation, apoptosis, migration, and invasion in HNSCC cell lines

Loss-of-function assays using siRNA analysis were performed to examine the oncogenic function of TAGLN2. We asked whether si-TAGLN2 reduced both mRNA and protein expression levels of si-TAGLN2 transfectants in HSC3 and FaDu. Both TAGLN2 mRNA and TAGLN2 protein were reduced following a 72 hr transfection with si-TAGLN2 (Figure 5). The XTT assay revealed significant cell growth inhibition in si-TAGLN2 transfected cells after 96 hr transfection. Specifically, with si-TAGLN2_1 and si-TAGLN2_2,HSC3 proliferation was inhibited

60.0% and 76.3%, respectively while FaDu was inhibited 76.8% and 69.2%, respectively (Figure 6A). Significant inhibition was not demonstrated after 72 hr transfection (data not shown). The fraction of early apoptotic HSC3 cells was increased in the two si-TAGLN2 transfectants from 1.00 in controls to 2.91 ± 0.32 (si-TAGLN2_1) and 3.76 ± 0.23 (si-TAGLN2_2)(Figure 6B). Similarly, with FaDu cells, apoptosis increased from 1.00 (control) to 2.83 ± 0.03 (si-TAGLN2_1) and 4.13 ± 0.04 (si-TAGLN2_2). The wound healing assay demonstrated that HSC3 cell migration was inhibited by 59.6 ± 3.2% (si-TAGLN2_1) and 54.9 ± 3.7 (si-TAGLN2_2) (Figure 6C). Finally, the Matrigel invasion assay showed that the number of invading cells was significantly decreased in si-TAGLN2 HSC3 transfectants relative to controls: 41.1 ± 3.5% (si-TAGLN2_1) and 54.5 ± 14.5 (si-TAGLN2_2). Similarly, FaDu transfectants were inhibited 29.4 ± 2.2% (si-TAGLN2_1) and 21.8 ± 1.3%(si-TAGLN2_2) (Figure 6D).

Figure 5: Effect of TAGLN2 silencing on HNSCC cells. (A) RT-PCR revealed that TAGLN2 mRNA was markedly repressed in si-TAGLN2 transfectants compared with the si-controls. * P < 0.0001 (B) Western blot revealed that TAGLN2 protein was also decreased in si-TAGLN2.

Figure 6: Loss-of-function studies using si-TAGLN2 transfected HNSCC cell lines. (A) Cell growth as revealed by the XTT assay. * P < 0.0001, ** P = 0.0003 (B) Apoptosis assay determined by flow cytometry. The apoptosis assay data are shown as normalized ratios in the histogram. * P = 0.0015, ** P = 0.002, *** P < 0.0001 (C) Cell migration activity (wound healing assay) in HSC3. * P < 0.0001; (D) Cell invasion activity ( Matrigel invasion assay) transfected with si-TAGLN2. * P < 0.0035, ** P < 0.0153, *** P < 0.0001

TAGLN2 mRNA and miR-1 expression in HNSCC clinical specimens

Data characterizing 20 HNSCC patients are presented in Table 2. The expression levels of miR-1 were significantly down-regulated in clinical HNSCC specimen compared with adjacent normal tissues (P = 0.0276, Figure 7A). Conversely, TAGLN2 mRNA was significantly up-regulated in tumor tissues (P = 0.0209, Figure 7B).

Table 2: Clinical features of HNSCC patients.

No. Gender Age Location Differentiation T N M Stage
1 Male 82 Tongue Well 1 0 0 I
2 Male 64 Tongue Moderate 3 2b 0 IVA
3 Male 66 Tongue Well 2 0 0 II
4 Male 70 Tongue Well 1 0 0 I
5 Male 67 Oral floor Moderate 3 2b 0 IVA
6 Male 47 Oral floor Moderate 1 2a 0 IVA
7 Male 69 Larynx Well 3 0 0 III
8 Male 73 Larynx Well 2 0 0 II
9 Male 80 Larynx Poor 3 2b 0 IVA
10 Male 59 Oropharynx Poor 4a 0 0 IVA
11 Male 76 Oropharynx Poor 2 0 0 II
12 Male 55 Oropharynx Moderate 3 2c 0 IVA
13 Female 83 Oropharynx Moderate 1 0 0 I
14 Male 74 Oropharynx Well 2 0 0 II
15 Male 66 Hypopharynx Moderate 2 2c 0 IVA
16 Male 71 Hypopharynx Poor 2 2b 0 IVA
17 Male 49 Hypopharynx Moderate 2 2b 0 IVA
18 Male 71 Hypopharynx Poor 4a 2b 0 IVA
19 Male 66 Hypopharynx Well 4a 2c 0 IVA
20 Male 66 Hypopharynx Moderate 3 2c 0 IVA

Figure 7: miR-1 and TAGLN2 mRNA expression levels in clinical specimens. (A) miR-1 expression in normal adjacent tissues and tumor tissues in 20 clinical specimens of HNSCC. (B) TAGLN2 mRNA expression in tumor tissues and normal adjacent tissues in 20 clinical HNSCC specimens.

Discussion

Aberrant expression of miRNAs and dysregulated gene expression of tumor suppressors and oncogenes have been associated with the development of human cancers. For the purpose of identification of cancer-related miRNAs, we determined miRNA expression signatures in hypopharyngeal and esophageal squamous cell carcinomas. Those profiles showed that miR-1 was significantly down-regulated and had the features of a candidate tumor suppressor [13,16]. Other researchers have found that miR-1 was down-regulated in other types of cancer[17-20]. Ectopic expression of miR-1 inhibited cancer cells in hepatocellular carcinoma, rhabdomyosarcoma, and lung cancer[18-20].

Interestingly, miR-1-1/miR-133a-2, miR-1-2/miR-133a-1, and miR-206/miR-133b are clustered on three different chromosomal regions in the human genome, 20q13.33, 18q11.2, and 6p12.1, respectively. miR-206 is similar to miR-1 in terms of expression and function but differs from the miR-1 sequence by four nucleotides. miR-133a-1 and miR-133a-2 possess identical mature sequences. miR-133b differs from miR-133a by a single nucleotide at the 3’ end [15]. Regarding miR-133a in human cancers, our previous studies demonstrated that miR-133a functions as a tumor suppressor and targets multiple oncogenes, such as FSCN1[12,13,21], LASP1 [22], CAV1 [23] and GSTP1 [24,25]. Other studies revealed that miR-133a was reduced in pancreatic ductal adenocarcinoma [26], colorectal carcinoma [27], tongue squamous cell carcinoma [28], and rhabdomyosarcoma [29]. It is clear that regulation of target genes by miR-133a is deeply involved in the modulation of cancer cells.

In this study, our data revealed that restoration of miR-1 expression suppressed cell proliferation, migration, and invasion and promoted apoptosis and cell cycle arrest in HNSCC cells. Our results and those of past reports indicate that miR-1 frequently functions as a tumor suppressor in human cancer.

miRNAs control the expression of target genes which contribute to cancer development and progression. Because it is important to identify novel miRNA-mediated cancer pathways, we investigated miR-1-regulated oncogenic targets. We adopted a method of genome-wide gene expression analysis in two HNSCC cell lines, using miR-1 transfectants to identify targets. This strategy has led to the identification of tumor suppressive miRNAs targets [12,13,16,21,23,25]. Published articles revealed that miR-1 mediates cell apoptosis, targeting BCL2 in cardiac muscles [30]. In cancer, miR-1 induced apoptosis through repression of Mcl-1 in lung cancer [19]. miR-1 also targets c-Met in rhabdomyosarcoma [20]. However, to our knowledge, the target gene of miR-1 in HNSCC was unknown. TAGLN2 was significantly down-regulated by ectopic expression of miR-1 in HNSCC cell lines in our present study. The luciferase reporter assay revealed that TAGLN2 contains three sites that actually bind miR-1. This is the first report demonstrating that tumor suppressive miR-1 directly regulates TAGLN2 in HNSCC cells.

TAGLN2 is a member of the calponin family of actin-binding proteins. TAGLN2 is a homolog of the protein TAGLN [31]. Though over-expression of TAGLN2 was observed in hepatocellular carcinoma, lung adenocarcinoma, and pancreatic cancer [32-35], analysis of TAGLN2 in HNSCC has not yet been reported. Here, we demonstrated significant up-regulation of TAGLN2 expression in HNSCC clinical specimens. It was demonstrated that increasing TAGLN2 expression was correlated with lymph node metastasis, distant metastasis, and the TNM classification in colorectal cancer [36]. Those results support the present loss-of-function analysis with si-TAGLN2, confirming that TAGLN2 mediates cell migration and invasion, suggesting that this gene may have an oncogenic function. However, it is still unknown how TAGLN2, an actin-binding protein, contributes to cell apoptosis, which should be clarified by further analysis.

In conclusion, our results show that restoration of miR-1 in cancer cells inhibits cell proliferation, invasion, and migration, supporting the hypothesis that miR-1 functions as a tumor suppressor in HNSCC. Our data also indicate that TAGLN2 may have an oncogenic function which is directly regulated by miR-1. The identification of novel miR-1-regulated cancer pathways could provide new insights into potential molecular mechanisms and applications to diagnosis, therapy, and prevention of the disease.

Methods

HNSCC cell culture

Human HNSCC cell lines (HSC3, derived from a lymph node metastasis of tongue squamous cell carcinoma, and FaDu, derived from a primary lesion of hypopharyngeal squamous cell carcinoma) were provided by the American Type Culture Collection (ATCC, Manassas, VA, USA). Both cell lines were grown in Dulbecco’s Modified Eagle’s Medium/Nutrient Mixture F-12 Ham (DMEM/F-12) supplemented with 10% fetal bovine serum in a humidified atmosphere containing 5% CO2 at 37°C.

RNA isolation

Total RNA was isolated using TRIzol reagent (Invitrogen, Carlsbad, CA, USA) according to the manufacturer’s protocol. RNA concentrations were determined spectrophotometrically, and molecular integrity was checked by gel electrophoresis. RNA quality was confirmed using an Agilent 2100 Bioanalyzer (Agilent Technologies, Santa Clara, CA, USA).

Mature miRNA transfection and small interfering RNA treatment

The following RNA species were used in this study: mature miRNAs, Pre-miRTM miRNA Precursors (hsa-miR-1; Pre-miR ID: PM10633), negative control miRNA (P/N: AM17111) (Applied Biosystems, Foster City, CA, USA), small interfering RNA (Stealth Select RNAi™ siRNA; si-TAGLN2 Cat#; HSS144745 and HSS144746) (Invitrogen) and negative control siRNA (D-001810-10; Thermo Fisher Scientific, Waltham, MA, USA). RNAs were incubated with Opti-MEM (Invitrogen) and LipofectamineTM RNAiMax reagent (Invitrogen) as described previously [11]. Transfection efficiency of Pre-miRTM in cell lines was confirmed based on down-regulation of TWF1(PTK9) mRNA following transfection with miR-1 as previously reported [12,13,16].

Cell proliferation, migration and invasion assays

Cells were transfected with 10 nM miRNA and siRNA by reverse transfection and plated in 96 well plates at 3 x 10³ cells per well. After 72 hr or 96 hr, cell proliferation was determined by the XTT assay, using the Cell Proliferation Kit II (Roche Molecular Biochemicals, Mannheim, Germany) [13,16]. Triplicate wells were measured for cell viability in each treatment group.

Cell migration activity was evaluated using a wound-healing assay. HSC3 was plated in six well plates at 2 x 10⁵ cells per well, and the cell monolayers were scraped using a micropipette tip. The initial gap length (0 hr) and the residual gap length (24 hr after wounding) were calculated from photomicrographs [12]. FaDu was not suitable for the wound healing assay because the cell monolayer tended to peel off during scraping.

A cell invasion assay was carried out using modified Boyden chambers containing transwell-precoated Matrigel membrane filter inserts with eight μm pores in 24 well tissue culture plates at 1 x 10⁵ cells per well (BD Biosciences, Bedford, MA, USA)[12]. Triplicate wells were measured for cell invasion in each treatment group.

Flow cytometry

HSC3 and FaDu cells transiently transfected with miRNA-control, miR-1, siRNA-control and si-TAGLN2 were harvested 72 hr after transfection by trypsinization. After the double staining with FITC-Annexin V and Propidium iodide (PI) was done using the FITC Annexin V Apoptosis Detection Kit (BD Biosciences) according to the manufacturer’s recommendations, the cells were analyzed with a flow cytometry (FACScan®; BD Biosciences) equipped with a CellQuest software (BD Biosciences). Cells were discriminated into viable cells, dead cells, early apoptotic cells, and apoptotic cells, and then the relative ratio of early apoptotic cells to miRNA-control transfectant from each experiment were compared. Cells for cell cycle analysis were stained with PI using the CycleTEST™ PLUS DNA Reagent Kit (BD Biosciences) following the protocol and analyzed by FACScan. The percentage of the cells in G0/G1, S, and G2/M phase were counted and compared. Experiments were done in triplicate.

Target gene search for miR-1

A genome-wide screen using miR-1 transfectants was performed to identify target genes of miR-1 in two HNSCC cell lines, HSC3 and FaDu. Oligo-microarray human 44K (Agilent Technologies) was used for expression profiling of the transfectants in comparison with a miRNA-negative-control transfectant [12,13,16]. Hybridization and wash steps were performed as previously described [37]. The arrays were scanned using a Packard GSI Lumonics ScanArray 4000 (Perkin Elmer, Boston, MA, USA). The data were analyzed by means of DNASIS array software (Hitachi Software Engineering, Tokyo, Japan), which converted the signal intensity for each spot into text format. The log2 ratios of the median-subtracted background intensities were analyzed. Data from each microarray study were normalized by a global normalization method [37].

Predicted target genes and their target miRNA binding site seed regions were investigated using TargetScan (release 5.1, http://www.targetscan.org/). The sequences of the predicted mature miRNAs were confirmed using miRBase (release 16.0, http://microrna.sanger.ac.uk/).

Real-time quantitative RT-PCR

First-strand cDNA was synthesized from one μg of total RNA using a High Capacity cDNA Reverse Transcription Kit (Applied Biosystems). Gene-specific PCR products were assayed continuously using a 7900-HT Real-Time PCR System according to the manufacturer’s protocol. The initial PCR step consisted of a ten min hold at 95°C, followed by 40 cycles consisting of a 15 sec denaturation at 95°C and a one min annealing/extension at 63°C. TaqMan® probes and primers for TAGLN2 (P/N: Hs00761239_s1) and the GAPDH (A/N: NM_002046) internal control were obtained from Applied Biosystems (Assay-On-Demand Gene Expression Products). The expression levels of miR-1 (P/N: PM10617) were analyzed by TaqMan quantitative real-time PCR (TaqMan® MicroRNA Assay; Applied Biosystems) and normalized to RNU48 (A/N: X96648). All reactions were performed in triplicate, and included negative control reactions that lacked cDNA.

Immunoblotting

Cells were harvested 72 hr after transfection and lysates were prepared. Fifty μg of protein lysate was separated by NuPAGE on 4 - 12% bis-tris gels (Invitrogen) and transferred to PVDF membranes. Immunoblotting was performed with diluted (1:150) polyclonal TAGLN2 antibody (HPA001925; Sigma-Aldrich, St. Louis, MO, USA), with β-actin antibody (sc-1615; Santa Cruz Biotechnology, Santa Cruz, CA, USA) used as an internal control. The membrane was washed and incubated with goat anti-mouse IgG (H+L)-HRP conjugate (Bio-Rad, Hercules, CA, USA). Specific complexes were visualized by echochemiluminescence (GE Healthcare Bio-Sciences, Princeton, NJ, USA), and the expression level of these genes was evaluated by ImageJ software (ver.1.43; http://rsbweb.nih.gov/ij/index.html).

Plasmid construction and dual-luciferase assay

MiRNA target sequences were inserted between the XhoI–PmeI restriction sites in the 3’UTR of the hRluc gene in the psiCHECK™-2 vector (C8021; Promega, Madison, WI, USA). Primer sequences for full-length 3’UTR of TAGLN2 mRNA (ATCGCTCGAGACAGATGGGCACCAACCGCG and CTCTAGGTTTAAACATCTTCCTCAAGCCCCAGAC) were designed. Specific miRNA target sequences (71–77: atattttagcagtgacattcccagagagccccaga gctct; 185-191: tcccccatgcttactaatacattcccttccccatagccat; 348-354: ctgagctctgtgtcctccgttcattccatggctgggagtc) for miR-1 were artificially synthesized and inserted in the vector. Following that, HSC3 cells were transfected with 15 ng of vector, 10 nM of

miRNA, and one μL of Lipofectamine™ 2000 (Invitrogen) in 100 μL of Opti-MEM™ (Invitrogen). The activities of firefly and Renilla luciferases in cell lysates were determined with a dual-luciferase assay system (E1910; Promega). Normalized data were calculated as quotients of Renilla/firefly Luciferase activities.

Clinical HNSCC specimens

Twenty pairs of primary HNSCC (oral cavity, six; larynx, three; oropharynx, five; hypopharynx, six) and corresponding normal epithelial samples were obtained from patients in Chiba University Hospital (Chiba, Japan) from 2007 to 2009. All tissue specimens were obtained from patients undergoing surgical treatment. Normal tissues were obtained far from the center of the cancer in surgical specimens. No cancer cells were detected in neighboring formalin-fixed paraffin-embedded tissues. Written consent of tissue donation for research purposes was obtained from each patient before tissue collection. The protocol was approved by the Institutional Review Board of Chiba University. The specimens were immersed in RNAlater (Qiagen, Valencia, CA, USA) and stored at -20°C until RNA was extracted.

Statistical analysis

The relationships between two groups and the numerical values obtained by real-time RT-PCR were analyzed using the nonparametric Mann-Whitney U test or the paired t-test. The relationship among three variables and numerical values was analyzed using the Bonferroni-adjusted Mann-Whitney U test; a non-adjusted statistical level of significance of P < 0.05 corresponded to a Bonferroni-adjusted level of P < 0.0167. All analyses were performed using Expert StatView (version 4, SAS Institute Inc., Cary, NC, USA).

Acknowledgements

This study was supported by the Ministry of Education, Science, Sports and Culture, Grant-in-Aid for Scientific Research (C), 21592187.

References

1. Jemal A, Siegel R, Xu J, Ward E. Cancer statistics, 2010. CA Cancer J Clin 2010;60:277-300.

2. Hardisson D. Molecular pathogenesis of head and neck squamous cell carcinoma. Eur Arch Otorhinolaryngol 2003;260:502-508.

3 Bartel DP. MicroRNAs: genomics, biogenesis, mechanism, and function. Cell 2004;116:281-297.

4. Filipowicz W, Bhattacharyya SN, Sonenberg N. Mechanisms of post-transcriptional regulation by microRNAs: are the answers in sight? Nat Rev Genet 2008;9:102-114.

5. Calin GA, Croce CM. MicroRNA signatures in human cancers. Nat Rev Cancer 2006;6:857-866.

6. Nelson KM, Weiss GJ. MicroRNAs and cancer: past, present, and potential future. Mol Cancer Ther 2008;7:3655-3660.

7. Esquela-Kerscher A, Slack FJ. Oncomirs - microRNAs with a role in cancer. Nat Rev Cancer 2006;6:259-269.

8. Liu X, Chen Z, Yu J, Xia J, Zhou X. MicroRNA profiling and head and neck cancer. Comp Funct Genomics 2009:837514 Epub 2009:837514.

9. Tran N, O’Brien CJ, Clark J, Rose B. Potential role of micro-RNAs in head and neck tumorigenesis. Head Neck 2010;32:1099-1111.

10. Childs G, Fazzari M, Kung G, Kawachi N, Brandwein-Gensler M, McLemore M, Chen Q, Burk RD, Smith RV, Prystowsky MB, Belbin TJ, Schlecht NF. Low-level expression of microRNAs let-7d and miR-205 are prognostic markers of head and neck squamous cell carcinoma. Am J Pathol 2009;174:736-745.

11. Ichimi T, Enokida H, Okuno Y, Kunimoto R, Chiyomaru T, Kawamoto K, Kawahara K, Toki K, Kawakami K, Nishiyama K, Tsujimoto G, Nakagawa M, Seki N. Identification of novel microRNA targets based on microRNA signatures in bladder cancer. Int J Cancer 2009;125:345-352.

12. Chiyomaru T, Enokida H, Tatarano S, Kawahara K, Uchida Y, Nishiyama K, Fujimura L, Kikkawa N, Seki N, Nakagawa M. miR-145 and miR-133a function as tumour suppressors and directly regulate FSCN1 expression in bladder cancer. Br J Cancer 2010;102:883-891.

13. Kano M, Seki N, Kikkawa N, Fujimura L, Hoshino I, Akutsu Y, Chiyomaru T, Enokida H, Nakagawa M, Matsubara H. miR-145, miR-133a and miR-133b: Tumor suppressive miRNAs target FSCN1 in esophageal squamous cell carcinoma. Int J Cancer 2010;127:2804-2814.

14. Callis TE, Wang DZ. Taking microRNAs to heart. Trends Mol Med 2008;14:254-260.

15. Townley-Tilson WH, Callis TE, Wang D. MicroRNAs 1, 133, and 206: critical factors of skeletal and cardiac muscle development, function, and disease. Int J Biochem Cell Biol 2010;42:1252-1255.

16. Kikkawa N, Hanazawa T, Fujimura L, Nohata N, Suzuki H, Chazono H, Sakurai D, Horiguchi S, Okamoto Y, Seki N. miR-489 is a tumour-suppressive miRNA target PTPN11 in hypopharyngeal squamous cell carcinoma (HSCC). Br J Cancer 2010;103:877-884.

17. Ambs S, Prueitt RL, Yi M, Hudson RS, Howe TM, Petrocca F, Wallace TA, Liu CG, Volinia S, Calin GA, Yfantis HG, Stephens RM, Croce CM. Genomic profiling of microRNA and messenger RNA reveals deregulated microRNA expression in prostate cancer. Cancer Res 2008;68:6162-6170.

18. Datta J, Kutay H, Nasser MW, Nuovo GJ, Wang B, Majumder S, Liu CG, Volinia S, Croce CM, Schmittgen TD, Ghoshal K, Jacob ST. Methylation mediated silencing of MicroRNA-1 gene and its role in hepatocellular carcinogenesis. Cancer Res 2008;68:5049-5058.

19. Nasser MW, Datta J, Nuovo G, Kutay H, Motiwala T, Majumder S, Wang B, Suster S, Jacob ST, Ghoshal K. Down-regulation of micro-RNA-1 (miR-1) in lung cancer. Suppression of tumorigenic property of lung cancer cells and their sensitization to doxorubicin-induced apoptosis by miR-1. J Biol Chem 2008;283:33394-33405.

20. Yan D, Dong Xda E, Chen X, Wang L, Lu C, Wang J, Qu J, Tu L. MicroRNA-1/206 targets c-Met and inhibits rhabdomyosarcoma development. J Biol Chem 2009;284:29596-29604.

21. Fuse M, Nohata N, Kojima S, Sakamoto S, Chiyomaru T, Kawakami K, Enokida H, Nakagawa M, Naya Y, Ichikawa T, Seki N. Restoration of miR-145 expression suppresses cell proliferation, migration and invasion in prostate cancer by targeting FSCN1. Int J Oncol 2011;[Epub ahead of print] PMID: 21258769.

22. Chiyomaru T, Enokida H, Kawakami K, Tatarano S, Uchida Y, Kawahara K, Nishiyama K, Seki N, Nakagawa M. Functional role of LASP1 in cell viability and its regulation by microRNAs in bladder cancer. Urol Oncol 2010;[Epub ahead of print] PMID: 20843712.

23. Nohata N, Hanazawa T, Kikkawa N, Mutallip M, Fujimura L, Yoshino H, Kawakami K, Chiyomaru T, Enokida H, Nakagawa M, Okamoto Y, Seki N. Caveolin-1 mediates tumor cell migration and invasion and its regulation by miR-133a in head and neck squamous cell carcinoma. Int J Oncol 2011;38:209-217.

24. Mutallip M, Nohata N, Hanazawa T, Kikkawa N, Horiguchi S, Fujimura L, Kawakami K, Chiyomaru T, Enokida H, Nakagawa M, Okamoto Y, Seki N. Glutathione S-transferase P1 (GSTP1) suppresses cell apoptosis and its regulation by miR-133a in head and neck squamous cell carcinoma (HNSCC). Int J Mol Med 2011;27;345-352

25. Uchida Y, Chiyomaru T, Enokida H, Kawakami K, Tatarano S, Kawahara K, Nishiyama K, Seki N, Nakagawa M. MiR-133a induces apoptosis through direct regulation of GSTP1 in bladder cancer cell lines. Urol Oncol;In press.

26. Szafranska AE, Davison TS, John J, Cannon T, Sipos B, Maghnouj A, Labourier E, Hahn SA. MicroRNA expression alterations are linked to tumorigenesis and non-neoplastic processes in pancreatic ductal adenocarcinoma. Oncogene 2007;26:4442-4452.

27. Arndt GM, Dossey L, Cullen LM, Lai A, Druker R, Eisbacher M, Zhang C, Tran N, Fan H, Retzlaff K, Bittner A, Raponi M. Characterization of global microRNA expression reveals oncogenic potential of miR-145 in metastatic colorectal cancer. BMC Cancer 2009;9:374.

28. Wong TS, Liu XB, Chung-Wai Ho A, Po-Wing Yuen A, Wai-Man Ng R, Ignace Wei W. Identification of pyruvate kinase type M2 as potential oncoprotein in squamous cell carcinoma of tongue through microRNA profiling. Int J Cancer 2008;123:251-257.

29. Rao PK, Missiaglia E, Shields L, Hyde G, Yuan B, Shepherd CJ, Shipley J, Lodish HF. Distinct roles for miR-1 and miR-133a in the proliferation and differentiation of rhabdomyosarcoma cells. FASEB J 2010;24:3427-3437.

30. Tang Y, Zheng J, Sun Y, Wu Z, Liu Z, Huang G. MicroRNA-1 regulates cardiomyocyte apoptosis by targeting Bcl-2. Int Heart J 2009;50:377-387.

31. Prinjha RK, Shapland CE, Hsuan JJ, Totty NF, Mason IJ, Lawson D. Cloning and sequencing of cDNAs encoding the actin cross-linking protein transgelin defines a new family of actin-associated proteins. Cell Motil Cytoskeleton 1994;28:243-255.

32. Huang J, Sheng HH, Shen T, Hu YJ, Xiao HS, Zhang Q, Zhang QH, Han ZG. Correlation between genomic DNA copy number alterations and transcriptional expression in hepatitis B virus-associated hepatocellular carcinoma. FEBS Lett 2006;580:3571-3581.

33. Shi YY, Wang HC, Yin YH, Sun WS, Li Y, Zhang CQ, Wang Y, Wang S, Chen WF. Identification and analysis of tumour-associated antigens in hepatocellular carcinoma. Br J Cancer 2005;92:929-934.

34. Rho JH, Roehrl MH, Wang JY. Tissue proteomics reveals differential and compartment-specific expression of the homologs transgelin and transgelin-2 in lung adenocarcinoma and its stroma. J Proteome Res 2009;8:5610-5618.

35. Chen R, Yi EC, Donohoe S, Pan S, Eng J, Cooke K, Crispin DA, Lane Z, Goodlett DR, Bronner MP, Aebersold R, Brentnall TA. Pancreatic cancer proteome: the proteins that underlie invasion, metastasis, and immunologic escape. Gastroenterology 2005;129:1187-1197.

36. Zhang Y, Ye Y, Shen D, Jiang K, Zhang H, Sun W, Zhang J, Xu F, Cui Z, Wang S. Identification of transgelin-2 as a biomarker of colorectal cancer by laser capture microdissection and quantitative proteome analysis. Cancer Sci 2010;101:523-529.

37. Sugimoto T, Seki N, Shimizu S, Kikkawa N, Tsukada J, Shimada H, Sasaki K, Hanazawa T, Okamoto Y, Hata A. The galanin signaling cascade is a candidate pathway regulating oncogenesis in human squamous cell carcinoma. Genes Chromosomes Cancer 2009;48:132-142.


Creative Commons License All site content, except where otherwise noted, is licensed under a Creative Commons Attribution 4.0 License.
PII: 213