
INTRODUCTION
Although enormous progress has been made in cancer research during the past decades, oral squamous cell carcinoma (OSCC) remains a malignancy worldwide. Due to the lack of public awareness and screening method, patients are often diagnosis at an advanced stage accompanied by metastasis, which leads to a poor prognosis. The five-year survival rate of this disease is below 50% [1, 2], which is strongly dependent upon the stage at OSCC diagnosis. When OSCC patients are diagnosis at early stage of development, it has less disfiguring and psychologically-traumatic and with a 5-year survival rate approaching to 90% [3]. The outcome of this disease is significantly better if patients could be diagnosed at the early stage and received the individual treatment plan based on biological malignancy. However, currently histopathology grade, lymph node (LN) metastasis, and serum tumor markers, such as serum squamous cell carcinoma antigen (SCCA), are still used as prognostic factors for patients with OSCC. Meanwhile, although the higher level of serum SCCA may serve as a marker for dysplasia and progression to OSCC, the predictive performance for abnormal level of SCCA for OSCC was not satisfactory (P=0.055) [2]. In recent years, considerable progress has been made in understanding the genetic and protean basis of OSCC and identified a number of potential biomarkers that might improve the diagnostic and predictive performance [4–6]. However, no ideal biomarkers have been widely used in clinical practice because of poor validation performance and expenses. Because metabolites are the ultimate downstream product of gene expression, changes in metabolites are amplified relative to the changes in the transcriptome and proteome [7] and might be the most similar to the phenotype of the biological system studied. To date, some metabolites have been reported as biomarkers in the diagnosis of OSCC [8, 9]. However, these studies focused on conducting metabolomics on tissues and cell line, not plasma for diagnosis. Meanwhile, in such an extremely complex pathological process, it requires adaptations across multiple metabolic process to satisfy the energy in order to increase the proliferation rate. Therefore, developing new or supplementary metabolites for early diagnosis is urgently needed.
In all living cells, lipids are needed to maintain cellular structure, store energy and involved in cell signaling. Lipid metabolism connects to signaling networks in the regulation of cell growth, proliferation, differentiation apoptosis and membrane homeostasis [10–12]. Additionally, deregulated lipid metabolism can alter membrane composition and permeability, which might cause the development and progression of many diseases, especially malignant carcinoma. Therefore, theoretically, lipid profiles in cancer cells could be distinguishable from those of normal cells, and such a distinctive lipid profile could be reflected in the biofluids of patients with OSCC. Lipidomics, a specific component of metabolomics [13], describes the identification, quantification and profiling of individual lipid molecules extracted from biological samples [14]. It has been widely utilized to diagnose and investigate the pathogenesis of various cancers, such as pancreatic adenocarcinoma [15], thyroid cancer [16], colon cancer [17], hepatocellular carcinoma [18], glioblastoma [19] and prostate cancer [20]. However, few studies have been performed to systematically investigate plasma lipid profiling and to comprehensively characterize the changes in lipid metabolism between OSCC patients and controls.
In the present study, we aimed to expand the metabolic process to lipidomics study on plasma samples of OSCC and compared the lipid profiles of OSCC patients and controls. Furthermore, differentially expressed lipids were identified between OSCC patients and controls. Finally, the lipids associated with specific pathological stages were presented in order to select the biomarkers for OSCC early diagnosis.
RESULTS
Demographics and clinic pathological characteristics
We performed case-control matching for patients and controls. A total of 100 patients eligible for analysis, 50% (50) with malignant tumors, 50% (50) control, were enrolled in this study from the Department of Oral and Maxillofacial Surgery, The affiliated Second Hospital of Harbin Medical University, Harbin, Heilongjiang Province, China. All patients had pathological confirmation for diagnosis, metastasis assessment and staging (I–IV). The demographics and clinic pathological characteristics of these patients were listed in Table 1. A total of 38% (19/50) of the patients were classified as stage I, 26.00% (13/50) as stage II, 26.00% (13/50) as stage III and 10.00% (5/50) as stage IV.
Table 1: Demographics and clinic pathological characteristics between OSCC and control groups
Characteristics |
OSCC |
Control |
|---|---|---|
Age |
45±4.22 |
47±4.56 |
Gender |
|
|
Male |
43(0.86) |
40(0.80) |
Female |
7(0.14) |
10(0.20) |
FIGO |
|
|
I |
10(0.20) |
|
II |
18(0.36) |
|
III |
13(0.26) |
|
IV |
9(0.18) |
|
Lymphatic metastasis |
|
|
Yes |
17(0.34) |
|
No |
33(0.66) |
|
Tumor location |
|
|
Carcinoma of the tongue |
18(0.36) |
|
The floor of mouth |
16(0.32) |
|
The buccal mucosa |
5(0.10) |
|
The gingiva |
3(0.06) |
|
The lip |
8(0.16) |
|
Plasma lipid profiling of OSCC patients and controls
After excluding isotopic peaks, plasma lipid profiling consisted of 1937 ions (peaks) in positive electrospray ionization (ESI+) mode. According to the identification strategy described in previous studies [21, 22], 459 plasma lipids were used for further analysis. The principal component analysis (PCA) performed on all the samples revealed that the quality control (QC) samples were tightly clustered, which indicated the robustness of our lipid profiling platform (Supplementary Figure 1). Projection to latent structures discriminant analysis (PLS-DA) score-plot was used for classification of the plasma samples based on these differential plasma lipids (Figure 1). This analysis indicated that OSCC patients and controls had different lipid profiles. The cumulative R2Y and Q2 were 0.443 and 0.221, respectively, when three components were calculated. Validation plot obtained from 100 permutation tests showed no over-fitting of established model and all the permutation cumulative Q2 values were lower than the original values.
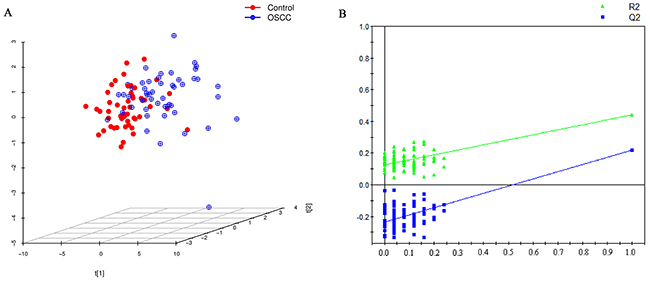
Figure 1: (A) PLS-DA score plot for discriminating OSCC and control with R2Y=0. 443, Q2=0.221. (B) Validation plot for discriminating OSCC and control, all the permutation cumulative Q2 values were lower than the original values.
Differential lipid selection in OSCC patients and controls
Following successful establishment of PLS-DA model, variable importance in the projection (VIP) value for each plasma lipid was calculated. Based on the two criteria of ßßlocal false discovery rate (lfdr) <0.05 and VIP>1, a total of 20 differential lipids were selected as potential lipid biomarkers of OSCC for further analysis (Supplementary Figure 2). Details about these lipids were listed in Table 2. The identified 20 plasma lipids were grouped into two lipid categories, i.e., glycerphospholipids [GPs; glycerophosphocholines (PCs), glycerophosphoethanolamines (PEs), glycerophosphoglycerols (PGs), lyso-glycerophosphocholines (Lyso-PCs)], sphingolipids [SPs; ceramides (Cers) and sphingomyelins (SMs)]. We provided several representative figures of mass spectra for each lipid categories in OSCC patients (Supplementary Figures 3–7). Interestingly, we found that all the PCs contained two acyl chains and all the PEs were with plasmalogen (pPEs). All the GPs were decreased in the OSCC patients compared with the controls. Whereas, sphingolipids were significantly increased in the OSCC patients compared with the controls.
Table 2: Twenty differential lipids between OSCC and control
Name |
mz |
rt |
FC |
density |
P value |
AUC |
|---|---|---|---|---|---|---|
PC(32:2) |
730.5203 |
828.82 |
0.72 |
down |
<0.001 |
0.79 |
PC(34:4) |
754.5129 |
813.36 |
0.56 |
down |
<0.001 |
0.79 |
PC(36:4) |
782.5313 |
848.59 |
0.69 |
down |
<0.001 |
0.74 |
PC(36:5) |
780.571 |
801.89 |
0.61 |
down |
<0.001 |
0.71 |
PC(36:7) |
776.4328 |
812.12 |
0.51 |
down |
<0.001 |
0.77 |
PC(38:6) |
806.6107 |
840.11 |
0.75 |
down |
<0.001 |
0.74 |
PC(38:8) |
802.4852 |
798.25 |
0.57 |
down |
<0.001 |
0.77 |
PC(38:9) |
800.5383 |
797.62 |
0.64 |
down |
<0.001 |
0.74 |
PC(40:8) |
830.645 |
829.96 |
0.78 |
down |
<0.001 |
0.72 |
PE(P-34:2) |
700.6135 |
936.65 |
0.76 |
down |
<0.001 |
0.73 |
PE(P-36:2) |
728.504 |
991.14 |
0.81 |
down |
<0.001 |
0.7 |
PE(P-36:4) |
724.5517 |
929.04 |
0.75 |
down |
<0.001 |
0.73 |
PE(P-38:5) |
750.4511 |
934.49 |
0.81 |
down |
<0.001 |
0.66 |
Cer(d18:1/16:0) |
538.5502 |
954.4 |
1.56 |
up |
<0.001 |
0.76 |
Cer(d18:1/18:0) |
566.5151 |
1007.19 |
1.61 |
up |
<0.001 |
0.71 |
GlcCeramide(d18:1/16:0) |
700.5802 |
886.65 |
1.61 |
up |
<0.001 |
0.77 |
SM(d18:0/18:1) |
731.6491 |
925.12 |
1.47 |
up |
<0.001 |
0.79 |
Trihexosylceramide (d18:1/16:0) |
1024.7369 |
830.21 |
1.45 |
up |
<0.001 |
0.85 |
LysoPC(14:0) |
468.3542 |
111.67 |
0.63 |
down |
<0.001 |
0.77 |
PG(34:2) |
747.5116 |
928.66 |
0.78 |
down |
<0.001 |
0.71 |
Measured mass to charge ratio (m/z); Retention time (s, RT); Fold change (FC).
Significance of lipids in the pathological staging of OSCC
Accurate staging greatly facilitates medical management and improves clinical outcomes. To further explore whether some of these differential lipids species were associated with pathological staging, we investigated the 20 differential metabolites that discriminate between early stages (I and II) and advanced stages (III and IV) and found 12 metabolites were staging-related. All GPs including PC, PE and LPC were negatively associated with pathological stage, while SMs and Cers were positively associated with pathological stages. Changing patterns of differential lipids from control across early stage and advanced stage (Figure 2).
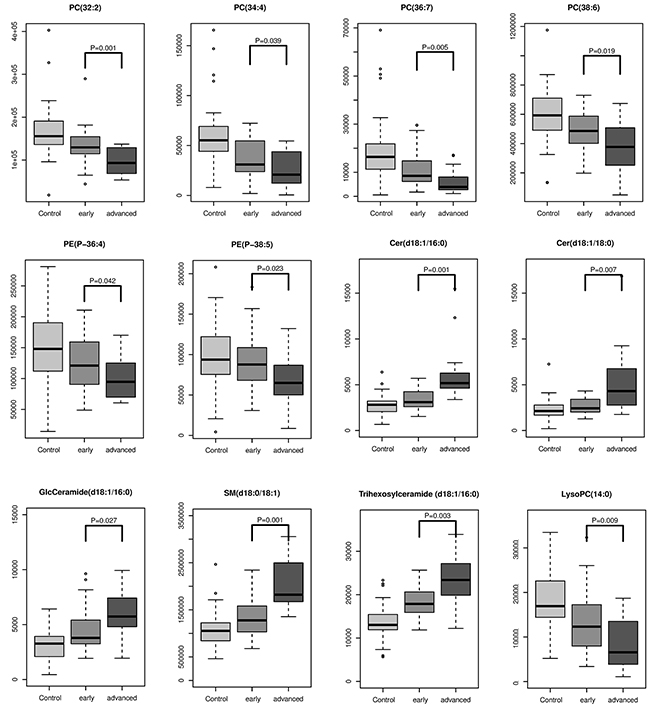
Figure 2: The intensity levels of lipids associated with pathological staging.
DISCUSSION
Lipidomics, a specific component of metabolomics, participates in constructing cell membranes, storing energy, cell differentiation and cell signaling. In the current study, a UPLC/MS plasma lipidomics method was used to systematically investigate dysregulated lipid metabolism between OSCC patients and matched normal controls. Our results suggest that the plasma lipid profiles analyzed by UPLC-QTOF/MS could be used to discriminate OSCC from controls. Twenty potential lipids are grouped into PCs, PEs, PG, Lyso-PC, Cer and SMs and related with OSCC. In addition, twelve lipids associated with pathological staging could be used for the early diagnosis of OSCC. These results suggested that these differentially expressed lipid species could reflect the development and progression of OSCC. However, dynamic alterations of differentially expressed lipid species and large-scale cohort studies should be needed to provide more accurate information for OSCC mechanism and early diagnosis in clinical practice.
All identified glycerphospholipids consisting of Lyso PCs, PCs, PEs and PGs in current study were decreased in OSCC patients compared to controls. We found that LysoPC(14:0) had a step-wise decrease with the development and progression of OSCC. As we know, LysoPC is an important signaling molecule in regulating cellular proliferation, inflammation and cancer cell invasion [23] and it is catalyzed by lysophospholipase D and generated lysophosphatidic acid (LPA), which is an important extracellular signaling molecule that controls various cell activities such as cell division and cell movement [24]. Lysophospholipase D has been reported to increase in several cancers, such as breast, prostate and ovarian cancers [25–27]. These results might partly explain the possible mechanism for the decreased plasma LysoPC levels in OSCC patients.
PC, as the main plasma membrane phospholipids, accounts for approximately 50% of total cellular phospholipids and is the most abundant phospholipids in mammalian membranes [28]. In present study, nine polyunsaturated PCs were differentially expressed between OSCC patients and controls and four of them had a step-wise decrease with the development and progression of OSCC, namely PC(32:2), PC(34:4), PC(36:7) and PC(36:6). A previous study showed that significant differences in serum levels of PC and fatty acids between advanced prostate cancer cases and controls [29]. Yin et al. utilized PC combined with LysoPC to predict the occurrence of cervical cancer and got an AUC value of 0.97 [30]. Uchiyama et al. identified PC(16:0/16:1) and PC(18:1/20:4) could discriminate the border between the cancer and stromal regions of OSCC [31]. Studies indicated that the phosphatidylethanolamine N-methyltransferase (PEMT) pathway is one way to synthesize PC [32], which occurs primarily in the liver via the conversion of PE to PC to satisfy the normal cellular requirement for membrane synthesis [33]. PEMT activity was decreased in cancers [18, 34], which might lead to lower levels of polyunsaturated PCs [35]. These findings suggest that reduced polyunsaturated PCs might result from lower PEMT activity during OSCC progression.
PE is the second most abundant phospholipids in mammalian membranes and contributes 20-30% to the total phospholipids content and is essential for the growth and stability of energy-producing organelles. Recent evidence indicates that plasmalogen phospholipids are particularly sensitive to oxidation and may possess antioxidative properties. It has been reported that plasmalogens had protective qualities against oxidative stress in cells [36]. The decreased pPE level in OSCC patients suggested that cancer cells might exhibit elevated oxidative stress. Two of pPEs, PE(P-36:4) and PE(P-38:5), had step-wise decrease with the development and progression, which was consistent with previous findings that oxidative stress was associated with cancer progression [37].
Five sphingolipids were increased in OSCC patients compared to normal controls. Bioactive sphingolipid metabolites served as an important lipid second messengers in the regulation of tumor cell growth, differentiation and angiogenesis [38], which were composed of hydrophilic head groups, such as sphingomyelin (SM), ceramide-1-phosphate and glucosylceramide (GlcCer) [39]. Ceramideis thought to be induce death, growth inhibition and senescence in cancer cells and can be synthesized through multiple different pathways within the cell. It could be catalyzed the conversion of sphingosine to sphingosine 1-phosphate (S1P) by sphingosine kinases (SPHKs). S1P is usually considered to promote the survival of cells [40, 41]. In recent years, many efforts have been made to elucidate the molecular signaling pathways by which ceramide and S1P cause their effect and these studies also reveal important roles for ceramide and S1P across cancers [42]. Ceramide regulation is increasingly implicated in cancer pathogenesis and prognosis. SM has been reported to participate in many cellular processes, such as promoting cell proliferation and differentiation. If SM is produced under physiological and pathological conditions, it can activate various signaling cascades. Guo et al. identified that SM associated with the lungs cancer progressions [43]. Sphingolipid metabolism plays a number of key roles in the response of cancer to therapy. Translating the scientific principles of sphingolipid metabolism in to realistic strategies would improve the cancer treatment outcomes.
In summary, we found that that the OSCC patients and control groups can be discriminated based on lipid profiling and the differential analysis of OSCC patients and controls is remarkable. Furthermore, the lipids associated with pathological staging were identified. The results may provide additional information on lipid metabolism in OSCC that allows us to more deeply understand oncogenesis. These findings also have potential clinical utility in the future if confirmed in larger studies.
MATERIALS AND METHODS
Hypothesis
We hypothesize that OSCC patients have distinct lipid profiles that reflect the disease progression and that these distinctive lipid profiles influence lipid homeostasis, which is reflected in the plasma. Therefore, determining the concentrations of specific lipids would reflect the existence and progression of OSCC. By comparing the plasma concentrations of lipids among populations with and without cancer or among those with different stages of OSCC, a few lipids that are most representative of the disease status would be identified as plasma lipid biomarkers in the diagnosis of OSCC.
Sample collection
Patients were consecutively and prospectively included in the study when admitted for surgery for a clinically suspicious malignant OSCC at the Department of Oral and Maxillofacial Surgery, The Affiliated Second Hospital of Harbin Medical University, Harbin, Heilongjiang Province, China, from March 2013 to July 2015. The inclusion and exclusion criteria for participants and the sample collection procedures were described as follows: participants involved in this study were not taking any medications, and those suffering from metabolic diseases, liver diseases, kidney diseases or any other types of cancer were excluded. The blood samples for biomarker measurements were obtained by routine venipuncture prior to surgery. Samples were maintained at room temperature during transportation and then centrifuged within 30 minutes after collection. The isolated plasma samples were stored at -80°C for further analysis. This study was approved by the Ethics Committee of the second hospital of Harbin Medical University.
Sample preparation
All the plasma samples were thawed at 4°C, and 30 μl of plasma was then mixed with 90 μl of precooled methanol. Next, 300 μl of methyl tert-butyl ether (MTBE) was added to the mixture, which was oscillated at 1000 rpm in 25°C for 1 hour, followed by the addition of 75 μl of deionized water. The samples were then mixed by vortexing for 1 min and oscillated at 1000 rpm for 10 min at 4°C, followed by centrifugation at 12000PM. A total of 240 μl from the upper layer was transferred into a clear vial and dried in a vacuum rotary dryer. The residue was dissolved in 100 μl of a 50/50 (v/v) solution of isopropanol/methanol for analysis. To ensure the stability and repeatability of the UPLC-MS, a total of 15 QC samples were prepared and used in this study. Pooled QC samples were prepared by mixing samples from 15 OSCC patients, 50 normal subjects. The preparation of the QC sample was the same as that was for the experimental samples.
Chromatography
A 5 μl aliquot of the pre-treated sample was injected into a Kinetex Core-shell Silica C18 2.1 mm×50 mm, 1.3 μm column (Phenomenex, Torrance, CA, USA) on a UPLC system (Waters, Milford, USA). The mobile phase consisted of 10/90 (v/v) acetonitrile/isopropanol (solvent A) and 60/40 (v/v) acetonitrile/deionized water (solvent B). The flow rate was set at 0.26 ml/min with a column temperature of 40°C.
A linear mobile phase gradient was used as follows: 10% A, held for 1 min; 1.0–8.0 min, increased to 30% A; 8.0–18.0 min, increased to 75% A; 18.0–20.0 min, increased to 97% A; 20.0–24.0 min, maintained at 97% A; 24.0–25.0 min, decreased to 10% A; and 25.0-26.4 min, held at 10% A. After each analytical run, the mobile phase was returned to 1% A in 0.1 min and equilibrated at 1% A for 1 min. To minimize the analytical variation, all the samples were randomly analyzed in succession. In addition, QC samples were analyzed at the beginning and the end of each batch run to ensure stability during analysis.
Mass spectrometry
Data acquisition was performed with an Agilent 6520-QTOF instrument (Agilent Technologies) equipped with an electrospray ionization source operating in ESI+ mode. The capillary voltage was 4.0 kV. Nitrogen was used as the dry gas, and the desolvation gas flow was set at 10 L/min. The desolvation temperature was set at 330°C. Centroid data were collected in the full scan mode from 50 to 1000 m/z.
Data preprocessing and annotation
Raw data were converted into mzdata-format files using MassHunter Qualitative Analysis Software (Agilent Technologies), and these files were then imported into the XCMS package in the R platform for preprocessing. The following parameters were set as default values in the XCMS function: xcmsSet (method=“centWave”, peakwidth5c (5, 20)); group (bw5); rector (method5“obiwarp”). The preprocessing results generated a data matrix that consisted of the retention time (RT), mass-to-charge ratio (m/z) values, and peak intensity. The CAMERA package in R was used to annotate isotope peaks, adducts and fragments in the peak lists. Isotopic peaks were excluded prior to statistical analysis.
Statistical analysis
The continuous variables in patients with OSCC and the controls were presented as the median and range, whereas the categorical variables were presented as a frequency for each category. PCA was performed to determine the detection of stability and the replication. To visualize the discrimination performance of the lipid profiling between OSCC and controls, we performed PLS-DA with mean centering and unit variance scaling of each variable. The parameters of the model, such as R2Y and Q2, were analyzed to avoid the risk of over-fitting. The differences in the concentrations of lipids in patients with OSCC and controls were compared using the Wilcoxon rank-sum test. To account for the multiple test issue, lfdr, which was calculated with the R package “fdrtool”. Multivariate VIP values were calculated for each variable. The potential biomarkers were selected based on the criteria of lfdr<0.05 and VIP>1. To facilitate the clinical utility of these potential biomarkers for future clinical practice, we utilized Student’s t-test to select the staging related lipids used for early diagnosis. The intensity of lipids associated with pathological staging is presented using a box plot. Statistical analysis was performed in the R platform.
Abbreviations
OSCC: oral squamous cell carcinoma; UPLC-MS: ultra-performance liquid chromatography mass spectrometry; LN: lymph node; SCCA: serum squamous cell carcinoma antigen; PC: phosphatidylcholines; GPs: glycerphospholipids; PEs: glycerophosphoethanolamines; PG: glycerophosphoglycerols; Lyso-PC: lyso-glycerophosphocholines; SPs: sphingolipids; Cers: ceramides SMs: sphingomyelins; pPEs: PEs with plasmalogen; LPA: lysophosphatidic acid; PEMT: phosphatidylethanolamine N-methyltransferase; SM: sphingomyelin; GlcCer: ceramide-1-phosphate and glucosylceramide; S1P: sphingosine 1-phosphate; SPHKs: sphingosine kinases; QC: quality control; ESI: electrospray ionization; ROC: receiver operating characteristic; m/z: measured mass to charge ratio; RT: retention time.
Author contributions
LW, CL and BZ designed the experiments; LW and XW drafted the manuscript; YL, collected the plasma samples; XW, YL performed the experiment; YH and FS analyzed the experimental data. YH and SZ contributed to metabolite identification and biological interpretation.
ACKNOWLEDGMENTS
No applicable.
CONFLICTS OF INTEREST
The authors have no conflicts of interest to declare.
FUNDING
This work was supported by National Natural Science Foundation of China(Grant No.81570951) and The Special Foundation for Sino-Russian Translational Medicine Research Center of Harbin Medical University(Grant No. CR201412).
REFERENCES
1. Bloebaum M, Poort L, Bockmann R, Kessler P. Survival after curative surgical treatment for primary oral squamous cell carcinoma. J Craniomaxillofac Surg. 2014; 42:1572-1576.
2. Sklenicka S, Gardiner S, Dierks EJ, Potter BE, Bell RB. Survival analysis and risk factors for recurrence in oral squamous cell carcinoma: does surgical salvage affect outcome? J Oral Maxillofac Surg. 2010; 68:1270-1275.
3. Jemal A, Bray F, Center MM, Ferlay J, Ward E, Forman D. Global cancer statistics. CA Cancer J Clin. 2011; 61:69-90.
4. Gallo C, Ciavarella D, Santarelli A, Ranieri E, Colella G, Lo Muzio L, Lo Russo L. Potential salivary proteomic markers of oral squamous cell carcinoma. Cancer Genomics Proteomics. 2016; 13:55-61.
5. Czerninski R, Basile JR, Kartin-Gabay T, Laviv A, Barak V. Cytokines and tumor markers in potentially malignant disorders and oral squamous cell carcinoma: a pilot study. Oral Dis. 2014; 20:477-481.
6. Kim KY, Zhang X, Cha IH. Combined genomic expressions as a diagnostic factor for oral squamous cell carcinoma. Genomics. 2014; 103:317-322.
7. Urbanczyk-Wochniak E, Luedemann A, Kopka J, Selbig J, Roessner-Tunali U, Willmitzer L, Fernie AR. Parallel analysis of transcript and metabolic profiles: a new approach in systems biology. EMBO Rep. 2003; 4:989-993.
8. Mukherjee PK, Funchain P, Retuerto M, Jurevic RJ, Fowler N, Burkey B, Eng C, Ghannoum MA. Metabolomic analysis identifies differentially produced oral metabolites, including the oncometabolite 2-hydroxyglutarate, in patients with head and neck squamous cell carcinoma. BBA Clin. 2017; 7:8-15.
9. Shin JM, Kamarajan P, Fenno JC, Rickard AH, Kapila YL. Metabolomics of head and neck cancer: a mini-review. Front Physiol. 2016; 7:526.
10. Hannun YA, Obeid LM. Principles of bioactive lipid signalling: lessons from sphingolipids. Nat Rev Mol Biol. 2008; 9:139-150.
11. Zechner R, Zimmermann R, Eichmann TO, Kohlwein SD, Haemmerle G, Lass A, Madeo F. FAT SIGNALS--lipases and lipolysis in lipid metabolism and signaling. Cell Metab. 2012; 15:279-291.
12. Krycer JR, Sharpe LJ, Luu W, Brown AJ. The Akt-SREBP nexus: cell signaling meets lipid metabolism. Trends Endocrinol Metab. 2010; 21:268-276.
13. Jove M, Ayala V, Ramirez-Nunez O, Serrano JC, Cassanye A, Arola L, Caimari A, Del Bas JM, Crescenti A, Pamplona R, Portero-Otin M. Lipidomic and metabolomic analyses reveal potential plasma biomarkers of early atheromatous plaque formation in hamsters. Cardiovasc Res. 2013; 97:642-652.
14. Zhou X, Mao J, Ai J, Deng Y, Roth MR, Pound C, Henegar J, Welti R, Bigler SA. Identification of plasma lipid biomarkers for prostate cancer by lipidomics and bioinformatics. PLoS One. 2012; 7:e48889.
15. Roberg-Larsen H, Lund K, Vehus T, Solberg N, Vesterdal C, Misaghian D, Olsen PA, Krauss S, Wilson SR, Lundanes E. Highly automated nano-LC/MS-based approach for thousand cell-scale quantification of side chain-hydroxylated oxysterols. J Lipid Res. 2014; 55:1531-1536.
16. Guo S, Wang Y, Zhou D, Li Z. Significantly increased monounsaturated lipids relative to polyunsaturated lipids in six types of cancer microenvironment are observed by mass spectrometry imaging. Sci Rep. 2014; 4:5959.
17. Fhaner CJ, Liu S, Ji H, Simpson RJ, Reid GE. Comprehensive lipidome profiling of isogenic primary and metastatic colon adenocarcinoma cell lines. Anal Chem. 2012; 84:8917-8926.
18. Chen S, Yin P, Zhao X, Xing W, Hu C, Zhou L, Xu G. Serum lipid profiling of patients with chronic hepatitis B, cirrhosis, and hepatocellular carcinoma by ultra fast LC/IT-TOF MS. Electrophoresis. 2013; 34:2848-2856.
19. Gorke R, Meyer-Base A, Wagner D, He H, Emmett MR, Conrad CA. Determining and interpreting correlations in lipidomic networks found in glioblastoma cells. BMC Syst Biol. 2010; 4:126.
20. Min HK, Lim S, Chung BC, Moon MH. Shotgun lipidomics for candidate biomarkers of urinary phospholipids in prostate cancer. Anal Bioanal Chem. 2011; 399:823-830.
21. Ke C, Hou Y, Zhang H, Fan L, Ge T, Guo B, Zhang F, Yang K, Wang J, Lou G, Li K. Large-scale profiling of metabolic dysregulation in ovarian cancer. Int J Cancer. 2015; 136:516-526.
22. Fan L, Zhang W, Yin M, Zhang T, Wu X, Zhang H, Sun M, Li Z, Hou Y, Zhou X, Lou G, Li K. Identification of metabolic biomarkers to diagnose epithelial ovarian cancer using a UPLC/QTOF/MS platform. Acta Oncol. 2012; 51:473-479.
23. Barber MN, Risis S, Yang C, Meikle PJ, Staples M, Febbraio MA, Bruce CR. Plasma lysophosphatidylcholine levels are reduced in obesity and type 2 diabetes. PLoS One. 2012; 7:e41456.
24. Brindley DN. Lipid phosphate phosphatases and related proteins: signaling functions in development, cell division, and cancer. J Cell Biochem. 2004; 92:900-912.
25. Liu S, Umezu-Goto M, Murph M, Lu Y, Liu W, Zhang F, Yu S, Stephens LC, Cui X, Murrow G, Coombes K, Muller W, Hung MC, et al. Expression of autotaxin and lysophosphatidic acid receptors increases mammary tumorigenesis, invasion, and metastases. Cancer Cell. 2009; 15:539-550.
26. Nakamura K, Takeuchi T, Ohkawa R, Okubo S, Yokota H, Tozuka M, Aoki J, Arai H, Ikeda H, Ohshima N, Kitamura T, Yatomi Y. Serum lysophospholipase D/autotaxin may be a new nutritional assessment marker: study on prostate cancer patients. Ann Clin Biochem. 2007; 44:549-556.
27. Hou Y, Li J, Xie H, Sun F, Yang K, Wang J, Ke C, Lou G, Li K. Differential plasma lipids profiling and lipid signatures as biomarkers in the early diagnosis of ovarian carcinoma using UPLC-MS. Metabolomics. 2015; 12:18.
28. Bandu R, Mok HJ, Kim KP. Phospholipids as cancer biomarkers: mass spectrometry-based analysis. Mass Spectrom Rev. 2016.
29. Mondul AM, Moore SC, Weinstein SJ, Karoly ED, Sampson JN, Albanes D. Metabolomic analysis of prostate cancer risk in a prospective cohort: the alpha-tocolpherol, beta-carotene cancer prevention (ATBC) study. Int J Cancer. 2015; 137:2124-2132.
30. Yin MZ, Tan S, Li X, Hou Y, Cao G, Li K, Kou J, Lou G. Identification of phosphatidylcholine and lysophosphatidylcholine as novel biomarkers for cervical cancers in a prospective cohort study. Tumour Biol. 2016; 37:5485-5492.
31. Uchiyama Y, Hayasaka T, Masaki N, Watanabe Y, Masumoto K, Nagata T, Katou F, Setou M. Imaging mass spectrometry distinguished the cancer and stromal regions of oral squamous cell carcinoma by visualizing phosphatidylcholine (16:0/16:1) and phosphatidylcholine (18:1/20:4). Anal Bioanal Chem. 2014; 406:1307-1316.
32. Vance DE, Walkey CJ, Cui Z. Phosphatidylethanolamine N-methyltransferase from liver. Biochim Biophys Acta. 1997; 1348:142-150.
33. Tessitore L, Cui Z, Vance DE. Transient inactivation of phosphatidylethanolamine N-methyltransferase-2 and activation of cytidine triphosphate: phosphocholine cytidylyltransferase during non-neoplastic liver growth. Biochem J. 1997; 322:151-154.
34. Tessitore L, Marengo B, Vance DE, Papotti M, Mussa A, Daidone MG, Costa A. Expression of phosphatidylethanolamine N-methyltransferase in human hepatocellular carcinomas. Oncology. 2003; 65:152-158.
35. Zinrajh D, Horl G, Jurgens G, Marc J, Sok M, Cerne D. Increased phosphatidylethanolamine N-methyltransferase gene expression in non-small-cell lung cancer tissue predicts shorter patient survival. Oncol Lett. 2014; 7:2175-2179.
36. Liu D, Nagan N, Just WW, Rodemer C, Thai TP, Zoeller RA. Role of dihydroxyacetonephosphate acyltransferase in the biosynthesis of plasmalogens and nonether glycerolipids. J Lipid Res. 2005; 46:727-735.
37. Cifkova E, Holcapek M, Lisa M, Vrana D, Melichar B, Student V. Lipidomic differentiation between human kidney tumors and surrounding normal tissues using HILIC-HPLC/ESI-MS and multivariate data analysis. J Chromatog B Analyt Technol Biomed Life Sci. 2015; 1000:14-21.
38. Oskouian B, Saba JD. Cancer treatment strategies targeting sphingolipid metabolism. Adv Exp Med Biol. 2010; 688:185-205.
39. Arana L, Gangoiti P, Ouro A, Trueba M, Gomez-Munoz A. Ceramide and ceramide 1-phosphate in health and disease. Lipids Health Dis. 2010; 9:15.
40. Xu Y, Xiao YJ, Baudhuin LM, Schwartz BM. The role and clinical applications of bioactive lysolipids in ovarian cancer. J Soc Gynecol Investig. 2001; 8:1-13.
41. Sutphen R, Xu Y, Wilbanks GD, Fiorica J, Grendys EC Jr, LaPolla JP, Arango H, Hoffman MS, Martino M, Wakeley K, Griffin D, Blanco RW, Cantor AB, et al. Lysophospholipids are potential biomarkers of ovarian cancer. Cancer Epidemiol Biomarkers Prev. 2004; 13:1185-1191.
42. Pyne NJ, Pyne S. Sphingosine 1-phosphate and cancer. Nat Rev Cancer. 2010; 10:489-503.
43. Guo Y, Wang X, Qiu L, Qin X, Liu H, Wang Y, Li F, Wang X, Chen G, Song G, Li F, Guo S, Li Z. Probing gender-specific lipid metabolites and diagnostic biomarkers for lung cancer using Fourier transform ion cyclotron resonance mass spectrometry. Clin Chim Acta. 2012; 414:135-141.