
INTRODUCTION
Lung cancer is still the leading cause of cancer-related death worldwide [1]. Small cell lung cancer (SCLC) accounts for 15-20% of all lung cancer cases and is characterized by an aggressive disease progression [2, 3]. It is often diagnosed at a late stage with frequent metastases [4]. Although SCLC reacts highly sensitive to chemo- and radiotherapy at the initial treatment step, most patients develop a tumor relapse, resulting in a poor median survival period of 9-12 months [5, 6]. The high mortality rate of those patients is due to acquired chemotherapy resistance [7]. Thus, novel therapeutics strategies targeting resistance mechanisms are urgently needed.
In this context, the proteasome inhibitor bortezomib is becoming more and more important due to a remarkable power in re-sensitization of resistant tumors combined with relatively low side effects [8]. Bortezomib (Velcade, formerly PS-341) is a highly selective inhibitor of the 26S proteasome [9]. It is the first proteasome inhibitor approved by the US FDA and EU CPMP for the treatment of patients diagnosed with relapsed/refractory multiple myeloma [10, 11]. By inducing multiple mechanisms, bortezomib displays antiproliferative, proapoptotic, and antiangiogenic properties [12]. Along this line, bortezomib induces NF-kappaB inhibition leading to apoptosis of various cancer cells and sensitizing them to chemotherapy and radiotherapy [13–15]. NF-kappaB is highly overexpressed in SCLC cells and is correlated with the development of chemoresistance [16]. Thus, particularly in addition to standard chemotherapy, a proteasome inhibition may abrogate chemoresistance and maintain a promising outcome in SCLC treatment.
Moreover, bortezomib and other proteasome inhibitors, such as the clinically undocumented but experimentally used proteasome inhibitor siomycin A, were also shown to induce apoptosis of cancer cells by inhibiting the activity and overexpression of Mammalian Forkhead box M1 (FOXM1) [17]. FOXM1 belongs to the forkhead superfamily of transcription factors and as such facilitates cell differentiation, proliferation, invasion, and metastatic dissemination [18]. Multiple downstream targets, such as cyclin A/B, cdc25B, aurora A/B, survivin, and Ki-67 directly determine cell survival and mitosis, whereas the degradation of the CDK inhibitors p27 and p21 attenuates apoptosis [19–24]. Hence, FOXM1 also increases resistance to oxidative stress, DNA damage, and apoptosis [25]. In the context of cell proliferation, FOXM1 drives G1–S and G2–M transition of the cell cycle [21]. Furthermore, FOXM1 has been implicated in angiogenesis by triggering the VEGF-dependent angiogenic switch and in invasion by triggering MMP-2 and MMP-9 release [26–28]. Overexpression of FOXM1 is associated with poor prognosis of lung cancer patients [29–31]. These facts imply that FOXM1 may play a pivotal role in SCLC progression. Whether FOXM1 plays a role in development of chemoresistance in patients and thus may represent an attractive target in SCLC therapy remains unknown. Here we investigated the effect of bortezomib on FOXM1 expression and thus in SCLC therapy. Treatment of chemoresistant SCLC cells with proteasome inhibitors suppressed NF-kappaB and FOXM1 activity, induced cell cycle arrest and apoptosis and in line with this reduced cell proliferation. In a xenograft mouse model treatment with bortezomib potently enhanced the effect of standard chemotherapy. Our findings underscore the potential of proteasome inhibitor bortezomib as re-sensitizing agent in combination with standard therapy.
RESULTS
SCLC cells express neuroendocrine markers
In order to determine the characteristic features of SCLC cells we analyzed the expression of neuroendocrine and differentiation markers. Both SCLC cell lines NCI-H2171 and NCI-H69 showed expression of the neuroendocrine markers chromogranin A and synaptophysin (Figure 1). In contrast, the non-neuroendocrine NSCLC cell line A549, used as a control, was completely negative for these neuroendocrine markers. Compared to the control cell line, the expression of vimentin was very low in both SCLC cell lines NCI-H2171 and NCI-H69, indicating a less mesenchymal (dedifferentiated) phenotype.
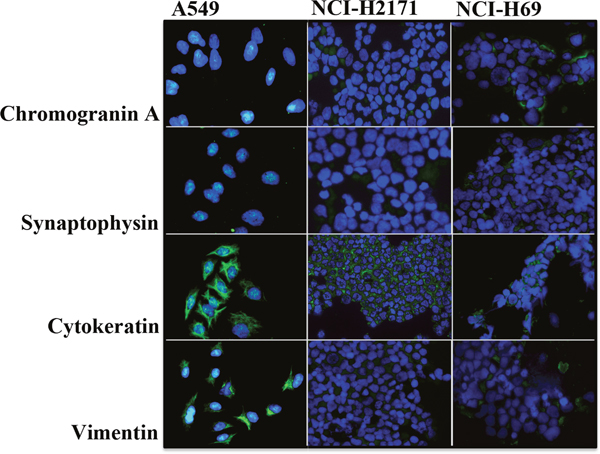
Figure 1: SCLC cells exhibit a characteristic expression of neuroendocrine and differentiation markers. Representative immunofluorescence images demonstrate expression of the markers chromogranin (A), synaptophysin, cytokeratin and vimentin by neuroendocrine SCLC cell lines NCI-H2171 and NCI-H69 in comparison to the non-neuroendocrine NSCLC cell line NCI-A549 (200 x magnification).
Nuclear FOXM1 localization in patient-derived SCLC samples is associated with increased Ki-67 expression
To prove a clinical relevance of FOXM1 in SCLC progression we analyzed FOXM1 expression in 123 patient-derived SCLC samples performing immunohistochemical staining and compared it to other lung cancer entities. We could demonstrate that FOXM1 was strongly expressed in SCLC (Figure 2). High immunoreactivity for nuclear FOXM1 was detected in 47.3% (58/123) of the SCLC samples, whereas only 29.4% (5/17) of the atypical carcinoid (ATC) samples and 9.1% (1/11) of the typical carcinoid (TC) samples were positively stained for nuclear FOXM1. Thus, nuclear FOXM1 expression was related to the aggressiveness of the neuroendocrine lung cancer entity (p=0.026). Additionally, we demonstrated that the FOXM1 cytosolic localization score was strictly opposite to the nuclear FOXM1 score determined. Concerning cytosolic localization, we found that 69.9% (86/123) of the SCLC samples were positive, whereas 96.4% (27/28) of carcinoid samples were immunoreactive for inactive FOXM1 in the cytoplasm (p=0.004). Cytosolic FOXM1 is thus lower in SCLC than in BP-NET. A cytosolic FOXM1 immunoreactivity does not exclude a nuclear FOXM1 presence in the same case. It only indicates a detectable percentage of inactive (nuclear excluded) FOXM1. Nuclear FOXM1 localization is associated with increased aggressiveness of tumors. Consequently, both scores were related complementary to each another, indicating, that FOXM1 nuclear shuttling rather than total FOXM1 expression determines its biological activity.
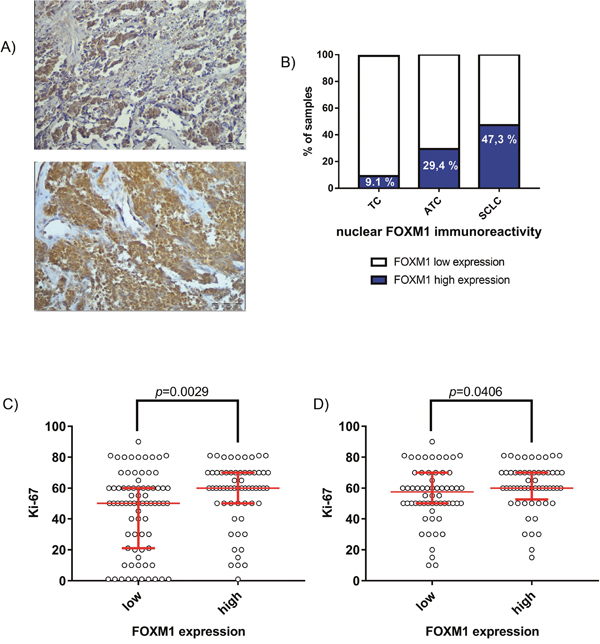
Figure 2: Expression of FOXM1 in patient-derived SCLC samples. (A) Immunohistochemistry of FOXM1 demonstrated a high percentage of strong nuclear FOXM1 expression in SCLC (58/123; 47.3%). Representative pictures of SCLC show strong nuclear FOXM1 expression (upper panel) or strong immunoreactivity in both, cytoplasm and nucleus (lower panel). Light microscopy, 200x magnification (scale bar=500μm). (B) Compared to the well-differentiated carcinoid entities ATC (5/17; 29.4%) and TC (1/11; 9.1%), SCLC samples show enhanced nuclear FOXM1 expression (p=0.026). (C) Nuclear FOXM1 expression was associated with high Ki-67 index in all analyzed neuroendocrine lung cancers in general (p=0.0029) and (D) in SCLC in particular (p=0.0406).
Most notably, FOXM1 nuclear immunoreactivity was strongly associated with the clinical proliferation marker Ki-67. This effect was significant throughout all analyzed lung NET entities (p=0.0029) as well as for SCLC in particular (p=0.0406).
Treatment with proteasome inhibitors suppresses proliferation of SCLC cells
In order to identify the role of FOXM1 in SCLC progression we analyzed the effect of the proteasome inhibitors bortezomib and siomycin A on cell proliferation of SCLC. Both inhibitors are known to potently suppress expression of FOXM1 [17]. The cells were treated with different concentrations of bortezomib (ranging between 0.001 μM and 1 μM) and siomycin A (ranging between 0.1 μM and 5 μM) for 24 h and 48 h. The proliferation rate of treated cells was quantified using WST-1 viability assay. Previously, the IC50 values of both inhibitors were determined to persist within the nanomolar range (Supplementary Figure 1 and 2). Both SCLC cell lines showed strong sensitivity to FOXM1 inhibition (Figure 3). Bortezomib suppressed cell proliferation in a time- and concentration-dependent manner. Compared to the control cell line A549, bortezomib treatment achieved up to 46-fold higher efficiency in SCLC cells. Already low concentrations of bortezomib (0.05 μM) showed 80-90% reduction in cell viability in SCLC cells. Even the prolonged treatment of control A549 cells (72 h) showed no improvement in bortezomib efficiency. Suppression of SCLC cell viability upon siomycin A treatment was similar to bortezomib treatment. Already low concentrations of siomycin A (0.5 μM) reduced cell viability of SCLC cells to <50%. The viability of the control A549 cells was reduced to ~70%. Nevertheless, on control A549 cells siomycin A showed an increased inhibitory effect than bortezomib.
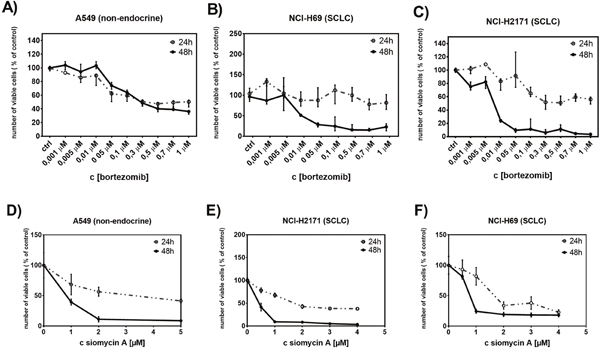
Figure 3: Treatment with bortezomib or siomycin A suppresses SCLC cell proliferation. The antiproliferative effect of bortezomib (0.001 μM to 1μM) or siomycin A (0.1μM to 5μM) on SCLC cells was quantified using WST-1 viability assay. Both, bortozomib and siomycin A treatments (for 24h and 48h) reduced the number of viable SCLC cells in a time and concentration-dependent manner (B, C, E, F). The effect of bortezomib and siomycin A on the control A549 cells was less effective (A, D).
Treatment with proteasome inhibitors induces cell cycle arrest and apoptosis of SCLC cells
In order to clarify the effect of proteasome inhibitors on cell proliferation, we analyzed the cell cycle of treated cells using a mitotic index flow cytometry analysis. The cells were treated for 48h with bortezomib or siomycin A. In all cell lines treatment with bortezomib or siomycin A significantly reduced the mitotic cell population detected by phosphorylated histone H3 (pH3) staining (Figure 4). In accordance to the cell cycle arrest at the G2-M transition state both inhibitors significantly increased G2-phase population in SCLC cells. Compared to the control A549 cells, bortezomib decreased S-phase population in both SCLC cell lines (A-C). Treatment with siomycin A decreased S-phase only in NCI-H69 cells (F). In addition to cell cycle arrest, bortezomib induced apoptosis in all cell lines (right lower graphs (A-C)).
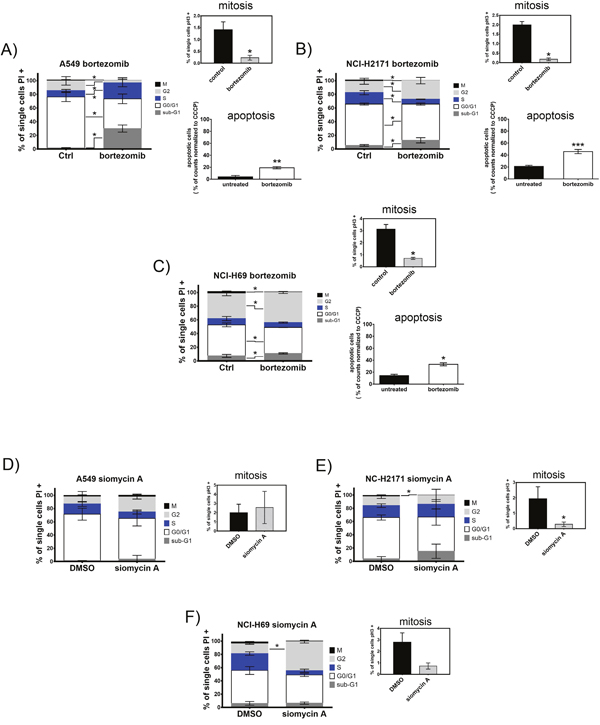
Figure 4: Treatment with bortezomib or siomycin A induces cell cycle arrest and apoptosis of SCLC cells. SCLC cell lines NCI-H69 and NCI-H2171 were treated with bortezomib (0.05 μM; 0.5 μM) or siomycin A (0.8 μM; 0.15 μM) and compared to the control A549 cells treated with 1.5 μM bortezomib or 1 μM siomycin A. Cell cycle stages are shown as percentage of cells compared to all analyzed cells. Mitotic index was analyzed separately by phospho-histone H3 immunoreactivity and displayed as percentage of mitotic cells in respect to all analyzed cells. (A-F) Bortezomib as well as siomycin A induced cell cycle arrest at G2-M transition and apoptosis in SCLC cells after 48h. Treatment with both inhibitors decreased the M-population and increased the S-population in SCLC cells (representative graphs out of three independent experiments). Apoptosis was measured by JC-1 mitochondrial depolarization assay after 20h of treatment. All cell lines significantly induced apoptosis upon bortezomib treatment. *p<0.05; **p<0.01; ***p<0.001; ****p<0.0001.
Bortezomib enhances the effect of cisplatin-induced cell cycle arrest and apoptosis of SCLC cells
To further identify the effect of proteasome inhibitors on chemosensitivity of SCLC cells we analyzed the cell cycle feature of NCI-H69 cells treated with the combination of bortezomib and cisplatin. We concentrated on NCI-H69 cells as they were established from the human chemoresistant SCLC metastasis and thus represent the chemoresistant SCLC nature. Cells were treated with 10 nM (NCI-H69) and 100 nM (A549) bortezomib, 20 μM cisplatin, or a combination of both substances. Treatment of NCI-H69 cells induced predominantly G2/M arrest, resulting in a significant reduction of mitotic cells after combined treatment. Compared to cisplatin monotherapy, addition of bortezomib further enhanced G2/M arrest resulting in a significant reduction of mitotic cell population and increased G2 population (Figure 5). In contrast, the control cell line A549 displayed a stronger apoptotic response (indicated by sub G1), but the mitotic cell population only decreased significantly in the cisplatin monotherapy treatment group.
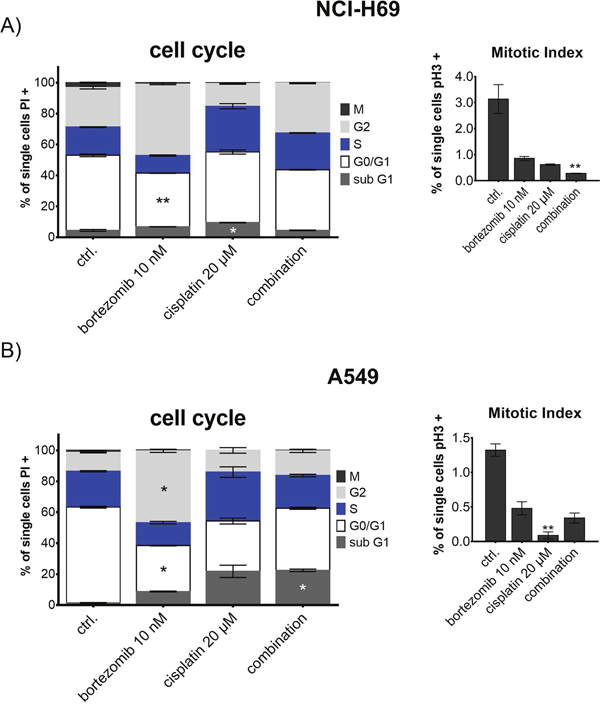
Figure 5: Cell cycle analysis of NCI-H69 and A549 after treatment with bortezomib and cisplatin. Cells were treated with 10 nM (NCI-H69) and 100 nM (A549) bortezomib, 20 μM cisplatin, or a combination of both substances for 48h. Cell cycle stages are shown as percentage of cells compared to all analyzed cells. Mitotic index was analyzed separately by phospho-histone H3 immunoreactivity and displayed as percentage of mitotic cells in respect to all analyzed cells. Treatment of NCI-H69 cells induced predominantly G2/M arrest, resulting in a significant reduction of mitotic cells after combined treatment. In contrast, the control cell line A549 displayed a stronger apoptotic response, but the mitotic cell population only decreased significantly in the cisplatin monotherapy treatment group. *p<0.05; **p<0.01; ***p<0.001; ****p<0.0001.
Treatment of SCLC cells with bortezomib affects FOXM1 signaling pathway at several levels
In order to identify the inhibitory mechanisms of bortezomib on chemoresistant SCLC cells we analyzed the expression of FOXM1 signaling partners in control and SCLC cells. Both, A549 and NCI-H69 cells were treated with bortezomib for 48 h and analyzed by immunoblotting for expression of FOXM1, FOXO3a, chromogranin A, NF-kappaB and p21-protein. FOXM1 and FOXO3a are known as antagonizing key players in cancer progression, proliferation and drug resistance [32]. Teatment with bortezomib showed no effects in control A549 cells but potently inhibited expression of both, FOXM1 and FOXO3a in SCLC cells (Figure 6). Similarly, bortezomib treatment reduced expression of the neuroendocrine marker chromogranin A and of the proliferation regulator NF-kappaB in SCLC. Moreover, treatment with bortezomib strongly enhanced expression of cyclin-dependent kinase inhibitor p21 that potently blocks cell-cycle progression in different cancer entities.
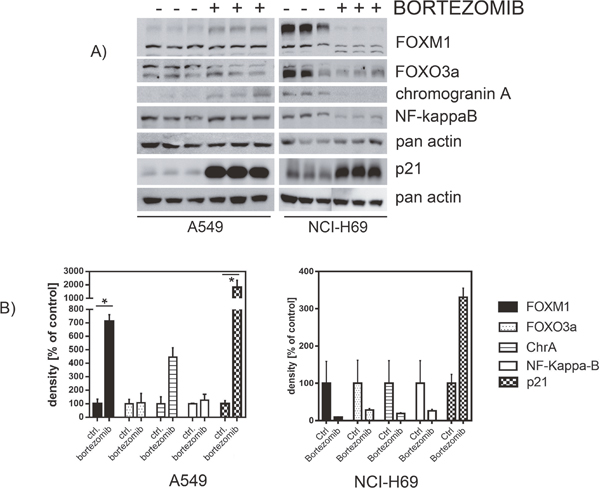
Figure 6: Western blot analysis revealed affected protein expression after treatment with bortezomib. SCLC cell line NCI-H69 and the A549 control cell line were treated with bortezomib for 48h (individual IC50). The levels of signaling partners FOXM1, FOXO3a, chromogranin A, p21, and NF-kaB were determined by immunoblotting and densitometrically compared to the untreated control. Treatment with bortezomib reduced the abundance of FOXM1, FOXO3a, chromogranin A, and NF-kB, but strongly enhanced p21 expression (unless not significant). Blots were cropped to improve the conciseness of the presentation.
Bortezomib in combination with cisplatin affects gene expression of NCI-H69 cells
To further identify the inhibitory mechanisms of bortezomib at the mRNA expression level, we analyzed the changes in gene expression of treated SCLC cells. NCI-H69 cells were treated with 50 nM bortezomib, 10 μM Cisplatin or a combination for 48h. The isolated mRNA was analyzed by the nCounter® PanCancer multiplex gene expression array (Nanostring® technologies). In bortezomib or cisplatin treated cells, apoptosis, transcription and cell cycle regulation were the most affected mechanisms (Figure 7A). Combination of bortezomib and cisplatin further enhanced this effect. Overall, the gene expression was predominantly affected in a negative way after combined treatment (Figure 7B). Whereas mainly proapoptotic genes were upregulated, antiapoptotic genes were downregulated (Figure 7C). Apoptosis was therefore induced, irrespective from the overall negative pathway score. The more detailed PANTHER pathway overrepresentation analysis (supplementary Figure 3C), demonstrates a strong overrepresentation (>15-fold) of genes involved in the p53 associated pathways as well as an overrepresentation of genes that regulate apoptosis and FAS signaling. The death receptor pathway of apoptosis induction, downstream of FAS is found affected only after combined treatment.
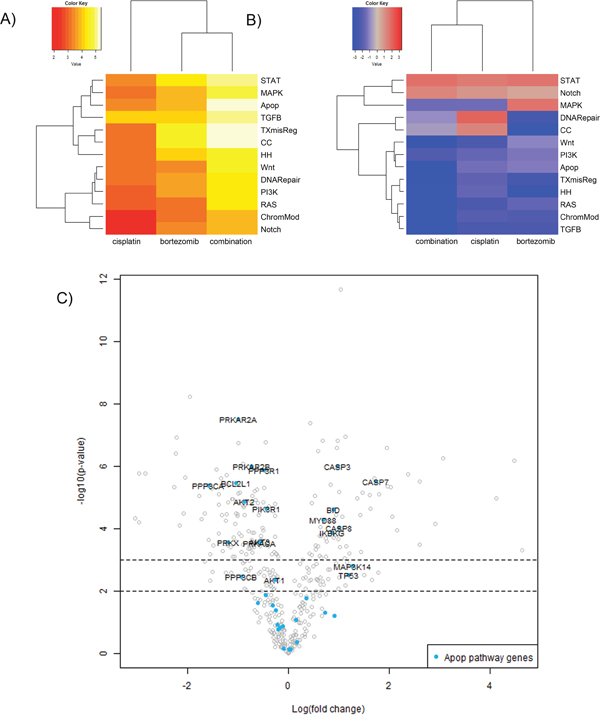
Figure 7: Gene expression analysis of NCI-H69 cells after treatment with cisplatin or bortezomib in vitro. NCI-H69 cells were treated with 50 nM bortezomib, 10 μM Cisplatin or a combination for 48h. The isolated mRNA was analyzed by the nCounter® PanCancer multiplex gene expression array (Nanostring® technologies). (A) The heatmap displays the global significance scores of pathways after treatment and indicates that apoptosis, transcriptional pathways and cell cycle regulation were the most affected mechanisms. (B) Directed global significance statistics measure the extent to which a pathway’s genes are up- or downregulated after treatment. Red denotes pathways whose genes exhibit extensive overexpression with the covariate, blue denotes pathways with extensive underexpression. The blue heatmaps denote that the gene expression is predominantly affected in a negative way after combined treatment. (C) The volcano plot demonstrates the functional specification: whereas mainly pro-apoptotic genes are upregulated, antiapoptotic genes are downregulated. Apoptosis is therefore induced, irrespective from the overall negative pathway score. Associated Pathways: STAT, PI3K, RAS, MAPK, Wnt, Notch, TGFB, DNA repair, Apop=apoptosis, TXmisReg=transcriptional misregulation, CC=cell cycle, TGFB=TGF-beta, ChromMod= chromatin remodeling, HH=Hedgehog.
To further explore the distinct role of FOXM1 in the cellular response to bortezomib, we performed a siRNA-mediated knockdown of FOXM1 and analyzed the gene expression pattern by a subsequent nCounter® array. FOXM1 knockdown resulted in reduced expression of SKP2, which is involved in the regulation of p21 and p27 [21] and in upregulated STAT1 expression, which is necessary for FAS induced apoptosis [33] (Supplementary Figure 4). Gene expression raw data can be found in Supplementary Tables 1-4.
Combination of bortezomib and cisplatin potently suppresses the growth of SCLC tumors in vivo
In the next step, we analyzed whether addition of bortezomib might improve the efficacy of standard chemotherapy. H69-Luc-GFP cells were injected subcutaneously into the right flanks of immunodeficient Rag2-/-γc-/- mice. Highly sensitive BL imaging was applied immediately after tumor injection enabling detection of very small non-palpable tumors. Tumor growth was then monitored using BLI on day 14 and day 28 after tumor injection. Treatment of mice started two weeks after tumor inoculation, at the timepoint where the palpable tumors were established. Tumor-bearing mice were randomized into four groups and treated with bortezomib or cisplatin as a monotherapry, or with a combination of both. Bortezomib was administered by intraperitoneal injection at a concentration of 1 mg/kg/day on days 14, 18, 21 and 25 after tumor inoculation. Cisplatin was administered by intraperitoneal injection at a concentration of 5 mg/kg/day on days 14 and 21 after tumor inoculation. In comparison to the control group, cisplatin or bortezomib as a monotherapy reduced the growth of the SCLC tumors by 58% or 54%, respectively (Figure 8). Combination of both therapeutics reduced the growth of tumors by 93% of the control volume (* = p < 0.05). Two out of 10 tumors were completely regressed in a combination treated group (Figure 8C, indicated by x).
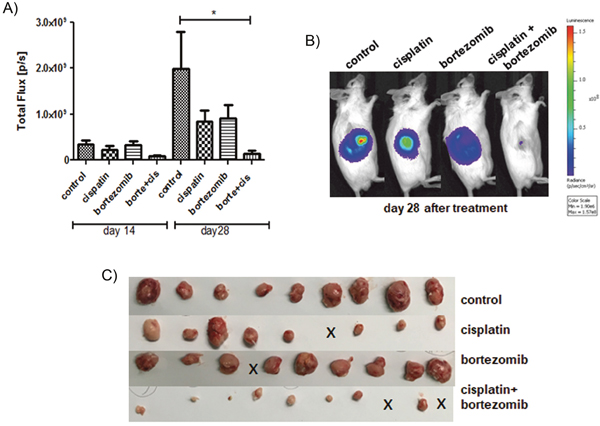
Figure 8: Addition of bortezomib enhances the antiproliferative effect of cisplatin in vivo. Tumor-bearing mice were treated with bortezomib (n=10) or cisplatin (n=9) as a monotherapy, or with a combination of both therapeutics (n=10) and compared to solvent treated controls (n=9). Cisplatin (5 mg/kg/day) was administered by intraperitoneal injection on days 14 and 21 following tumor injection. Bortezomib (1 mg/kg/day) was administered by intraperitoneal injection on days 14, 18, 21 and 25 following tumor injection. Cisplatin reduced the mean tumor BL signal (total flux p/s) by 58% and bortezomib reduced the mean tumor BL signal by 54%, respectively. Combination of both therapeutics reduced the mean BL signal by 93% of the control tumor (* = p < 0.05).
DISCUSSION
The current SCLC treatment remains limited to the combined chemotherapy of cisplatin/carboplatin and etoposide, which results in an unsatisfactory median survival time of 8 to 13 months [34–36]. Targeted therapy specifically developed for this tumor entity is still lacking. In order to improve the current SCLC therapy by targeting chemoresistance mechanisms we focused on the role of FOXM1 in SCLC progression. This study emphasizes FOXM1 as a crucial oncogene-like marker, which can be effectively targeted by the proteasome inhibitor bortezomib. Bortezomib as well as siomycin A successfully inhibited FOXM1 expression leading to a significantly reduced proliferation, decreased mitotic rate, cell cycle arrest and apoptosis. Treatment with cisplatin as a standard chemotherapy reduced the mean bioluminscence signal of tumors by 58%. Similar effects showed bortezomib treatment by reducing the mean bioluminescence signal of tumors by 54%. Importantly, the combination of bortezomib and cisplatin potently reduced the mean bioluminescence signal by 93%.
In recent years, the significance of FOXM1 expression has continuously gained growing attention as one of the driving factors in cancer progression [37]. It has been shown to support tumor cell survival and epithelial-mesenchymal transition in ovarian carcinoma cells [38]. In breast cancer cells FOXM1 expression conferred cisplatin resistance [39]. Particularly, the nuclear localization of FOXM1 was associated with acquired chemoresistance in tumors [40]. The role of FOXM1 in neuroendocrine pulmonary tumors has been recently assessed in a small study that failed to demonstrate a clear function of FOXM1 as tumor marker and proposed a combined FOXM1/p21 and FOXM1/p27 score [41]. In our study, immunohistochemistry in 151 cases of ratified BP-NETs demonstrated that FOXM1 as single marker was strongly upregulated in SCLC samples compared to the better-differentiated carcinoid tumors controls. High immunoreactivity for nuclear FOXM1 was detected in 47.3% (58/123) of the SCLC samples. Most notably, FOXM1 nuclear immunoreactivity was strongly associated with the clinical proliferation marker Ki-67. This effect has been demonstrated for gastroenteropancreatic neuroendocrine tumors as well [42]. In contrast to intestinal neuroendocrine tumors, Ki-67 is not a clinically established tumor marker in neuroendocrine lung tumors. Nevertheless, recent publications demonstrate that Ki-67 labeling index has a high level of specificity to distinguish TC and ATC from LCNEC and SCLC and is proposed for clinical classification guidelines [43–45].
Unless this study is limited due to the small number of control BP-NET, the high expression of FOXM1 in SCLC related to BP-NET could be significantly demonstrated.
In accordance with the pivotal role of FOXM1 in cancer, its inhibition suppressed cell proliferation and tumor growth of breast cancer and promoted the cytotoxic effects of platinum compounds, doxorubicin hydrochloride and olaparib in epithelial ovarian cancer [46, 47]. The proteasome inhibitors bortezomib and siomycin A have been shown to potently inhibit FOXM1 expression [17, 48]. In this study human SCLC cell lines responded to proteasome inhibitor treatment by down-regulation of FOXM1, cell cycle arrest, and apoptosis induction, even under low-dose treatment. Following proteasome inhibition, the expression of FOXM1 as well as of several common p53 and FOXM1 target proteins were affected in a classical SCLC cell line NCI-H69. Using western blot analysis, we demonstrated that the CDK inhibitor and tumor suppressor protein p21 was upregulated. This cell cycle regulator is downregulated by FOXM1 [23] and often mutually upregulated by p53 [49]. Bortezomib affects the P53/RB/P21-dependent stress response cascades and mitotic protein expression, at least in part by down-regulation of FOXM1. As p21 and E2F are further under the transcriptional control of FOXM1 [24] and the effect of proteasome inhibition seems to be independent from the mutational status of p53, FOXM1 seems to be a mediating target of proteasome inhibitor response. As bortezomib is a proteasome inhibitor and not explicit to FOXM1 inhibition, it is not possible to conclude specific mechanistic connections. Nevertheless, analyzing different proteasome inhibitors, Bhat et al. showed that the negative regulation of FOXM1 is a general mechanism of these drugs and might drive their anticancer effect [17]. Gene expression analyses revealed that knockdown of FOXM1 reduced the expression of the p21 regulator SKP2 and induced proapoptotic STAT1. Nevertheless, the clear role of FOXM1 in mediating the response to bortezomib treatment remains to be further investigated.
Western blot analysis showed also a decrease of NF-kappaB p65 and FOXO3a. The tumor suppressor FOXO3a is associated with chemoresistance in breast cancer [50]. The reduction of FOXO3a might indicate a high PI3K or MAPK-pathway activation, as AKT and ERK1/2 are known to phosphorylate FOXO3a, thus, triggering its degradation. A recent study has demonstrated that the presence of active AKT and subsequently deactivated FOXO3a, in addition to active RB, is capable of determining the quiescence-senescence switch and thus, determining the persistence of a cellular proliferation arrest [51]. NF-kappaB p65 is associated with cell survival and represses essential cell cycle effectors regulated by FOXM1 in other cancers [20, 52]. The important role of NF-kappaB in lung cancer progression has been discussed deeply by Chen et al., who link the enhanced NF-kappaB signaling in lung cancer to chemo- and radiotherapy resistance, thus, highlighting the significance of targeting the NF-kappaB signaling pathway in lung cancer treatment [16]. Inhibition of NF-kappaB signaling pathway by bortezomib sensitized resistant renal carcinoma cells to direct necrotic death [53].
In our study, we could demonstrate the strong chemosensitizing effect of bortezomib in SCLC in vivo for the first time. In previously established SCLC xenograft mouse model [54] treatment with the combination of bortezomib and cisplatin showed a total remission of 20% of the tumors. Although bortezomib or cisplatin as monotherapies reduced the mean bioluminscence signal of tumors by 54-58%, the combination of both potently reduced the mean bioluminescence signal by 93%. These findings are consistent with previous studies on neuroblastoma and prostate cancer demonstrating the efficacy of bortezomib in overcoming chemoresistance [55, 56]. Suppression of tumor growth upon bortezomib monotherapy might result from the reduced expression of anti-apoptotic BCL-2, as has been previously shown in vitro for SCLC cells [57]. Nevertheless, in early clinical studies bortezomib failed to show single agent activity in SCLC [58]. The reason for the low monotherapeutic efficiency of bortezomib might be the lack of a strong pro-apoptotic trigger in the context of a reduced apoptotic capacity due to several tumor suppressor gene mutations (TP53, RB). Therefore, the authors propose to add an apoptotic trigger, such as chemotherapy. Indeed, bortezomib has shown to induce apoptosis combined with chemotherapy in NSCLC [59].
In NSCLC cells bortezomib abrogated chemoresistance by increasing p21 expression and targeting FOXM1 [59, 60]. Moreover, the chemosensitizing effect of bortezomib to platin-based chemotherapy has been recently discussed for NSCLC therapy [61, 62]. In conclusion, our data demonstrate that bortezomib augments the therapeutic efficacy of the standard SCLC chemotherapy. Thus, integration of bortezomib into the standard SCLC therapy may ultimately improve the outcome of patients and be of high value in a wide range of FOXM1-driven cancers.
MATERIALS AND METHODS
Patients and samples
In this study, we examined 151 formalin-fixed tissue samples collected by the Department of General and Visceral Surgery at the Zentralklinik Bad Berka GmbH between 2007 and 2012. These specimens included small-cell lung cancer (N=123), atypical carcinoid (N=17), and typical carcinoid (N=11) tumor samples (Table 1). Immunohistochemical characterization and analysis was done blinded and independently by the author P.G. and two experienced pathologists from the Zentralklinik Bad Berka GmbH and the Charité university hospital in Berlin (R.A., J.S.). The inter-observer variability was well below 100% and was discussed until a consensus formed between the researchers. Cases histologically verified as BP-NETs were characterized based on WHO classification and were re-evaluated by morphological criteria. Tumor samples selected for this study exceeded 80% tumor cells each.
Table 1: Clinicohistopathological data of tumor biopsies
BP-NETs: |
||||||
|---|---|---|---|---|---|---|
N=151 |
||||||
entity |
SCLC |
ATC |
TC |
total |
||
slides (N) |
123 |
17 |
11 |
151 |
||
gender |
male |
88 |
11 |
4 |
103 |
|
female |
35 |
6 |
7 |
48 |
||
grading |
G1 |
0 |
3 |
11 |
14 |
|
G2 |
0 |
12 |
0 |
12 |
||
G3 |
123 |
2 |
0 |
125 |
||
age (diagnosis) |
min |
22 |
25 |
52 |
||
max |
90 |
76 |
81 |
|||
mean |
66,26 |
59,42 |
63,66 |
|||
N=151 |
||||||
slides (N) |
123 |
17 |
11 |
151 |
||
tumor staging (T) |
T≤2 |
31 |
9 |
8 |
48 |
|
T≥2 |
80 |
0 |
0 |
80 |
||
T n/a |
12 |
8 |
3 |
23 |
||
N=151 |
||||||
slides (N) |
123 |
17 |
11 |
151 |
||
lymph node status (N) |
N= 0 |
17 |
11 |
10 |
38 |
|
N>0 |
92 |
0 |
0 |
92 |
||
N n/a |
14 |
6 |
1 |
21 |
||
N=151 |
||||||
slides (N) |
123 |
17 |
11 |
151 |
||
metastasis status (M) |
M=0 |
48 |
5 |
8 |
61 |
|
M>0 |
68 |
5 |
1 |
74 |
||
M n/a |
7 |
7 |
2 |
16 |
||
N=151 |
||||||
slides (N) |
123 |
17 |
11 |
151 |
||
Ki67 status |
Ki67< 2 |
0 |
0 |
11 |
11 |
|
Ki67≥ 2 |
123 |
17 |
0 |
140 |
||
The table summarizes 151 FFPE tumor samples used for histopathological staining, sub-grouped into the entities small-cell lung cancer (SCLC), atypical carcinoid (ATC), and typical carcinoid (TC).
Cell culture
Neuroendocrine lung cell lines used in our experiments were grown in pre-coated flasks (Falcon® Tissue Culture Flasks, Sterile, Corning®). Small cell lung cancer cell lines were donated by the lab group Burger from Freiburg (NCI-H69) and A. Nonnenmacher (Charité, CBF, Berlin, Germany) (NCI-H2171). Non-neuroendocrine control lung cell line A549 was kindly gifted by A. Weinhäuser (Charité, CBF, Berlin, Germany) and used if indicated. All cell lines were grown in a cell-specific medium supplemented with HEPES, 1% of penicillin-streptomycin, and 10% fetal bovine serum (FBS gold). A549, NCI-H2171, and NCI-H69 were maintained in RPMI-1640 with stable L-glutamine. All cell lines were grown in a humidified atmosphere of 5% CO2 and 95% air, and were cultured less than 15 passages following reception. All cell lines were authenticated by the DSMZ (Braunschweig, Germany in 2013 and 2014) by STR typing. To guarantee neuroendocrine activity, we used immunofluorescence microscopy to regularly test for cell line-specific expressions of neuroendocrine and differentiation markers, such as chromogranin A, synaptophysin, cytokeratin, vimentin, and syntaxin.
Generation of luciferase-expressing NCI-H69 cells
SCLC cells were transfected with two retroviral transfer vectors, pLib Luci-Neo (LN) and pLib EF1 a Luci-Neo (ELN) as previously described [63]. Transduced cells (H69-Luc-GFP) were selected and cultured in the presence of 500 g/ml of G418 (Life Technologies GmbH, Darmstadt).
Immunofluorescence
Cells were seeded and grown for 48 hours on cover slips and then fixed in 1:1 acetone/methanol. Next, unspecific bindings were blocked with milk buffer (2%) for 30 minutes and washed in PBS (0.1% BSA and 0.5% triton X). Primary antibody solutions were added to the cells and incubated for one hour at room temperature in a wet chamber. The primary antibodies used were chromogranin A (Progen Biotechnik GmbH, Heidelberg, Germany; 1:10), synaptophysin (Biogenex, CA, USA; 1:10), cytokeratin pan (Biomedical Ag-Dianova Aliquots; 1:200), and vimentin (-)(clone V9, Merck Millipore, Billerica, MA, USA). After incubation, cells were washed in PBS (0.1% BSA and 0.5% triton X) and secondary antibodies were applied (1:200, Alexa Fluor 488 goat anti-mouse and Alexa Fluor 594 goat anti-rabbit; Life Technologies) for two hours in the dark in a wet chamber. After incubation, cells were washed in PBS and fixed in 96% ethanol for two minutes. Slides were dried after approximately 10 minutes and embedded in Roti®-Mount FluorCare DAPI (Carl Roth GmbH, Karlsruhe, Germany).
Immunochemistry
Immunohistochemistry of paraffin-embedded specimens was performed using the peroxidase-anti-peroxidase method previously described in Grabowski et al. [54]. The FOXM1 (FOXM1 C-20) antibody was obtained from Santa Cruz Inc. and applied in a 2 μl/ml dilution. The scoring was performed as follows: nuclear staining intensity was determined as negative (0), weak (1), and strong (2), and multiplied by the percentage of the positive cells determined as 0 % (0), ≤10 (1), 11-50 (2) and >51 (3). The resulting score was considered low if <4 and high if ≥4.
The cytosolic FOXM1 score was assessed by staining as 0 (no), 1 (weak), 2 (moderate), or 3 (strong) immunoreactivity. To dichotomize this variable, only moderate and high staining were considered as positive staining. Immunohistochemical evaluation of all slides was done independently by three experts (R.A., J.S., P.G.); among them two experienced pathologists (R.A., J.S.).
Cell proliferation assay
Cells were seeded 5,000 to 10,000 cells per well in 96-well plates. All empty wells were filled with sterile PBS solution to minimize evaporation effects. Cells were grown in their regular medium for 24 hours before being treated for 24, 48, and 72/96 hours respectively with bortezomib and siomycin A (derived from streptomyces sioyaensis, Sigma-Aldrich, solved in DMSO). The ready-to-use bortezomib solution was provided by the dispensary of the Charité (1 mg/ml solution from Velcade 3.5 mg, Millennium Pharmaceuticals, Inc., Cambridge, MA, USA). For each concentration, we used five wells on each plate. After incubation, the used treatment medium was removed and exchanged with 100 μl of regular medium. Cell proliferation reagent WST-1 (Roche, Applied Science, Penzberg, Upper Bavaria, Germany) was added to each well and carefully re-suspended. Cells were incubated for two hours in the dark at 37°C. Colorimetric analysis was performed in a microplate reader (TECAN Sunrise™, Tecan Group AG, Männedorf, Switzerland) at 450 nm. All experiments were repeated in three individual trials. For statistic evaluation, we used Prism 6 software (GraphPad Software, Inc.).
Western blot analysis
Following a 48-hour treatment, cells were harvested from culture and lysed. Protein concentrations were determined using Quick Start Bradford Protein assay (Bio-Rad Laboratories, Inc.). SDS Page western blot was performed using a standard protocol with electroblotting onto PVDF membranes and documented by Coomassie staining (Coomassie Brilliant Blue, AppliChem GmbH, Darmstadt, Germany). Primary antibodies were purchased from Cell Signaling Technology Inc. Danvers, MA, USA: pan actin (D18C11), FOXO3a (75D8), NF-kappaB p65; Santa Cruz Biotechnology Inc. Dallas, Texas, USA: FOXM1 (C-20), p21; GeneTex Inc. Irvine, CA, USA: GAPDH; and Progen GmbH Heidelberg: chromogranin A (clone LK2H10). Appropriate horseradish peroxidase (HPR)-conjugated secondary antibodies (Dako Deutschland GmbH, Hamburg, Germany) were subsequently applied after washing and incubated for 1.5 hours. Chemiluminescence was visualized using an enhanced chemiluminescence reaction system (ECL™ prime Western Blotting detection reagent; Amersham™ GE healthcare) and imaged by a Fujifilm LAS-4000 luminescent image reader. Densitometric evaluations of detected chemiluminescence signals were performed by Multigauge V3.1 analysis software. The expression values of each protein was normalized to an internal control in three independent experiments and statistically assessed with Prism 6 software (GraphPad Software, Inc.). For re-probing, membranes were incubated in an acidic glycine buffer.
Cell cycle analysis
All cell lines were seeded in pre-coated six-well plates for 48 hours. Cells were treated with siomycin A or bortezomib for a further 48 hours in three individual experiments in vitro. Treated cells were then harvested, solubilized, and washed in cold PBS. Cell pellets were fixed by re-suspension in ice-cold 70% ethanol for 30 minutes. Following fixation, cells were incubated with the primary antibodies: phospho (Ser10) histone H3 (D2C8)XP (pH3; Cell Signaling Technology Inc. Danvers, MA, USA, diluted 1:1600). The secondary fluorescent antibody Alexa Fluor 488 (Alexa Fluor goat anti-rabbit; Life Technologies™, Carlsbad, California, USA) was applied 1:500. Cells were washed and further stained with propidium iodide (PI; 1 mg/ml Solution, Life Technologies™, Carlsbad, California, USA) and 10 μg/ml RNase A (Sigma-Aldrich, St. Louis, Missouri, USA). Different cell cycle phases were determinedby flow cytometry using FACSCalibur (Becton Dickinson) by BD Cell Quest Pro software and analyzed with FlowJo 8.7 software. Mitotic cells were characterized by phospho-H3 labeling, while apoptotic cells (sub-G1-phase) were identified by PI staining.
JC-1 apoptosis assay
This assay determines incipient apoptosis by detection of the initial change in mitochondrial membrane redox potential. Cells were seeded in six-well plates and grown for 48 hours before all cell lines were treated with bortezomib for 16 and 24 hours. Following incubation, cells were harvested and washed in warm PBS. JC-1 staining was performed according to the manufacturer’s instructions. To determine a baseline for positive apoptotic cells, each cell line had a positive control incubated with 2 μl (1:500) of the mitochondrial membrane depolarizer carbonyl cyanide 3-chlorophenylhydrazone (CCCP). CCCP represented 100% of apoptosis in the statistic evaluation. Flow cytometry was conducted using FACSCalibur (Becton Dickinson) by BD Cell Quest Pro software and analyzed with FlowJo 8.7 software.
RNA interference
Cells were transfected with 40 pmol/ml siRNA in appropriate amounts of Lipofectamine 3000 (Life technologies, Carlsbad, CA, USA) according to the manufacturer’s instructions for 72 h. An endoribonuclease-prepared heterogeneous siRNA pool was used in order to enhance specificity and reduce off-target effects: esiRNA against FOXM1 by Sigma (EHU124431: NCBI reference sequences: NM_021953, NM_202002, NM_202003) or negative control: Sigma Mission® siRNA Universal negative control #1.
nCounter® multiplex gene expression analysis
Cells were treated in triplets with the substance of interest. RNA was isolated with RNeasy Mini Kit (Qiagen) according to the manufacturer’s instructions. RNA was measured using nanodrop (Thermo Fisher Scientific). 60 ng RNA was applied in the PanCancer® pathway (Nanostring technologies, Seattle, WA, USA) analysis according to the manufacturer’s instruction. Assay was analyzed with nSolver® v2.5 (based on R v3.1.1). The DE results of the gene expression analysis were analyzed with nSolver® v2.5 software (nanostring technologies) using first principal component analysis and regression analysis with and without Benjamini-Yekutieli procedure. The GO overrepresentation analysis was performed with the http://pantherdb.org/ (release 20170413, reference list: Homo sapiens) based on the “panther pathway” annotation data set (PANTHER version 12.0 Released 2017-07-10) with Bonferroni correction for multiple testing [64].
Animal model and treatment
In vivo experiments were carried on the six-week-old Rag2-/-yc-/- mice that were purchased from the local stock of the animal facility at Freiburg University. The mice were injected subcutaneously with 1x10⁶ Luc-GFP-H69 cells in 50μl PBS (phosphate-buffered saline) and 50 μl of Matrigel (mouse sarcoma extracellular matrix, Becton Dickinson, Heidelberg, Germany). Bortezomib was administered by intraperitoneal injection in a volume of 0.2 ml at a concentration of 1 mg/kg/day body weight on days 14, 18, 21 and 25 after tumor inoculation. Cisplatin (CDDP; hospital pharmacy, Freiburg) was administered by intraperitoneal injection in a volume of 0.2 ml (5 mg/kg/day) on days 14 and 21 after tumor inoculation. Treatment efficacy was investigated on days 14 and 28 after tumor injection using bioluminescence imaging. Animal protocol was approved by the University Committee on the Use and Care of Laboratory Animals at Albert-Ludwigs University and by the Regierungspraesidium of Freiburg, Germany. When necessary, animals were humanely sacrificed.
Bioluminescence Imaging
After tumor inoculation presence of human SCLC cells was evaluated via in vivo BLI. To quantitatively analyze the progress of viable cells over time, animals were scanned immediately after tumor inoculation and then on week 2, 3 and 5 after tumor engraftment. D-Luciferin was injected intraperitoneally at a dosage of 150 mg/kg. Mice were imaged using IVES CCD (charge-coupled device) imaging system and analyzed using Living Image Software (Caliper Lifesciences).
Statistical analyses
Statistical analysis of immunohistochemistry was performed with IBM SPSS v22. For univariate analyses containing two dichotomized variables, the χ2 test was applied. For results with low expected counts due to low sample numbers, we applied Fisher’s exact test, if applicable.
In vitro data was presented as mean ± standard deviation (SD). We used Tukey’s multiple comparisons test for a two-way ANOVA and multiple T-test to evaluate the significance between different treatment groups of parametric data. To determine whether the values showed a Gaussian distribution, we used the Kolmogorov-Smirnov test. To identify outliers, Grubbs’ method was used. The Mann-Whitney U test was used to compare values between subgroups in order to assess significances of non-parametric data. Statistical significance was defined by p<0.05 (*). In the non-parametric test, statistical significance is corrected using the Holm-Sidak method and a definition of alpha=0.05. Analysis was performed with Prism 6 software (GraphPad Software, Inc.).
Author contributions
Data was primarily collected by Sanaz Taromi (in vivo) and Florentine Lewens (in vitro), with technical support by Helma Freitag, Friederike Christen, Franziska Briest, Dagmar Sedding, and Joana Benecke. Patient material and clinical data was provided by Daniel Kaemmerer, Claus-Peter Schneider, Mareike Heilmann und Karen Richter and immunohistochemistry was performed by Jörg Sänger, Almut Kunze and Amelie Lupp. IHC was pathologically evaluated by Jörg Sänger, Ruza Arsenic and Patricia Grabowski. IHC data was statistically analyzed by Franziska Briest. Cell lines were characterized by Florentine Lewens. Nanostring analyses were performed by Friederike Christen, Hedwig Lammert, Markus Möbs and Franziska Briest. Statistical analyses of in vitro data were performed by Florentine Lewens and Franziska Briest. Project was supervised by Michael Hummel, Britta Siegmund, Maike Burger and primarily by Franziska Briest and Patricia Grabowski. Manuscript was written by Sanaz Taromi, Florentine Lewens and Franziska Briest.
ACKNOWLEDGMENTS
This work was supported by the Theranostics Research Network. All the in vivo experiments were performed by Sanaz Taromi.
DISCLOSURES
The group of Dr. Patricia Grabowski receives financial support from Ipsen Pharma, Novartis and Pfizer. F.B. and P.G. received a travel grant and a lecture salary from Ipsen Pharma. D.K. received travel support by Ipsen Pharma and Pfizer.
CONFLICTS OF INTEREST
The authors declare no conflicts of interest.
FUNDING
S.T. was funded by the SFB850 program of the Deutsche Forschungsgemeinschaft (DFG). F.L., J.S., A.K., H.F., D.K., A.L., CP.S., F.B. and P.G were supported by the Theranostic Research Network Germany. The other authors state no relevant funding.
REFERENCES
1. Jemal A, Bray F, Center MM, Ferlay J, Ward E, Forman D. Global cancer statistics. CA Cancer J Clin. 2011; 61:69–90.
2. Kalemkerian GP, Akerley W, Bogner P, Borghaei H, Chow LQ, Downey RJ, Gandhi L, Ganti AK, Govindan R, Grecula JC, Hayman J, Heist RS, Horn L, et al, and National Comprehensive Cancer Network. Small cell lung cancer. J Natl Compr Canc Netw. 2013; 11:78–98.
3. Varghese AM, Zakowski MF, Yu HA, Won HH, Riely GJ, Krug LM, Kris MG, Rekhtman N, Ladanyi M, Wang L, Berger MF, Pietanza MC. Small-cell lung cancers in patients who never smoked cigarettes. J Thorac Oncol. 2014; 9:892–96.
4. Nicholson SA, Beasley MB, Brambilla E, Hasleton PS, Colby TV, Sheppard MN, Falk R, Travis WD. Small cell lung carcinoma (SCLC): a clinicopathologic study of 100 cases with surgical specimens. Am J Surg Pathol. 2002; 26:1184–97.
5. Kalemkerian GP, Gadgeel SM. Modern staging of small cell lung cancer. J Natl Compr Canc Netw. 2013; 11:99–104.
6. Byers LA, Rudin CM. Small cell lung cancer: where do we go from here? Cancer. 2015; 121:664–72.
7. Hurwitz JL, McCoy F, Scullin P, Fennell DA. New advances in the second-line treatment of small cell lung cancer. Oncologist. 2009; 14:986–94.
8. Field-Smith A, Morgan GJ, Davies FE. Bortezomib (velcadetrade mark) in the treatment of multiple myeloma. Ther Clin Risk Manag. 2006; 2:271–79.
9. Boccadoro M, Morgan G, Cavenagh J. Preclinical evaluation of the proteasome inhibitor bortezomib in cancer therapy. Cancer Cell Int. 2005; 5:18.
10. Rajkumar SV, Richardson PG, Hideshima T, Anderson KC. Proteasome inhibition as a novel therapeutic target in human cancer. J Clin Oncol. 2005; 23:630–39.
11. Bruno B, Rotta M, Giaccone L, Massaia M, Bertola A, Palumbo A, Boccadoro M. New drugs for treatment of multiple myeloma. Lancet Oncol. 2004; 5:430–42.
12. Kao C, Chao A, Tsai CL, Chuang WC, Huang WP, Chen GC, Lin CY, Wang TH, Wang HS, Lai CH. Bortezomib enhances cancer cell death by blocking the autophagic flux through stimulating ERK phosphorylation. Cell Death Dis. 2014; 5:e1510.
13. Hideshima T, Richardson P, Chauhan D, Palombella VJ, Elliott PJ, Adams J, Anderson KC. The proteasome inhibitor PS-341 inhibits growth, induces apoptosis, and overcomes drug resistance in human multiple myeloma cells. Cancer Res. 2001; 61:3071–76.
14. Sayers TJ, Brooks AD, Koh CY, Ma W, Seki N, Raziuddin A, Blazar BR, Zhang X, Elliott PJ, Murphy WJ. The proteasome inhibitor PS-341 sensitizes neoplastic cells to TRAIL-mediated apoptosis by reducing levels of c-FLIP. Blood. 2003; 102:303–10.
15. Ma MH, Yang HH, Parker K, Manyak S, Friedman JM, Altamirano C, Wu ZQ, Borad MJ, Frantzen M, Roussos E, Neeser J, Mikail A, Adams J, et al. The proteasome inhibitor ps-341 markedly enhances sensitivity of multiple myeloma tumor cells to chemotherapeutic agents. Clin Cancer Res. 2003; 9:1136-44.
16. Chen W, Li Z, Bai L, Lin Y. NF-kappaB in lung cancer, a carcinogenesis mediator and a prevention and therapy target. Front Biosci (Landmark Ed). 2011; 16:1172–85.
17. Bhat UG, Halasi M, Gartel AL. FoxM1 is a general target for proteasome inhibitors. PLoS One. 2009; 4:e6593.
18. Laoukili J, Stahl M, Medema RH. Foxm1: At the crossroads of ageing and cancer. Biochimica et biophysica acta. 2007;1775:92-102.
19. Kalinichenko VV, Major ML, Wang X, Petrovic V, Kuechle J, Yoder HM, Dennewitz MB, Shin B, Datta A, Raychaudhuri P, Costa RH. Foxm1b transcription factor is essential for development of hepatocellular carcinomas and is negatively regulated by the p19ARF tumor suppressor. Genes Dev. 2004; 18:830–50.
20. Wang Z, Ahmad A, Li Y, Banerjee S, Kong D, Sarkar FH. Forkhead box M1 transcription factor: a novel target for cancer therapy. Cancer Treat Rev. 2010; 36:151–56.
21. Wang IC, Chen YJ, Hughes D, Petrovic V, Major ML, Park HJ, Tan Y, Ackerson T, Costa RH. Forkhead box M1 regulates the transcriptional network of genes essential for mitotic progression and genes encoding the SCF (Skp2-Cks1) ubiquitin ligase. Mol Cell Biol. 2005; 25:10875–94.
22. Halasi M, Gartel AL. FOX(M1) news—it is cancer. Mol Cancer Ther. 2013; 12:245–54.
23. Koo CY, Muir KW, Lam EW. Foxm1: From cancer initiation to progression and treatment. Biochim Biophys Acta. 2012; 1819:28-37.
24. Wierstra I. The transcription factor FOXM1 (Forkhead box M1): proliferation-specific expression, transcription factor function, target genes, mouse models, and normal biological roles. Adv Cancer Res. 2013; 118:97–398.
25. Zona S, Bella L, Burton MJ, Nestal de Moraes G, Lam EW. Foxm1: An emerging master regulator of DNA damage response and genotoxic agent resistance. Biochim Biophys Acta. 2014; 1839:1316-22.
26. Ahmad A, Wang Z, Kong D, Ali S, Li Y, Banerjee S, Ali R, Sarkar FH. FoxM1 down-regulation leads to inhibition of proliferation, migration and invasion of breast cancer cells through the modulation of extra-cellular matrix degrading factors. Breast Cancer Res Treat. 2010; 122:337–46.
27. Zhang Y, Zhang N, Dai B, Liu M, Sawaya R, Xie K, Huang S. FoxM1B transcriptionally regulates vascular endothelial growth factor expression and promotes the angiogenesis and growth of glioma cells. Cancer Res. 2008; 68:8733–42.
28. Dai B, Kang SH, Gong W, Liu M, Aldape KD, Sawaya R, Huang S. Aberrant FoxM1B expression increases matrix metalloproteinase-2 transcription and enhances the invasion of glioma cells. Oncogene. 2007; 26:6212–19.
29. Nagel R, Stigter-van Walsum M, Buijze M, van den Berg J, van der Meulen IH, Hodzic J, Piersma SR, Pham TV, Jiménez CR, van Beusechem VW, Brakenhoff RH. Genome-wide sirna screen identifies the radiosensitizing effect of downregulation of mastl and foxm1 in nsclc. Mol Cancer Ther. 2015; 14:1434–44.
30. Kong FF, Zhu YL, Yuan HH, Wang JY, Zhao M, Gong XD, Liu F, Zhang WY, Wang CR, Jiang B. FOXM1 regulated by ERK pathway mediates TGF-β1-induced EMT in NSCLC. Oncol Res. 2014; 22:29–37.
31. Liu YQ, Guo RH, Liu LK, Gao W, Zhu CJ, Wei J, Shu YQ. Correlation between expression of forkhead box M1 (FOXM1) and clinicopathological features and prognosis in patients with non-small cell lung cancer (NSCLC). [Article in Chinese] Zhonghua Zhong Liu Za Zhi. 2011; 33:426–30.
32. Gomes AR, Zhao F, Lam EW. Role and regulation of the forkhead transcription factors FOXO3a and FOXM1 in carcinogenesis and drug resistance. Chin J Cancer. 2013; 32:365–70.
33. Xu X, Fu XY, Plate J, Chong AS. IFN-gamma induces cell growth inhibition by Fas-mediated apoptosis: requirement of STAT1 protein for up-regulation of Fas and FasL expression. Cancer Res. 1998; 58:2832–37.
34. Mamdani H, Induru R, Jalal SI. Novel therapies in small cell lung cancer. Transl Lung Cancer Res. 2015; 4:533–44.
35. Davies AM, Lara PN, Lau DH, Gandara DR. Treatment of extensive small cell lung cancer. Hematol Oncol Clin North Am. 2004; 18:373–85.
36. Chan BA, Coward JI. Chemotherapy advances in small-cell lung cancer. J Thorac Dis. 2013 (Suppl 5); 5:S565–78.
37. Myatt SS, Lam EW. The emerging roles of forkhead box (Fox) proteins in cancer. Nat Rev Cancer. 2007; 7:847–59.
38. Chiu WT, Huang YF, Tsai HY, Chen CC, Chang CH, Huang SC, Hsu KF, Chou CY. FOXM1 confers to epithelial-mesenchymal transition, stemness and chemoresistance in epithelial ovarian carcinoma cells. Oncotarget. 2015; 6:2349–65. https://doi.org/10.18632/oncotarget.2957
39. Kwok JM, Peck B, Monteiro LJ, Schwenen HD, Millour J, Coombes RC, Myatt SS, Lam EW. FOXM1 confers acquired cisplatin resistance in breast cancer cells. Mol Cancer Res. 2010; 8:24–34.
40. Khan I, Halasi M, Zia MF, Gann P, Gaitonde S, Mahmud N, Gartel AL. Nuclear FOXM1 drives chemoresistance in AML. Leukemia. 2017; 31:251–55.
41. Ha SY, Lee CH, Chang HK, Chang S, Kwon KY, Lee EH, Roh MS, Seo B. Differential expression of forkhead box M1 and its downstream cyclin-dependent kinase inhibitors p27(kip1) and p21(waf1/cip1) in the diagnosis of pulmonary neuroendocrine tumours. Histopathology. 2012; 60:731–39.
42. Briest F, Berg E, Grass I, Freitag H, Kaemmerer D, Lewens F, Christen F, Arsenic R, Altendorf-Hofmann A, Kunze A, Sänger J, Knösel T, Siegmund B, et al. FOXM1: A novel drug target in gastroenteropancreatic neuroendocrine tumors. Oncotarget. 2015; 6:8185–99. https://doi.org/10.18632/oncotarget.3600
43. Fabbri A, Cossa M, Sonzogni A, Papotti M, Righi L, Gatti G, Maisonneuve P, Valeri B, Pastorino U, Pelosi G. Ki-67 labeling index of neuroendocrine tumors of the lung has a high level of correspondence between biopsy samples and surgical specimens when strict counting guidelines are applied. Virchows Arch. 2017; 470:153-164. https://doi.org/10.1007/s00428-016-2062-2.
44. Pelosi G, Pattini L, Morana G, Fabbri A, Faccinetto A, Fazio N, Valeri B, Sonzogni A. Grading lung neuroendocrine tumors: controversies in search of a solution. Histol Histopathol. 2017; 32:223–41.
45. Clay V, Papaxoinis G, Sanderson B, Valle JW, Howell M, Lamarca A, Krysiak P, Bishop P, Nonaka D, Mansoor W. Evaluation of diagnostic and prognostic significance of ki-67 index in pulmonary carcinoid tumours. Clin Transl Oncol. 2017; 19:579-586. https://doi.org/10.1007/s12094-016-1568-z.
46. Yang C, Chen H, Yu L, Shan L, Xie L, Hu J, Chen T, Tan Y. Inhibition of FOXM1 transcription factor suppresses cell proliferation and tumor growth of breast cancer. Cancer Gene Ther. 2013; 20:117–24.
47. Tassi RA, Todeschini P, Siegel ER, Calza S, Cappella P, Ardighieri L, Cadei M, Bugatti M, Romani C, Bandiera E, Zanotti L, Tassone L, Guarino D, et al. Foxm1 expression is significantly associated with chemotherapy resistance and adverse prognosis in non-serous epithelial ovarian cancer patients. J Exp Clin Cancer Res. 2017; 36:63. https://doi.org/10.1186/s13046-017-0536-y.
48. Gartel AL. Thiazole antibiotics siomycin a and thiostrepton inhibit the transcriptional activity of foxm1. Front Oncol. 2013; 3:150.
49. Abbas T, Dutta A. p21 in cancer: intricate networks and multiple activities. Nat Rev Cancer. 2009; 9:400–14.
50. Taylor S, Lam M, Pararasa C, Brown JE, Carmichael AR, Griffiths HR. Evaluating the evidence for targeting FOXO3a in breast cancer: a systematic review. Cancer Cell Int. 2015; 15:1.
51. Imai Y, Takahashi A, Hanyu A, Hori S, Sato S, Naka K, Hirao A, Ohtani N, Hara E. Crosstalk between the Rb pathway and AKT signaling forms a quiescence-senescence switch. Cell Reports. 2014; 7:194–207.
52. Grivennikov SI, Karin M. Dangerous liaisons: STAT3 and NF-kappaB collaboration and crosstalk in cancer. Cytokine Growth Factor Rev. 2010; 21:11–19.
53. Thapa RJ, Chen P, Cheung M, Nogusa S, Pei J, Peri S, Testa JR, Balachandran S. NF-κB inhibition by bortezomib permits IFN-γ-activated RIP1 kinase-dependent necrosis in renal cell carcinoma. Mol Cancer Ther. 2013; 12:1568–78.
54. Taromi S, Kayser G, Catusse J, von Elverfeldt D, Reichardt W, Braun F, Weber WA, Zeiser R, Burger M. CXCR4 antagonists suppress small cell lung cancer progression. Oncotarget. 2016; 7:85185–95. https://doi.org/10.18632/oncotarget.13238
55. Michaelis M, Fichtner I, Behrens D, Haider W, Rothweiler F, Mack A, Cinatl J, Doerr HW, Cinatl J Jr. Anti-cancer effects of bortezomib against chemoresistant neuroblastoma cell lines in vitro and in vivo. Int J Oncol. 2006; 28:439–46.
56. Papandreou CN, Logothetis CJ. Bortezomib as a potential treatment for prostate cancer. Cancer Res. 2004; 64:5036–43.
57. Mortenson MM, Schlieman MG, Virudachalam S, Lara PN, Gandara DG, Davies AM, Bold RJ. Reduction in BCL-2 levels by 26S proteasome inhibition with bortezomib is associated with induction of apoptosis in small cell lung cancer. Lung Cancer. 2005; 49:163–70.
58. Lara PN Jr, Chansky K, Davies AM, Franklin WA, Gumerlock PH, Guaglianone PP, Atkins JN, Farneth N, Mack PC, Crowley JJ, Gandara DR. Bortezomib (PS-341) in relapsed or refractory extensive stage small cell lung cancer: a Southwest Oncology Group phase II trial (S0327). J Thorac Oncol. 2006; 1:996-1001.
59. Mortenson MM, Schlieman MG, Virudachalam S, Bold RJ. Effects of the proteasome inhibitor bortezomib alone and in combination with chemotherapy in the A549 non-small-cell lung cancer cell line. Cancer Chemother Pharmacol. 2004; 54:343–53.
60. Wang K, Zhu X, Zhang K, Zhu L, Zhou F. FoxM1 inhibition enhances chemosensitivity of docetaxel-resistant A549 cells to docetaxel via activation of JNK/mitochondrial pathway. Acta Biochim Biophys Sin (Shanghai). 2016; 48:804–09.
61. Davies AM, Chansky K, Lara PN Jr, Gumerlock PH, Crowley J, Albain KS, Vogel SJ, Gandara DR; Southwest Oncology Group. Bortezomib plus gemcitabine/carboplatin as first-line treatment of advanced non-small cell lung cancer: a phase II Southwest Oncology Group Study (S0339). J Thorac Oncol. 2009; 4:87-92.
62. Davies AM, Ruel C, Lara PN, Lau DH, Gumerlock PH, Bold R, Shibata S, Lenz HJ, Schenkein DP, Gandara DR. The proteasome inhibitor bortezomib in combination with gemcitabine and carboplatin in advanced non-small cell lung cancer: a California Cancer Consortium Phase I study. J Thorac Oncol. 2008; 3:68-74.
63. Taromi S, Kayser G, von Elverfeldt D, Reichardt W, Braun F, Weber WA, Zeiser R, Burger M. An orthotopic mouse model of small cell lung cancer reflects the clinical course in patients. Clin Exp Metastasis. 2016; 33:651–60.
64. Thomas PD, Kejariwal A, Guo N, Mi H, Campbell MJ, Muruganujan A, Lazareva-Ulitsky B. Applications for protein sequence-function evolution data: mRNA/protein expression analysis and coding SNP scoring tools. Nucleic Acids Res. 2006; 34:W645-50.