
INTRODUCTION
Diclofenac is a nonsteroidal anti-inflammatory drug (NSAID) commonly used to treat mild-to-moderate pain in rheumatoid and osteoarthritis as well as musculoskeletal injuries [1, 2]. Annually > 1000 tons of diclofenac are produced in the form of capsules, tablets, ointments and intravenous solution, thus underlining its extensive use [3, 4]. This NSAID exerts anti-inflammatory, analgesic and anti-pyretic effects through different mechanisms [5]. It inhibits cyclooxygenase 1 and 2 at an IC50 of 0.076 and 0.026μM, respectively and therefore modulates arachidonic acid metabolism and its pool size [6]. Diclofenac also inhibits production of leukotrienes through inhibition of lipoxygenases [7] and suppresses prostaglandin synthesis and thromboxane-prostanoid receptor signaling. Its analgesic activity partially resides in an activation of the nitric oxide–cGMP nociceptive pathway and inhibition of NMDA receptor mediated hyperalgesia. Diclofenac also inhibits activity of the neuropeptide substance P and is a partial agonist of the peroxisome proliferator activated receptor gamma (PPARγ) [8].
Repeatedly, the safety of diclofenac was assessed by regulatory authorities [9] and next to cardiovascular complications diclofenac causes liver and kidney injury especially among chronic drug users. According to the NIH LiverTox database serum liver function tests may be elevated in up to 15% of patients [10], and a long-term prospective clinical trial involving 17,289 arthritis patients revealed diclofenac to be commonly associated with aminotransferase elevations [11]. Likewise, a study on the incidence, presentation and outcomes in patients with drug-induced liver injury (DILI) in the general population of Iceland reported diclofenac to rank second among DILI causing agents [12].
Some of the reasons for diclofenac to cause DILI have been summarized by Boelsterli, 2003 and Aithal, 2011 [13, 14] and the role of reactive metabolites was emphasized. Next to direct effects reactive metabolites produce hapten-protein conjugates which are sensed and phagocytozed by antigen presenting cell (APC); when co-expressed with the major histocompatibility complex APCs elicit B-cell (drug antibody) and T-cell responses [15].
In an effort to develop an assay predictive for drug induced hepatitis, lymphocytes from different clinical DILI cases were isolated from heparinized blood [16]. The lymphocytes proliferated in vitro when exposed to the parent drug. A similar result was obtained when drug antigens obtained from serum of healthy individuals were added to the lymphocyte cultures to suggest an immune response independent of reactive metabolite [16]. Moreover, stimulation of lymphocytes was amplified when treated with the NSAID indomethacin.
Recently, we reported an identification of molecular circuits of diclofenac induced liver injury in mice [17] and observed induced cytokine and chemokine release by injured cells and activated immune cells like neutrophils, lymphocytes and macrophages. The release of inflammatory mediators supports migration and infiltration of immune competent cells at the site of injury to result in complex pro-and anti-inflammatory reactions in the course of immune-mediated hepatic injury. Specifically, release of pro-inflammatory cytokines and chemokines by macrophages, T cells and T helper (Th) cells such as interferon (IFN)γ, the interleukins (IL)-1, IL-6, IL-17, IL-18, the CXC chemokines and ligands of the chemokine receptors, i.e. CXCL1 and CXCL2, exacerbate diclofenac induced liver and kidney injury [18, 19]. In mice Th-17 mediated inflammation leads to DILI [20–22]; there is also suspicion that genetic polymorphism of immune response genes such as IL-4 and IL-10 sensitize to drug induced hepatotoxicity [15, 23].
Diclofenac induced idiosyncratic liver injury was shown to be immune-mediated; yet the underlying mechanisms remain unclear. Given the differences in the immune system between animals and humans [24] and the idiosyncratic nature of the reaction it is difficult to develop an animal model predictive for clinical DILI. Furthermore, pre-treatment of animals with inflammagens such as TNFα or LPS elicit an acute systemic inflammatory response which is different from drug induced inflammation. Moreover, in clinical DILI the onset of immune-mediated injury is usually delayed. Note, the relevance of animal studies to predict human toxicity was evaluated by an expert panel [25]. A total of 150 drugs encompassing a wide range of therapeutic classes was assessed by comparing animal data with clinically observed adverse drug reactions (ADR). The concordance was 71% when rodent and non-rodent data was considered together; however, dog studies alone were superior and predictive for 63% of clinical cases. The data involved 468 repeated-dose toxicity studies using primarily rats and dogs. Moreover, in the case of concordant/predictive toxicity 94% of animal studies predicted clinical ADR within 4 weeks or less of treatment [25]. Collectively, toxicities seen in dogs were more predictive for human ADR which provided a rational for the use of the canine animal model to investigate mechanism of diclofenac induced immunoallergic hepatitis. Further justification of the canine model is the similar COX1/COX2 expression between dogs and humans [26].
To better comprehend mechanism of diclofenac induced immuneallergic hepatitis we performed an immunogenomic study after repeated treatment for 28 days. Next to histopathology and serum/urinary biochemistry measurements the findings were corroborated by immunohistochemistry. Transcriptomics identified regulated immune, stress and inflammatory response genes, and the subsequently performed network analysis provided insight into mechanisms of diclofenac induced hypersensitivity reactions. Collectively, diclofenac treatment caused an activation of the complement system of the classical and alternate pathway with features of CARPA but without anaphylaxis. The allergic reaction is triggered by an erroneous programing of the innate and adaptive immune system and hallmarked by granulomatous hepatitis and mastocytosis of the liver.
RESULTS
Treatment related clinical signs
Figure 1 depicts the body weight (panel A) and food consumption (panel B) that was monitored over the entire treatment period in addition to individual organ weights determined at the end of the study (panel C). Only at the high dose regimen a significant reduction in body weight, food consumption and absolute organ weights of liver, lung and heart was noted. However, the difference in organ weights disappeared when adjusted for the total body weight (panel D).
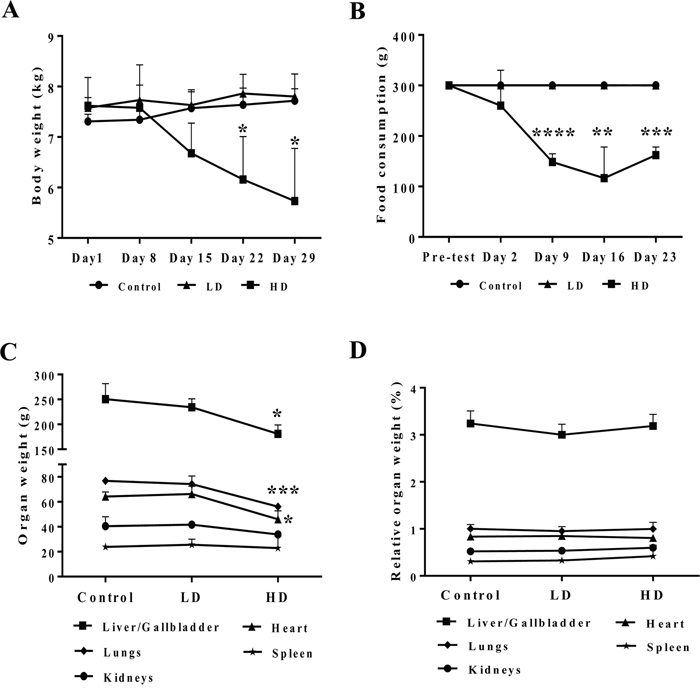
Figure 1: Body weight and food consumption after repeated diclofenac treatment for 28 days. (Panel A) Body weight. (Panel B) Food consumption. (Panel C) Selected organ weights. (Panel D) Body weight adjusted organ weights. LD = low dose, HD = high dose, *p<0.05, **p<0.01, ***p<0.001, ****p<0.0001.
Serum biochemistries
A summary of serum biochemistry findings is given in Figure 2. Treatment related abnormalities include the significant and dose dependent hypoalbuminemia and hypoproteinemia as well as significant reductions in ALT, ALP and γGT. The data are suggestive for an inflammation and wasting syndrome related cause of injury. Total bilirubin and serum glucose was also dose dependently reduced, and the observed hypoglycemia may be linked to altered ion channel activity of insulin secreting beta cells as was demonstrated for several NSAIDs [27]. Conversely, serum triglyceride was significantly (day 15) and serum phospholipid insignificantly increased. Moreover, serum CK and BUN were insignificantly increased. Although the changes may be related to the weight loss and mild kidney injury serum creatinine was basically unchanged or even reduced at high dose regimen.
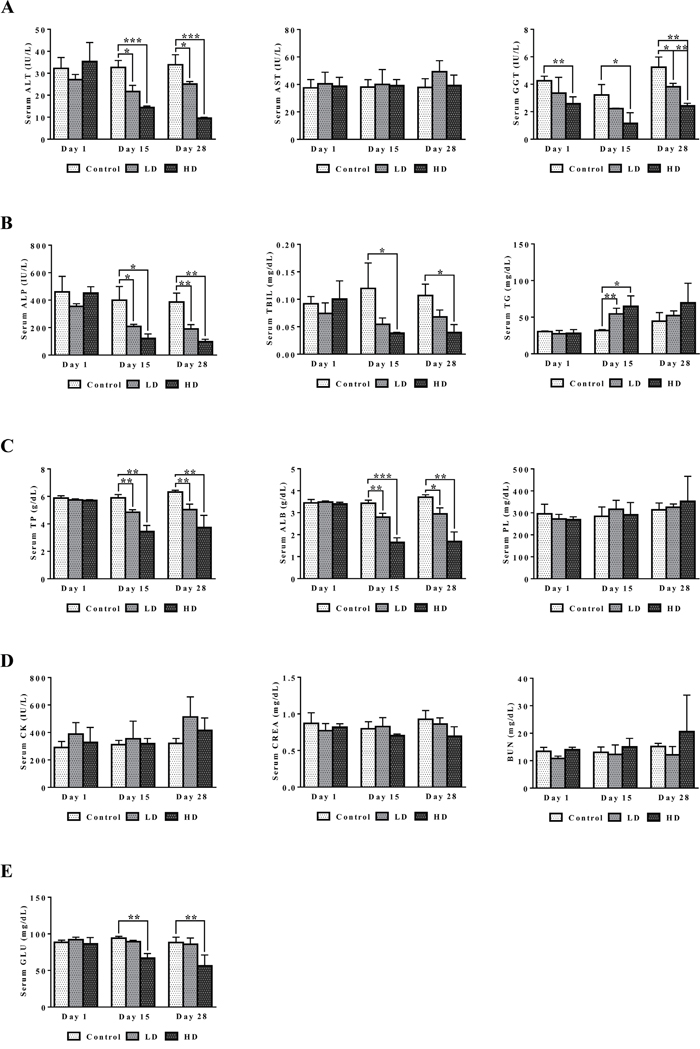
Figure 2: Serum biochemistries after repeated diclofenac treatment for 28 days. (Panel A1-A3) ALT, AST and γGT. (Panel B1-B3) ALP, TBIL, TG. (Panel C1-C3) TP, ALB, PL. (Panel D1-D3) CK, CREA, BUN. (Panel E) Serum glucose. LD = low dose, HD = high dose, *p<0.05, **p<0.01, ***p<0.001.
Treatment related hematologic disorders
Blood smear testing was done on days 1, 15 and 28 of diclofenac treatment. A dose dependent reduction in haematocrit, red blood cell count and haemoglobin was determined to signify bone marrow toxicity particularly at the high dose (HD) for 28 days (Figure 3). The significant increase in the proportion of reticulocytes indicates adaptive responses to the treatment related haemolytic anaemia and to compensate for erythrocytopenia. Furthermore, the dose and time dependent increases in WBC and platelets together with the highly significant induction of serum amyloid A1, IgG, IgM, complement factors, cytokines, chemokines and acute phase reactants (data are given below) provide strong evidence for drug induced inflammation. The significant increases in eosinophiles (day 1) and neutrophiles (day 28) are testimony to a drug induced inflammatory process though basophiles were repressed after repeated HD treatment for 28 days. Lymphocytopenia was also observed and is likely caused by inflammation that is sustained by the interplay of activated granulocytes, monocytes, Kupffer cells, mast cells and other pro-inflammatory mediators as defined by histopathology (see below). Notwithstanding, diclofenac hypersensitivity may also arise from complement activation-related pseudoallergy (CARPA) and is associated with granulocyte and mast cell degranulation with the release of pro-inflammatory molecules, histamines and other cytotoxic molecules as described below.
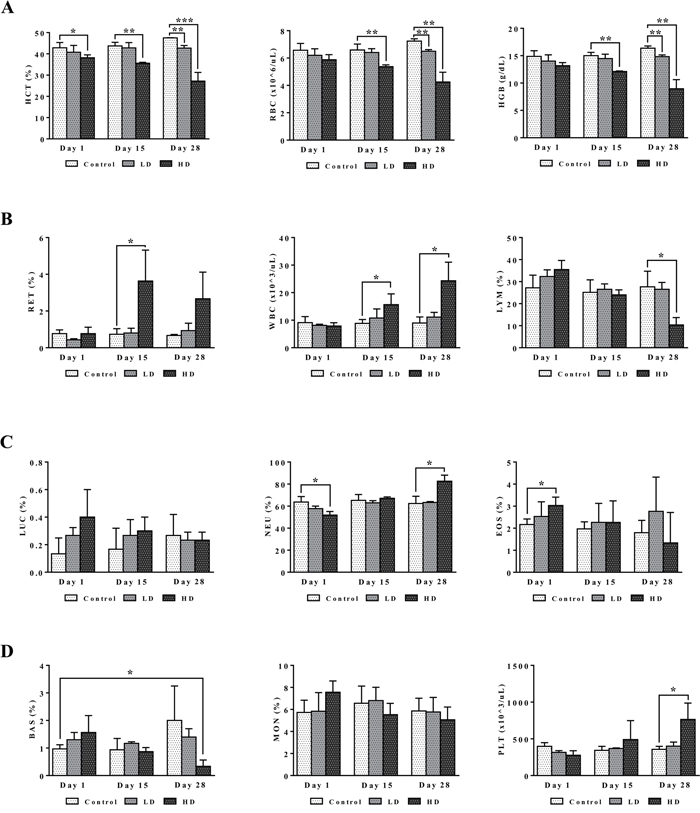
Figure 3: Haematology read-outs after repeated diclofenac treatment for 28 days. (Panel A1-A3) HCT, RBC, HGB. (Panel B1-B3) RET, WBC, LYMPH. (Panel C1-C3) LUC (large undifferentiated cells), neutrophils, eosinophils. (Panel D1-D3) basophils, monocytes, platelets. LD = low dose, HD = high dose, *p<0.05, **p<0.01, ***p<0.001.
Serum and urinary electrolyte disturbances
Figure 4 depicts dose dependent reductions in serum Ca2+ and urine Cl-ions. It is of considerable importance that kidney SLC12A2 was induced by >5-fold while carbonic anhydrase (CA) was repressed by nearly 25- and 2-fold in liver and kidney, respectively (data given below). Both proteins influence calcium homeostasis. Note, thiazide diuretics are given to patients with nephrolithiasis to inhibit activity of the SLC12A2 cation chloride-coupled co-transporter while inhibitors of carbonic anhydrase may increase calcium excretion [28]. Collectively, the observed induction of SLC12A2, the repression of CA and the 3-fold induction of the associated bicarbonate anion exchanger SLC26A4 (Pendrin) provide a molecular rationale for the observed electrolyte imbalances. Furthermore, CA functions as a radical scavenger and was shown to protect cells from hydrogen peroxide induced apoptosis [29, 30]. Given the significant induction of peroxidase in response to diclofenac treatment (see also Figure 11, MPO staining of Kupffer cells) and the significant regulation of CA in liver and kidney we consider oxidative damage as a likely cause for the observed electrolyte disturbances.
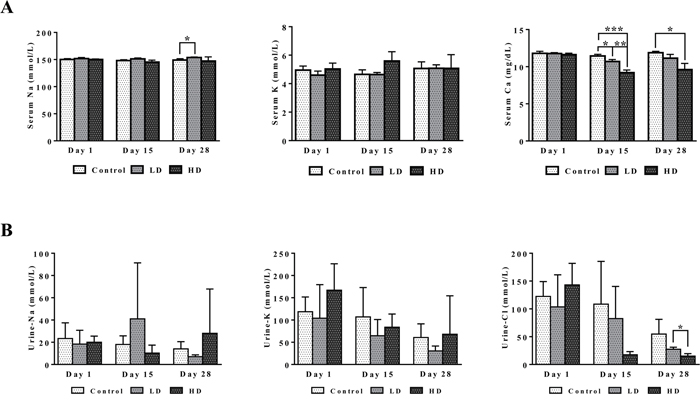
Figure 4: Serum and urine electrolytes after repeated diclofenac treatment for 28 days. (Panel A1-A3) Serum Na, K and Ca. (Panel B1-B3) Urine Na, K and Cl. LD = low dose, HD = high dose, *p<0.05, **p<0.01, ***p<0.001.
Histopathology of the liver
Diclofenac treatment induced a range of lesions, namely drug induced steatosis and glycogen depletion to hallmark cellular stress and mitochondrial dysfunction, eosinophilic reactions, apoptosis, acute lobular hepatitis with sinusoidal and interstitial inflammatory cell infiltrates (Kupffer cells, immature macrophages, lymphocytes and granulocytes) as well as hepatocellular injury resulting in treatment related granulomas (Figure 5). Usually, the granulomas were demarcated by an edge of lymphocytes. The strong induction of IgG, IgM and acute phase reactants (see below) as well as induced Fc-receptor signaling are part of a coordinate response to trigger phagocytosis and inflammation and involve the classical and alternative pathway of the complement system. Furthermore, the marked mastocytosis indicate drug hypersensitivity reactions. With HD treated animals sinusoidal dilatation was observed that may result from the action of histamine, leukotrienes and prostaglandins and other mediators released from mast cells to support inflammatory cell infiltration.
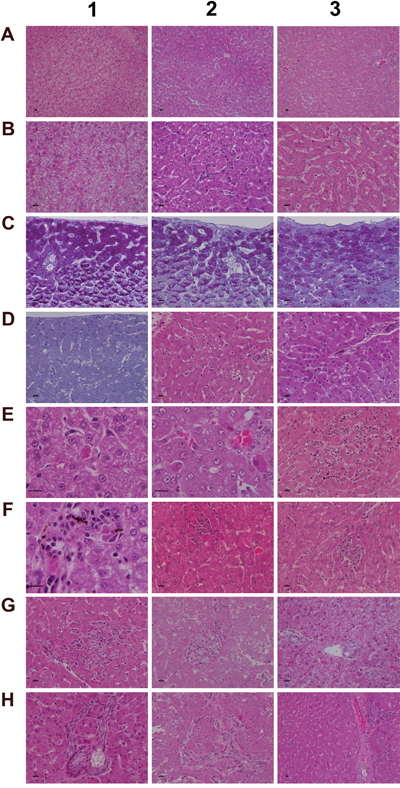
Figure 5: Histology of the liver in control and diclofenac treated animals after daily dosing for 28 days. (Panel A1) H&E staining of a control animal with monolayered trabecular organized hepatocytes and no sign of morphological alteration. (Panel A2) H&E staining of a low dose treated animal with enlarged and partially bilayered trabeculae; hepatocytes present a basophilic cytoplasm. Regenerative periportal hepatocytes are smaller in size. (Panel A3) H&E staining of a high dose treated animal; marked hepatic lobular regeneration with predominatly bilayered trabeculae. (Panel B1) Higher magnification of a liver section of a control animal. The nuclei of hepatocytes are round with small nucleoli. The cytoplasm is cloudy and rich in glycogen. (Panel B2) Higher magnification of a low dose treated animal. The nuclei appear moderately activated; focal sinusoidal inflammatory infiltrates are seen. (Panel B3) Higher magnification of a high dose treated animal with activated vesicular nuclei and prominent nucleoli. Zones of regeneration are organized as bilayered trabeculae with smaller sized hepatocytes and a slight basophilic cytoplasm. (Panel C1) PAS staining of a control liver section. Hepatocytes are rich in glycogen; the glycogen is preserved at the best beneath the capsule and results in marked staining. (Panel C2) PAS staining of a low dose treated animal. A patchier staining is observed with some hepatocytes presenting slight to moderate glycogen depletion. (Panel C3) PAS staining of a high dose treated animal. A patchier staining is observed with some hepatocytes presenting slight to moderate glycogen depletion. (Panel D1) PAS staining of a high dose treated animal with marked and almost complete glycogen depletion. Note the pronounced periportal hepatic steatosis induced by diclofenac treatment. (Panel D2) H&E staining of a high dose treated animal with a patchier periportal micro- and macrovesicular hepatic steaosis. (Panel D3) H&E staining of a low dose treated animal with focal mainly microvesicular hepatic steaosis. (Panel E1) Higher magnification of H&E staining of a low dose treated animal. In the reticle (center of the frame) a fresh apoptotic hepatocyte and its sinusoidal phagocytosis by a Kupffer cell is seen. (Panel E2) Higher magnification of H&E staining of a high dose treated animal. Shown in the lower right quadrant is an initial hepatocyte apoptosis within a steatotic liver section. Note the sinusiodal phagocytized apoptotic hepatocyte by a macrophage in the lower left quadrant. (Panel E3) H&E staining of a low dose treated animal with focal mixed inflammatory cellular infiltrates and groups of apoptotic hepatocytes. (Panel F1-G2) Sequential consolidation of focal interstitial inflammatory infiltrates with final granuloma formation of low (F1-F3) and high dose (G1-G2) treated animals. Panel F1 depicts at higher magnification a rounded focal sinusoidal/interstitial cellular infiltrate that is intermingled with remnants of apoptotic cells of a low dose treated animal. Early consolidation still exhibits a sinusoidal distribution of the infiltrate (F2), ending in a rounded granuloma (F3). Panel G1 depicts a rather acute interstitial infiltrate, and Panel G2 documents the consolidated granuloma in liver sections of high dose treated animals with marked steatosis. (Panel G3) H&E staining of a liver section of a control animal focussing on a normal portal field. (Panel H1 and H2) H&E staining of a low (H1) and high (H2) dose treated animal. Depicted are tangential sections of a portal field with marked arteriolocapillary and cholangiolar proliferations. (Panel H3) H&E staining of a high dose treated animal. Shown is an intact core of a transversely sectioned intact portal field. The proliferations occupy part of the limiting plate as well as periportal regions and likely trigger septal alterations as a result of increased hepatocyte regeneration. The bar represents 10μm.
Depicted in panel A1 is a control animal with normal parenchyma throughout the liver lobe. A predominantly monolayered trabecular structure and fluffy cytoplasm of hepatocytes can be seen. With LD treated animals (panel A2) and particularly in the periportal region (Zone 1) moderately increased liver regeneration was observed as defined by a denser basophilic cytoplasm of hepatocytes and a bilayered trabecular structure. With high dose treated animals marked regeneration was seen as evidenced by the extensive bilayered trabecula structure and basophilic cytoplasm of hepatocytes throughout the entire liver lobule. Panels B1 to B3 depict higher magnifications of control, LD and HD treated animals; with controls a fluffy cytoplasm with normal nuclei is seen (B1). LD treated animals presented moderately enlarged nuclei and nucleoli; regions of liver regeneration are particularly obvious in the periportal zone (lower right quadrant). Shown in B2 is the rim of a focal sinusoidal inflammatory infiltrate. With high dose treated animals (B3) marked liver regeneration was observed as denoted by bilayered hepatocyte trabeculi, dense cytoplasm, enlarged vesicular and prominent nucleoli. The sinusoids appeared widened with activated and enlarged Kupffer cells. There are also small granulomas (near the centre and the upper frame) with similar activated nuclei but swollen cytoplasm. The PAS staining of control, LD and HD treated animals is shown in panels C1-3. Dose dependent glycogen depletion was observed. Panel D1 is another HD treated animal with near complete depletion of glycogen stores and Supplementary Table 1 informs on glycogen synthesis and glucose metabolism regulated genes. The vacuolated hepatocytes hallmark drug induced microvesicular steatosis especially in the periportal and intermediate region, and the histology of panel D2 is another example of a high dose treated animal with a patchier pattern of hepatic microvesicular steatosis. D3 depicts the H&E stain of an LD treated animal and exemplifies the rare occurrence of focal microvesicular steatosis (below the portal field) within a periportal region of liver regeneration.
Diclofenac treatment induced programmed cell death; depicted in panel E1 and E2 are examples of fresh apoptotic cellular degenerations. A phagocytized apoptotic body within an enlarged Kupffer cell of a low dose treated animal is shown in panel E1. Apoptotic cells are mainly observed in the periportal/intermediate region (Zone 1/2). The HD treatment caused increased apoptotic activity. Disseminated single cell apoptosis was seen over the entire liver lobule, and panel E2 informs on early stage apoptotic cells that can be visualized by their eosinophilic cytoplasm and the notable pyknosis. Also documented is a phagocytized and partially degraded apoptotic cell within a Kupffer cell.
A transverse section of interstitial and sinusoidal inflammatory infiltrates is shown in panel E3. The mixed population of immature/migrating macrophages, Kupffer cells, granulocytes and lymphocytes caused arrosive damage, i.e. inflammation induced apoptosis as evidenced by groups of apoptotic cells. Occasionally mast cells are mixed within inflammatory infiltrates.
Shown in Figure 5 (panel F1 to G2) is the sequential consolidation of focal interstitial inflammatory infiltrates with final granuloma formation. At higher magnification a rounded focal interstitial/sinusoidal cellular infiltrate is observed that is intermingled with remnants of apoptotic cells (F1); panel F2 highlights initial granuloma formation in the liver of a LD treated animal; panel F3 exemplifies the consolidation of a granuloma. HD treatment caused diffuse alterations (panel G1) with a heterogeneous collection of predominantly polarized macrophages and mononuclear cell infiltrates as well as mixed granulocytes in a florid interstitial lesion. Depicted in panel G2 is the morphology of an infrequent but large granuloma in a steatotic liver of an HD animal. For comparison the portal field (PF) of a control animal is shown in panel G3. Tangential sections of PF highlight marked arteriolo-capillary and cholangiolar proliferation that appeared to be dose dependent (panel H1 (LD) & panel H2 (HD)). Shown in panel H3 is a transversely sectioned intact PF without inflammatory infiltrates of a HD treated animal. The proliferations occupied parts of the limiting plate and the periportal regions to likely initiate septal alterations as a result of increased hepatocyte regeneration.
To further examine architectural changes the Elastica van Gieson and the Gomori silver stain was employed. No evidence was obtained for early signs of fibrosis or enhanced deposition of extra cellular matrix into the sinusoids (data not shown).
Histopathology of the kidney
Diclofenac treatment induced minimal to very slight renal mineralization in all LD and HD treated animals and minimal tubular regeneration in 2 out of 3 LD treated dogs. One animal each of the LD and HD group presented minimal focal nephropathy, and 2 animals of the HD group were scored with minimal tubular dilatation. No inflammatory cell infiltrates were observed in any of the treatment groups. Given the very minor changes no images are shown.
Immunohistochemistry studies
A range of immunohistochemistry studies were performed. Figure 6 depicts IHC staining of IgM and complement factor B in control (A1-A3; D1-D3); low (B1-B3; E1-E3) and high dose (C1-C3; F1-F3, G1-G3) treated animals. A significant dose-dependent increase in IgM was observed, and next to its pronounced sinusoidal expression enhanced staining of IgM was particularly obvious in regions of injury. Some hepatocytes (panel C3) were positive for IgM to potentially indicate the synthesis of this immunoglobulin by harmed cells as had been observed by others [31, 32]. There is a clear evidence for IgM to “dress-up” harmed cells for complement mediated phagocytosis [33, 34]. We therefore hypothesize binding of IgM to danger-associated molecular patterns (DAMPs) expressed on the plasma membrane of harmed hepatocytes to endorse sterile inflammation, opsonization and Fcγ receptor signaling in support of phagocytosis. Moreover, induced expression of complement factor B is of critical importance. This protein is an essential component of the alternate complement pathway and a downstream effector of TLR signaling [35]. Together with C3b the catalytic subunit of factor B functions as the C3 convertase. As with the majority of proteins of the complement system factor B is primarily synthesized in hepatocytes [36]. Unlike controls (panel D1-D3) induced expression of factor B is observed in migrating monocytes, plasma cells (E3, F1) and macrophages (F1-F3) of low and high dose treated animals. Panel G1 exemplifies induced expression of factor B in harmed hepatocytes to possibly support mastocyte infiltration (panel G2) as was reported for the skin [37]. Infiltrates of factor B positive mast cells as well as migrating monocytes and macrophages are also depicted in panel G3 to once again highlight lobular inflammation. Frequently mast cells are associated with vascular endothelium (F2, F3). They are known to engage in complex interactions through binding to integrins and vascular adhesion molecules to support differentiation of mast cell precursors in the circulation and to instruct the endothelium in the orchestration of an inflammatory response [38].
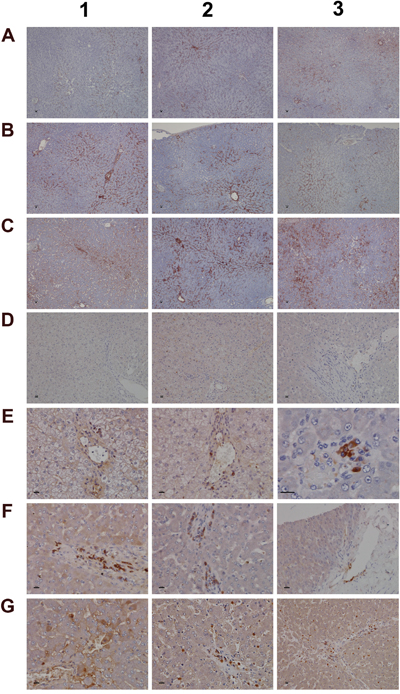
Figure 6: Immunohistochemistry staining of IgM and complement factor B in liver sections of control and diclofenac treated animals after daily dosing for 28 days. (Panel A1-A3) Shown are control animals with minimal to slight sinusoidal expression of IgM. (Panel B1-B3) Low dose treated animals with increased hepatic lobular expression of IgM. (Panel C1-C3) High dose treated animals with marked expression of IgM in regions of liver injury and regeneration. Some hepatocytes are positive for IgM (C3). (Panel D1-D3) None of the control animals express complement factor B. (Panel E1-E3) Low dose treated animals display induced expression of complement factor B in macrophages at a rim of a central vein (E1 and E2). Panel E3 is a high power field magnification depicting a cluster of macrophages and plasma cells with marked complement factor B expression. (Panel F1- F3) High dose treated animals with induced expression of complement factor B in macrophages and plasma cells. Activated complement factor B positive plasma cells and macrophages migrate from blood vessels to harmed hepatocytes. (Panel G1) Induced expression of factor B in harmed hepatocytes of a high dose treated animal. (Panel G2 and G3) Migration of factor B positive macrophages and mast cells into sinusoidal walls and sheaths of central veins. The bar represents 10μm.
We next evaluated the expression of convertase C3 and the C1 inhibitor of the classical pathway. As shown in Figure 7 and unlike controls (panel A1-A3) with minimal and primarily sinusoidal expression an unprecedented induction of the C3 protein was seen particular with harmed hepatocytes to support liver regeneration. Note, previous studies demonstrated the critical importance of C3 in liver regeneration after toxic injury with CCl4 [39]. Moreover, animals lacking C3 display impaired liver regeneration and develop acute liver failure after partial hepatectomy [40]. The expression of the C1 inhibitor was basically absent in control animals (panel D1-D3) but was dose dependently induced in low (E1-E3) and high dose (F1-F3) treated animals. Remarkably, expression of the C1 inhibitor is confined to subpopulations of macrophages with low and high expression of this protein to suggest differences in the activation states/polarization of macrophages and their sensor and effector functions in diclofenac induced inflammation. It is tempting to speculate that induction of the C1 inhibitor protein is an adaptive response to alleviate sinusoidal dilatation induced by inflammatory reactions [41].
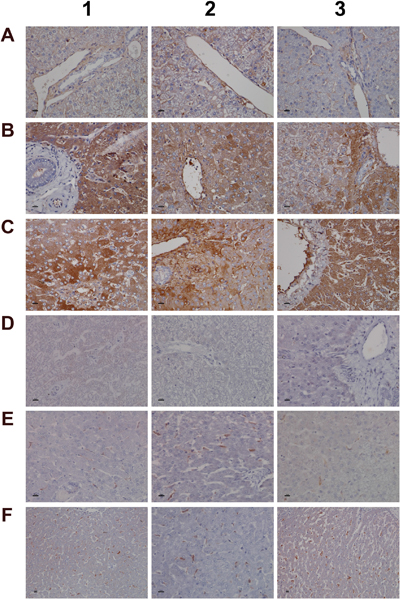
Figure 7: Immunohistochemistry staining of convertase C3 and the C1 inhibitor of the classical pathway in liver sections of control and diclofenac treated animals after daily dosing for 28 days. (Panel A1-A3) Shown are control animals with no expression of convertase C3. (Panel B1-B3) Moderate to marked portal field convertase C3 expression in low dose treated animals. (Panel C1-C3) Marked convertase C3 expression in high dose treated animals. (Panel D1-D3) Shown are control animals with no expression of the C1 inhibitor protein. (Panel E1-E3) Low dose treatment of animals induced moderate expression of the C1 inhibitor in some but not all Kupffer cells. Note the sinusoidal enlarged macrophages. (Panel F1-F3) Marked proliferation of C1 inhibitor positive Kupffer cells in diclofenac induced inflammation. The bar represents 10μm.
To further investigate the nature of inflammatory cell infiltrates the expression of CD205 (DEC205) and of CD74 was investigated (Figure 8). Note, CD205 is a well characterized endocytic receptor that is highly expressed on dendritic cells and in different leukocyte populations [42]. Recently, it was shown that CD205 is also strongly expressed in Kupffer and sinusoidal endothelial cells [43] and functions as a recognition receptor for dying cells [44]. Diclofenac treatment caused a dose dependent induction of the CD205 protein in macrophages and monocytes/leukocytes. With control animals (panel A1-A3) expression of the protein was minimal or absent while the low (B1-B3) and high dose treatment (C1-C3) caused strong induction of the protein. Panel B2 also exemplifies CD205 negative inflammatory cell infiltrates (granulocytes, lymphocytes and migrating monocytes) close to a central vein. Shown in panel B1, C2 and C3 are enriched CD205 positive cell infiltrates in a vascular sheath, a central vein and sinusoids to sustain lobular inflammation. A distinct expression pattern is observed with some cells (monocytes/leucocytes) displaying strong CD205 plasma membrane expression while Kupffer cells tend to show strong intracellular expression. CD205 positive cells are enriched in granulomas (panel B3) and similar observations were made by others [45] with recent research suggesting CD205 expressing Kupffer cells to release interleukins to promote NKT cell activation [46].
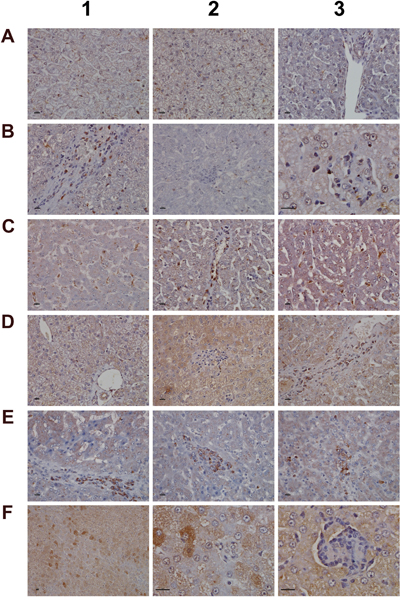
Figure 8: Immunohistochemistry staining of CD205 and CD74 in liver sections of control and diclofenac treated animals after daily dosing for 28 days. (Panel A1-A3) Control animals do not express the CD205 protein. (Panel B1) Sinusoidal CD205 positive macrophages migrate into a vascular sheet of a low dose treated animal. (Panel B2) Slight expression of CD205 in Kupffer cells of low dose treated animals. Shown in the centre of the frame is an acute granulocytic/lymphocytic infiltrate close to a central vein. The inflammatory cell infiltrate is CD205 negative. (Panel B3) High power field magnification of a granuloma with CD205 positive resident Kupffer cells and migrated macrophages in a low dose treated animal. (Panel C1) Enlarged sinusoidal macrophages with marked CD205 expression of a high dose treated animal. (Panel C2) CD205 positive macrophages throughout the lobule and their accumulation in the area of the central vein (together with mast cells) of a high dose treated animal. (Panel C3) Activated and marked (lobular) CD205 positive Kupffer cell infiltrates and marked microvesicular steatosis of a high dose treated animal. (Panel D1) Shown are the portal triad and a central vein of a control animal with no expression of CD74. (Panel D2) Shown is a granuloma of a low dose treated animal. The macrophages do not express CD74. (Panel D3) CD74 positive cells gathered in the sheath of a central vein of a low dose treated animal. (Panel E1-E3) Clusters of CD74 positive cells in sheets of central veins (E1, E2) and within liver tissue (E3) of high dose treated animals. (Panel F1 and F2) Hepatocytes with marked expression of CD74 of a low and high power field magnification. (Panel F3) High power field magnification of a granuloma with CD74 positive cells at the rim of the granuloma. The bar represents 10μm.
Owing to its unique role in the folding and transport of MHC-molecules and its function as a receptor for the macrophage migratory inhibitory factor, i.e. a key factor to induce macrophage activation [47], expression of CD74 was investigated. The CD74 coding gene was strongly induced (>5-fold) in diclofenac treated animals (data given below) and the protein is expressed in lymphocytes, APCs, monocytes and macrophages [48]. Depicted in Figure 8D1 is a control animal with no expression of the protein. Diclofenac treatment induced expression of the protein and migration of CD74 positive cells (panel D3 and E1) to possibly prime cytotoxic responses. Shown in panel E2 and E3 are clusters of CD74 positive cells to facilitate antigen presentation and inflammation; panel E1-E2 and D3 exemplify mixed cell infiltrates in a central vein enriched with plasma cells with high CD74 expression. Frequently, CD74 positive mast cells associate with vascular endothelium and some hepatocytes express CD74 as well (panel F1 & F2). A similar staining of CD74 was reported in liver sections of patients with severe acute autoimmune hepatitis [49] though regenerative hepatocytes are negative for CD74 as shown in panel E1 and E2. Furthermore, at the rim of granulomas CD74 positive cells were observed (panel F3).
Given the important relationship between hypoxia and inflammation [50] the regulation of hypoxia inducible factor (HIF1A) was investigated (Figure 9). Unlike controls (panel A1-A3) a dose dependent approximately 4-fold increase in HIF1A transcript (data given below) and a highly significant HIF1A protein expression in low (panel B1-B3) and high dose (panel C1-C3) treated animals was observed. HIF1A was strongly expressed in mixed cell infiltrates, i.e. mast cells, macrophages and plasma cells in a vascular sheath (C1), and shown in panels C2 & C3 are sinusoidal mast cells with strongly induced HIF1A expression. Independent studies already confirmed induced HIF1A expression in activated mast cells [51]. With control animals typically a few mast cell are seen in the portal and periportal regions (A2 and A3). Their HIF1A protein expression is either minimal or absent. Diclofenac treatment caused marked mast cell infiltration to signify mastocytosis of the liver; a shift in localisation towards the lobular and the central vein is observed (panel B1-B3). Note the adhesion/margination of mast cells on an endothelial cell sheet of the central vein and adjacent to it an acute granulocytic infiltrate (B3).
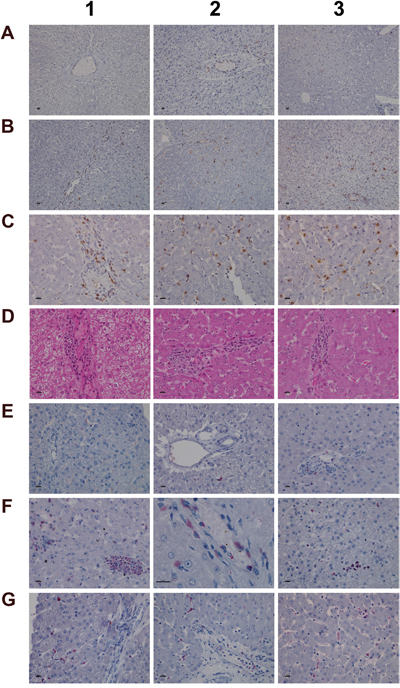
Figure 9: Immunohistochemistry staining of HIF1A and CAE in liver sections of control and diclofenac treated animals after daily dosing for 28 days. (Panel A1-A3) Minimal HIF1A protein expression of resident mast cells. Like sentinel cells they occupy in smaller number the portal fields and the sinusoidal lining. (Panel B1-B3) Increased HIF1A expression in response to low dose treatment. The number of mast cells increased; note their localization in the intermediate lobular and centrolobular regions and around the central vein. (Panel C1-C3) Marked HIF1A expression of mast cell infiltrates and Kupffer cells in high dose treated animals; increased mast cell infiltrates which are now concentrated in and around the central vein. (Panel D1-D3) H&E staining depicting focal acute inflammatory infiltrates of central veins in low dose treated animals (D1), shifting to chronic inflammatory infiltrates in high dose treated animals (D2, D3) in association with the perivenously increased mast cells. (Panel E1-E3) CAE staining of control animals. Shown is the normal occurrence of periportal and portal field localized mast cells. (Panel F1) Centrolobular clusters of mast cells (left side) and perivenous granulocytic infiltrate of low dose treated animal. (Panel F2) Accumulated mast cells and a granulocyte in a central vein of a high dose treated animal. (Panel F3) A group of immature macrophages / small granuloma. (Panel G1) Periportal localized activated Kupffer cells with occasionally mast cell infiltrates in a low dose treated animal. (Panel G2) Migration of granulocytes, Kupffer and mast cells into hepatic parenchyma of a high dose treated animal. (Panel G3) Mixed type granulocyte and mast cell infiltrates of a high dose treated animal. Shown in the upper right quadrant is the proliferation and mitosis of presumably resident macrophages. The bar represents 10μm.
Among its different functions HIF1A regulates expression of histidine decarboxylase (HDC) which catalyzes the formation of histamine from histidine. Though diclofenac treatment did not influence HDC gene expression (Supplementary Table 2) the transcript expression of the principal histamine inactivating enzymes, i.e. histamine N-methyltransferase (HMT) and amine oxidase (AOC) was significantly repressed to imply impaired histamine degradation. Furthermore, H&E (panel D) and CAE (panel E-G) staining revealed the treatment related mastocytosis and granulocytic infiltration. Depicted in panel D1-D3 are inflammatory infiltrates of the central vein associated with the treatment related mastocytosis. Panel D1 shows a sub-acute mixed inflammatory cell infiltrate (granulocytic, lymphocytic and immature macrophages) of a low dose treated animal whereas D2 to D3 exemplify the shift towards predominant plasmacytic cell infiltrates of high dose treated animals to imply a coordinate response to diclofenac induced injury with activated plasma cells differentiating into antibody producing lymphocytes.
The CAE staining of control animals is given in panel E1 to E3. A few mast cells reside in the portal/periportal region. With low and high dose treated animals (panel F1-F3) mast cell cluster and perivenous granulocytic infiltrates are observed. Depicted in panel F2 and F3 is the margination of mast cells on endothelium and the granulocyte in a central vein of a high dose treated animal as well as a group of immature macrophages. Mainly periportal localized activated Kupffer cells and occasionally mast cell infiltrates were observed in a low dose treated animal (G1) whereas high dose diclofenac treatment induced marked migration of granulocytes, Kupffer and mast cells into hepatic parenchyma (G2). Note the proliferation and mitosis of presumably resident macrophages in the upper right quadrant of panel G3. Collectively, the mixed granulocyte and mast cell infiltrates reinforce the notion of mast cell activation and granuloma formation in response to diclofenac treatment.
Among the acute phase reactants the expression of serum amyloid A (SAA) was investigated (Figure 10). This protein is typically induced by cytokines released from innate immune cells such as macrophages and monocytes. Diclofenac treatment prompted a clear dose related induction of SAA transcript (>60-fold, Table 1) and protein. Although control animals do not express SAA (panel 10A1-A3) strong expression of the protein was seen particularly in high dose treated animals (panel C1–C3). Panel 10B1 depicts a granuloma observed in a liver section of a low dose treated animal with expression of SAA in part by granuloma cells. Furthermore, hepatic lobular SAA expression by some hepatocytes and macrophages but not all macrophages is observed (panel B2-B3). Importantly, SAA influences macrophage differentiation into distinct subtypes [52], and the significant regulation of marker genes associated with M1 and M2 polarized macrophages in response to diclofenac treatment is discussed below.
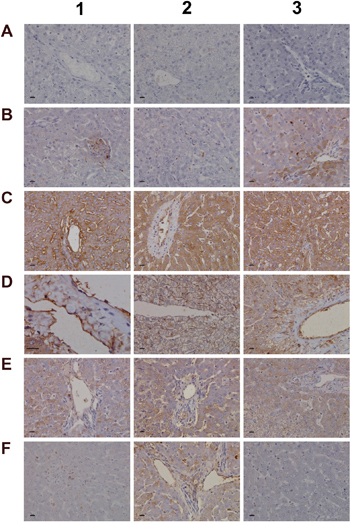
Figure 10: Immunohistochemistry staining of SAA1 and VCAM-1 in liver sections of control and diclofenac treated animals after daily dosing for 28 days. (Panel A1-A3) Control animals do not express the SAA1 acute-phase protein. (Panel B1) Expression of SAA1 in a granuloma of aggregated macrophages of a low dose treated animal. (Panel B2) Expression of SAA1 in a subpopulation of macrophages of a low dose treated animal. (Panel B3) Moderate expression of SAA1 by harmed hepatocytes of a low dose treated animal. (Panel C1-C3) Marked hepatic and sinusoidal endothelial expression of SAA1in high dose treated animals. (Panel D1) High power field endothelium expression of VCAM-1 in a control animal. (Panel D2 and D3) Sinusoidal and endothelial expression of VCAM-1 of a central vein in control animals. (Panel E1-E3) Reduced sinusoidal and endothelial expression of VCAM-1 in low dose treated animals. (Panel F1 and F2) A subpopulation of VCAM-1 positive macrophages retained VCAM-1 expression. (Panel F3) Complete loss of sinusoidal and endothelial VCAM-1 expression in a marked steatotic liver of a high dose treated animal. The bar represents 10μm.
Table 1: Commonly regulated hepatic DEGs after low- and high-dose diclofenac treatment
Gene symbol |
Gene description |
Fold change_LD (average) ± SD |
Fold change_HD (average) ± SD |
|---|---|---|---|
A2M |
Alpha-2-macroglobulin |
1.79±0.31 |
5.78±1.41 |
ABHD2 |
Abhydrolase domain containing 2 |
1.74±0.54 |
2.05±0.47 |
ACADSB |
Acyl-CoA dehydrogenase, short/branched chain |
-1.51±0.14 |
-2.3±1.01 |
ACSS2 |
Acyl-CoA synthetase short-chain family member 2 |
-1.58±0.32 |
-2.46±0.61 |
AGXT |
Alanine-glyoxylate aminotransferase |
-1.55±0.42 |
-2.25±3.58 |
ALDH9A1 |
Aldehyde dehydrogenase 9 family, member A1 |
-1.72±0.38 |
-3.73±1.37 |
C10H12orf23 |
Transmembrane protein 263 |
1.78±0.56 |
4.92±2.88 |
C11H9orf174 |
Chromosome 11 open reading frame, human C9orf174 |
-1.69±0.23 |
-2.31±0.59 |
CA3 |
Carbonic anhydrase III, muscle specific |
-3.44±2.01 |
-24.38±1.86 |
CD9 |
CD9 molecule |
1.78±0.59 |
3.2±1.44 |
CDADC1 |
Cytidine and dCMP deaminase domain containing 1 |
-1.64±0.5 |
2±0.74 |
CLDN10 |
Claudin 10 |
-1.64±0.4 |
-4.58±1.43 |
CLDN18 |
Claudin 18 |
1.76±0.38 |
-2.06±1.18 |
CYLD |
Cylindromatosis (turban tumor syndrome) |
1.73±0.46 |
2.12±0.91 |
CYP26A1 |
Cytochrome P450, family 26, subfamily A, polypeptide 1 |
-2.58±0.34 |
-4.44±0.25 |
CYP2B6 |
Cytochrome P450 2B11 |
-1.7±0.23 |
-8.63±1.07 |
DHCR7 |
7-dehydrocholesterol reductase |
-1.96±0.15 |
-2.08±0.91 |
EGR1 |
Early growth response 1 |
2.56±0.73 |
6.6±3.01 |
ELOVL2 |
ELOVL fatty acid elongase 2 |
4.01±1.71 |
9.75±3.04 |
EPSTI1 |
Epithelial stromal interaction 1 |
-1.54±0.22 |
-2.28±1.09 |
FABP7 |
Fatty acid binding protein 7 |
1.88±0.19 |
2.34±0.98 |
FAM159A |
Family with sequence similarity 159, member A |
1.56±0.26 |
2.24±0.14 |
FDPS |
Farnesyl diphosphate synthase |
-1.5±0.24 |
-2.68±0.95 |
GABPA |
GA binding protein transcription factor, alpha subunit 60kDa |
1.52±0.14 |
3.94±1.97 |
GK |
Glycerol kinase |
1.58±0.36 |
3.23±1.09 |
GPT |
Glutamic-pyruvate transaminase |
-1.5±0.21 |
-4.99±2.94 |
GSTA4 |
Glutathione S-transferase alpha 4 |
-1.54±0.09 |
-5.29±1.8 |
HAMP |
Hepcidin antimicrobial peptide |
-4.99±1.34 |
-4.12±1.98 |
HMGN2 |
Non-histone chromosomal protein HMG-17 |
-1.56±0.45 |
-1.5±1.92 |
HSD11B1L |
Hydroxysteroid (11-beta) dehydrogenase 1-like |
-1.57±0.4 |
-2.03±0.14 |
IDI1 |
Isopentenyl-diphosphate delta isomerase 1 |
-1.59±0.23 |
-2.08±0.48 |
IFI35 |
Interferon-induced protein 35 |
-1.56±0.16 |
-3.67±3.48 |
IL1B |
Interleukin 1, beta |
1.82±0.32 |
2.02±0.16 |
IL33 |
Interleukin 33 |
-1.65±0.28 |
-4.17±1.24 |
ITIH3 |
Inter-alpha-trypsin inhibitor heavy chain 3 |
1.52±0.28 |
2.13±1.32 |
LBP |
Lipopolysaccharide binding protein |
3.21±1.74 |
32.93±2.07 |
MFSD2A |
Major facilitator superfamily domain containing 2A |
2.06±0.41 |
2.26±0.6 |
MRPL22 |
Mitochondrial ribosomal protein L22 |
1.55±0.15 |
2.02±0.49 |
NEIL3 |
Nei endonuclease VIII-like 3 |
-2.15±0.44 |
-3.59±0.85 |
OAS1 |
2'-5'-oligoadenylate synthetase 1, 40/46kDa |
-1.51±0.18 |
-2.75±1.37 |
OXCT1 |
3-oxoacid CoA transferase 1 |
-1.83±1.39 |
-6.24±3.46 |
PKLR |
Pyruvate kinase, liver and RBC |
-1.78±0.46 |
-8.22±1.5 |
PLIN2 |
Perilipin 2 |
1.65±0.26 |
8.11±4.19 |
RHPN2 |
Rhophilin-2 |
-1.52±0.14 |
-3.62±2.28 |
S100A8 |
S100 calcium binding protein A8 |
1.57±0.1 |
9.77±2.02 |
SAA1 |
Serum amyloid A1 |
3.09±1.08 |
61.77±2.97 |
SFTPD |
Surfactant protein D |
1.51±0.21 |
3.74±1.02 |
SLC16A4 |
Solute carrier family 16, member 4 |
-1.62±0.47 |
-3.26±1.12 |
THBS1 |
Thrombospondin 1 |
1.74±0.5 |
2.14±0.58 |
TMEM178 |
Transmembrane protein 178A |
-1.51±0.16 |
-2.87±0.81 |
TMEM43 |
Transmembrane protein 43 |
1.65±0.21 |
3.66±1.56 |
TXNDC5 |
Thioredoxin domain containing 5 (endoplasmic reticulum) |
1.52±0.32 |
4.85±2.4 |
WIPI1 |
WD repeat domain, phosphoinositide interacting 1 |
1.67±0.24 |
6.13±1.06 |
Dogs were given 1mg/kg or 3 mg/kg once daily for 28 days. Whole genome expression profiling was performed and DEGs were calculated based on the criteria fold change >1.5 and a p-value <0.05. Collectively, 53 genes were regulated in common when low and high dose treatment groups were compared.
Additionally, expression of VCAM-1 was considered. This cell adhesion molecule plays an essential role in leukocyte recruitment and is typically induced in inflammation [53]. Shown in panel D1 is a high power field magnification of VCAM-1 expression of vascular endothelium as well as the sinusoidal (panel D2) and endothelial expression on a central vein (panel D3) of control animals. Diclofenac treatment elicited a dose dependent reduction of VCAM-1 protein expression in low (panel E1-E3) and high dose (F1-F3) treated animals; however hepatic gene expression of VCAM-1 was unchanged. The findings agree with earlier reports obtained in HUVEC cells whereby diclofenac treatment inhibited expression of the endothelial cell adhesion molecule VCAM-1, ICAM-1 and E-selectin [54]. Similar results were also reported for ibuprofen [55] and this NSAID was shown to inhibit leukocyte migration through endothelial cell monolayers [56]. Notwithstanding a distinct subpopulation of macrophages/monocytes retained VCAM-1 expression after diclofenac treatment (panel F1/F2). It is tempting to speculate that VCAM-1 positive macrophages retain hematopoietic stem cell properties and facilitate HSC trafficking to the liver to sustain extramedullary myelopoiesis and to block macrophage maturation as reported for spleen VCAM-1+ macrophages [57]. Moreover, silencing of VCAM-1 or M-CSFR in ApoE -/- mice limited inflammation and reduced myeloid cell numbers in atherosclerotic plaques [57] though in the present study M-CSFR was significantly up-regulated at the high dose regimen (as discussed below).
Given that myeloperoxidase (MPO) is a critical effector of inflammation and abundantly expressed in neutrophils, monocytes and macrophages [58] its regulation in diclofenac treated animals was investigated. Moreover, diclofenac can be metabolized to reactive metabolites by MPO [59] which prompted our interest to investigate its expression. As depicted in Figure 11 (panel A1-A3) expression of MPO was basically absent in control animals. Conversely, a clear dose dependent induction of MPO in low (panel B1-B3) and high dose (C1-D3) treated animals is seen. Panel B2 depicts a small granuloma with marked expression of MPO while panel C2 and C3 document hepatic lobular proliferation of polarized macrophages and the migration of activated neutrophils and monocytes from a portal field to regions of liver injury. Furthermore, a granulomatous inflammatory reaction adjacent to a central vein and the periportal inflammation of highly activated and polarized macrophages is shown in panels D1 and D2, respectively. Within the cytoplasm of macrophages prominent phagosomes are noted, and the activity of macrophages may extend to the phagocytosis of neutrophils to support resolution of drug induced inflammation as had been demonstrated in the past [60, 61]. Importantly, the blood smear test evidenced neutrophilic leukocytosis (Figure 3) in diclofenac treated animals and the phagocytosis of neutrophils will limit inflammation. Shown in panel D3 is the marked inflammatory cell infiltrate of neutrophils and macrophages with cytoplasmic and granular positivity for MPO; note the concentric plasma membrane MPO staining of granulocytes.
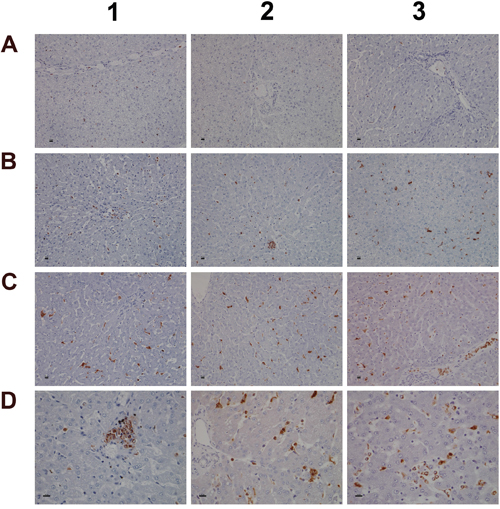
Figure 11: Immunohistochemistry staining of myeloperoxidase in liver sections of control and diclofenac treated animals after daily dosing for 28 days. (Panel A1-A3) Control animals do not express MPO. (Panel B1-B3) Low dose treatment induced MPO expression in resident Kupffer cells, macrophages and granulocytes. Panel B2 depicts a granuloma with marked MPO expression. (Panel C1 and C2) Marked proliferation and activation of hepatic lobular MPO positive macrophages of high dose treated animals. (Panel C3) Migration of polarized macrophages and granulocytes from a portal field to regions of liver injury. (Panel D1) Marked MPO expression in a granuloma of a high dose treated animal. (Panel D2) Periportal mixed inflammatory cell infiltrate with marked MPO expression. Note the enlarged macrophages and the phagocytized neutrophils. (Panel D3) Hepatic lobular mixed inflammatory cell infiltrate consisting primarily of activated/polarized macrophages, newly infiltrating (immature) macrophages and granulocytes with marked MPO expression. The bar represents 10μm.
The further explore the link between drug induced inflammation, myeloperoxidase activity and oxidative stress expression of the superoxide dismutase SOD1 and SOD2 was investigated. As shown in Figure 12 and unlike controls (panel A1-A3) a dose dependent reduction in the expression of the cytosolic Cu-Zn SOD1 was observed in low (B1-B3) and high dose (C1-C3) treated animals. Alike, SOD1 transcript expression was significantly reduced to about 40% of control values to evidence impaired superoxide anion radical detoxification induced by diclofenac treatment (data given below). Conversely and when compared to controls (D1-D3) expression of the mitochondrial Mn-SOD2 increased from low (E1-E3) to high dose treated animals (panel F1-F3), and a similar nearly 5-fold induction of the SOD2 transcript was determined. Some of the bile duct epithelia were also positive for SOD1 and SOD2 as shown in liver sections of panels C3 and E3, respectively.
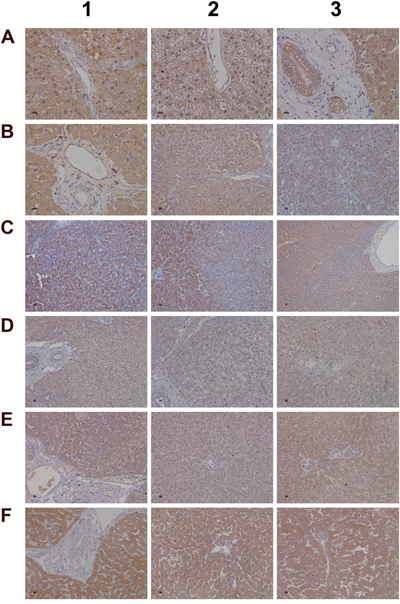
Figure 12: Immunohistochemistry staining of superoxide dismutase SOD1 and SOD2 in liver sections of control and diclofenac treated animals after daily dosing for 28 days. (Panel A1-A3) Hepatocytes of control animals express abundantly SOD1. Shown in panel A3 is bile duct epithelium also positive for SOD1. (Panel B1-B3) A slight to moderate reduced SOD1 expression is observed in low dose treated animals. Some portal macrophages display strong SOD1 expression. Note the patchier periportal (B2) and hepatic lobular expression of SOD1 (B3). (Panel C1-C3) A moderate to marked reduction in SOD1 expression is observed with high dose treated animals. (Panel D1-D3) Minimal SOD2 expression in hepatocytes of control animals. (Panel E1-E3) Portal (E1), lobular (E2) and periportal (E3) hepatic SOD2 expression is increased in low dose treated animals. (Panel F1-F3) Marked portal, lobular and periportal hepatic SOD2 expression in high dose treated animals. The bar represents 10μm.
For its importance in regulating inflammatory macrophage polarization [62] and its critical function in the control of gene expression immunohistochemistry of the transcription factor KLF6 was performed. Shown in Figure 13 panel A1-A3 are control animals with minimal to slight nuclear KLF6 expression. A dose dependent increase in the nuclear (B1-B3) and at the high dose (C1-C3) additional cytosolic expression of KLF6 was seen. Panel D1 depicts hepatic lobular inflammation in a high dose treated animal with marked inflammatory cell infiltrates (granulocytes, migrating monocytes, lymphocytes and macrophages). The granulocytes and cytotoxic lymphocytes are KLF6 negative; however, some Kupffer cells and migrating monocytes are KLF6 positive. Shown in panel D2 is a granuloma with a distinct subpopulation of macrophages expressing KLF6. Further examples are given in panel D3 and E1 with irregular, mainly bilayered trabeculae and distinct population of KLF6 positive Kupffer cells. The high power field view of panels E2 and E3 depicts prominent nuclear and some cytosolic expression of KLF6. The panels D1, C2 and D2 imply a sequence of granuloma formation with an acute inflammatory infiltrate followed by an initial granuloma formation and its subsequent consolidation.
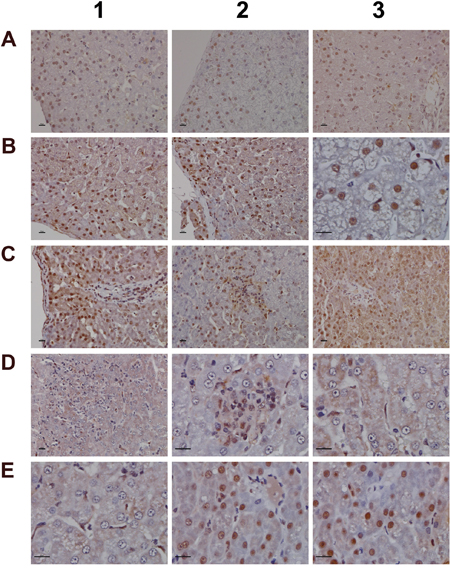
Figure 13: Immunohistochemistry staining of the Krüppel-like factor 6 in liver sections of control and diclofenac treated animals after daily dosing for 28 days. (Panel A1-A3) Shown are control animals with minimal to slight nuclear KLF6 expression. (Panel B1-B3) Increased nuclear KLF6 staining of low dose treated animals. Panel B3 is a high power field magnification with intense nuclear KLF6 expression. (Panel C1) High dose treatment induced marked nuclear expression of KLF6; additionally harmed hepatocytes show cytosolic KLF6 expression. Note expression of KLF6 in monocytes, macrophages and lymphocytes in a blood vessel and their likely migration into liver parenchyma. (Panel C2) High dose treatment. Initial granuloma formation with mixed inflammatory cell infiltrates; marked KLF6 expression in resident Kupffer cells and monocytes. (Panel C3) Marked nuclear and cytosolic expression of KLF6 in a fatty liver of a high dose treated animal. (Panel D1) Acute hepatic lobular inflammation with marked mixed inflammatory cell infiltrates in a high dose treated animal. KLF6 positive resident and immature immigrant macrophages first at the periphery of the arrosive lesion. (Panel D2) High power field magnification of a granuloma with distinct subpopulation of KLF6 expressing macrophages and infiltrating monocytes in a high dose treated animal. (Panel D3) High power field magnification of bilayered trabeculae and steatotic hepatocytes; distinct subpopulations of polarized macrophages with low and high KLF6 expression. (Panel E1-E3) High power field magnification of prominent nuclear and moderate cytosolic KLF6 expression of high dose treated animals. Note the distinct macrophage subpopulations expressing KLF6. The bar represents 10μm.
Genomic responses in liver and kidney after diclofenac treatment
Given that diclofenac inhibits cyclooxygenase activity the expression of the coding genes was investigated. We observed significant 5- and 3-fold induction of COX2 but a 50% and 40% reduction in COX1 expression in liver and kidney, respectively after repeated treatment for 28 days (Supplementary Table 3).
Whole genome gene expression profiling revealed 287 (167 up- and 120 down-) and 663 (328 up- and 335 down-) genes as significantly regulated in the liver of low and high dose treated animals with 53 genes commonly regulated among both treatments (Figure 14A and Table 1). Alike, diclofenac treatment caused 249 (106 up- and 143 down-) and 488 (255 up- and 233 down) DEGs in kidney of low and high dose treated animals of which 24 were in common (Figure 14B and Table 2). By applying the average-linkage hierarchical clustering algorithm with Euclidian distance, heatmaps for DEGs were generated. The dendogram of both liver and kidney regulated genes highlights a distinct expression pattern (control, low dose and high dose) (Figure 15A and 15B) with clusters of up-regulated genes coding for stress and immune response and cytotoxicity (cell death and apoptosis). Conversely, genes coding for lipid, hexose and protein metabolism were frequently repressed in expression in low and high dose treated animals. Tables 1 and 2 provides a summary of dose related gene regulations. As an example the lipopolysaccharide binding protein and serum amyloid A1 were induced by 3-, 33- and 3- and 62-fold, respectively, in liver of low and high dose treated animals. A similar dose related change in gene expression was observed for the kidney though the regulation of genes differed when two organs were compared (Table 2).
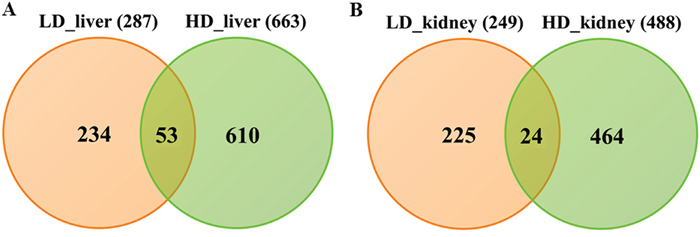
Figure 14: Differentially expressed genes after low and high dose diclofenac treatment. (Panel A) Venn diagram of hepatic DEGs after low (1 mg/kg/day) and high dose (3 mg/kg/day) treatment for 28 days. A total of 53 genes are regulated in common. (Panel B) Venn diagram of kidney DEGs after low and high dose treatment. A total of 249 and 488 genes were significantly regulated in low and high dose treatment, of which 24 were commonly regulated.
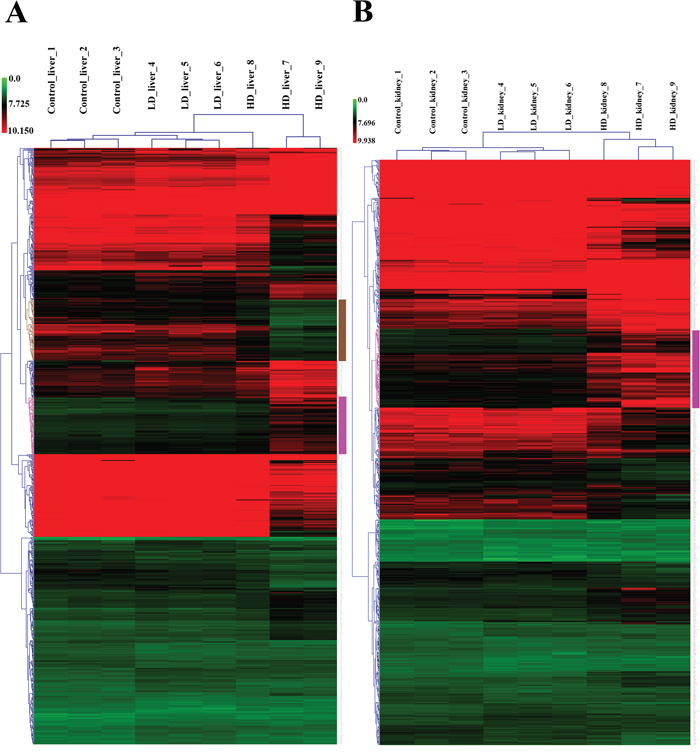
Figure 15: Heatmap of differentially expressed genes in liver and kidney of diclofenac treated dogs. Shown is the hierarchical gene clustering of DEGs in liver (Panel A) and kidney (Panel B). The heatmap was generated with the MeV software and an average-linkage hierarchical clustering with Euclidean distance was applied. Depicted are the signal intensity values of regulated DEGs. The low and high dose treatment groups were clearly segregated from the controls. The magenta colored dendrogram depicts clusters of DEGs involved in the biological processes stress, immune responses and cell death. Likewise, the brown colored dendrogram shows clustering of metabolic genes which were repressed in expression after diclofenac treatment.
Table 2: Commonly regulated genes in kidney after low and high-dose diclofenac treatment
Gene Symbol |
Gene description |
Fold change_LD (average±SD) |
Fold change_HD (average±SD) |
|---|---|---|---|
ACMSD |
Aminocarboxymuconate semialdehyde decarboxylase |
1.58±0.18 |
-2.21±1.04 |
ARMC3 |
Armadillo repeat containing 3 |
-1.78±0.73 |
-2.41±0.96 |
BCL2A1 |
BCL2-related protein A1 |
1.54±0.32 |
2.36±0.95 |
CLK1 |
CDC-like kinase 1 |
-1.62±0.3 |
-1.9±0.33 |
DMGDH |
Dimethylglycine dehydrogenase |
-1.54±0.76 |
-2.32±0.68 |
DNASE1 |
Deoxyribonuclease I |
-1.92±0.81 |
-3.71±2.34 |
DPT |
Dermatopontin |
-1.5±0.43 |
-2.27±0.58 |
EGFLAM |
EGF-like, fibronectin type III and laminin G domains |
-1.96±0.53 |
-2.76±2.81 |
ELSPBP1 |
Epididymal sperm binding protein 1 |
-1.56±0.11 |
1.94±0.31 |
ENPP6 |
Ectonucleotide pyrophosphatase / phosphodiesterase 6 |
-2.08±1.59 |
-2.38±2.43 |
FGGY |
FGGY carbohydrate kinase domain containing |
-2.19±0.24 |
-2.18±0.13 |
FMO1 |
Flavin containing monooxygenase 1 |
2.23±0.76 |
-2.33±0.54 |
KLHDC1 |
Kelch domain containing 1 |
-1.52±0.18 |
-1.87±0.21 |
RBP2 |
Retinol binding protein 2 |
1.79±0.14 |
-8.79±2.36 |
RPS24 |
Ribosomal protein S24 |
1.88±0.25 |
1.87±0.14 |
S100A10 |
S100 calcium binding protein A10 |
1.6±0.46 |
2.82±1.44 |
SDC4 |
Syndecan 4 |
1.79±0.14 |
2.58±0.97 |
SLC12A2 |
Solute carrier family 12, member 2 |
2.1±0.24 |
5.09±1.05 |
SLC5A12 |
Solute carrier family 5, member 12 |
-1.54±0.06 |
-2.69±3.29 |
SLC5A8 |
Solute carrier family 5, member 8 |
-1.86±0.22 |
-2.5±0.99 |
SNAP25 |
Synaptosome associated protein 25 |
1.54±0.15 |
1.88±0.66 |
UBE2J1 |
Ubiquitin Conjugating Enzyme E2 J1 |
-1.52±0.2 |
2.29±0.64 |
ZFAND5 |
Zinc finger, AN1-type domain 5 |
1.66±0.08 |
2.03±0.53 |
ZFP92 |
Zinc finger protein 92 |
1.6±0.18 |
1.88±0.35 |
A total of 24 statistically significant DEGs were regulated in common amongst low and high dose diclofenac treatment.
Functional enrichment analysis
About 92% of DEGs could be mapped to the human genome and were used for enrichment analysis. DEGs were submitted to the GO, KEGG and BioCarta databases to define over-represented ontology terms, and the p-values given in Table 3 and 4 were obtained using a hypergeometric testing strategy. Specifically, the immune, inflammation, acute phase and stress response were highly regulated biological processes and involved 225 DEGs (Supplementary Table 3). Unlike the low dose for which cell cycle was a significantly enriched term the high dose treatments alerted to cell death and involved genes coding for redox stress and glutathione homeostasis (GCL, GGT, GSTs, GPX, SOD1, SOD2, Thioredoxins). Alike, cytokine stimulus, xenobiotic metabolism and defence were significantly enriched terms as was glucose and lipid metabolism, PPAR signaling and fatty acid oxidation (Table 3). Note, histopathology of diclofenac treated animals revealed hepatic steatosis and Table 5 compiles drug induced steatosis regulated genes. For instance the lipid droplet associated PLIN2 and the very long chain fatty acids protein 2 were induced by 8- and 10-fold; in fact >40 genes coding for lipogenesis, lipid transport, lipid droplet growth ER stress and fatty acid oxidation were affected to signify major changes in lipid homeostasis. The data also revealed an approximate 4-fold induction of FGF21, and this growth factor is known to ameliorate hepatic steatosis. Supplementary Figures 1-4 summarize significantly enriched ontology terms by considering molecular, cellular and biological functions of DEGs regulated in liver and kidney.
Table 3: Enriched biological processes and pathways in liver after diclofenac treatment
GO ID |
Biological process |
Low dose |
High dose |
||
|---|---|---|---|---|---|
No of genes (% associated genes with term) |
P-value |
No of genes (% associated genes with term) |
P-value |
||
GO:0006955 |
Immune response |
22 (1.41%) |
2.95E-04 |
47 (3.01%) |
6.40E-05 |
GO:0006950 |
Response to stress |
54 (1.51%) |
9.16E-05 |
145 (4.04%) |
6.54E-14 |
GO:0006954 |
Inflammatory response |
8 (1.21%) |
0.03136 |
25 (3.78%) |
1.01E-04 |
GO:0006953 |
Acute phase response |
4 (8.51%) |
6.51E-06 |
8 (17.02%) |
3.56E-08 |
GO:0055114 |
Oxidation-reduction process |
21 (1.92%) |
0.00771 |
86 (7.86%) |
2.24E-18 |
GO:0034097 |
Response to cytokine stimulus |
13 (1.63%) |
0.01576 |
37 (4.64%) |
7.94E-08 |
GO:0001666 |
Response to hypoxia |
9 (3.19%) |
0.03945 |
20 (7.09%) |
0.00293 |
GO:0006952 |
Defense response |
23 (1.58%) |
2.21E-04 |
57 (3.90%) |
1.78E-06 |
GO:0007049 |
Cell cycle |
22 (1.28%) |
0.00354 |
9 (0.52%) |
0.00799 |
GO:0010941 |
Regulation of cell death |
57 (3.77%) |
0.00928 |
||
GO:0006805 |
Xenobiotic metabolic process |
7 (7.37%) |
0.00927 |
27 (28.42%) |
1.30E-15 |
GO:0006629 |
Lipid metabolic process |
27 (2.02%) |
0.00297 |
86(6.43%) |
1.25E-18 |
GO:0019318 |
Hexose metabolic process |
8 (3.33%) |
0.00884 |
20 (8.33%) |
2.03E-06 |
GO:0006096 |
Glycolysis |
4 (5.33%) |
0.00345 |
5 (6.67%) |
0.00902 |
GO:0035357 |
PPAR signaling pathway |
4 (5.56%) |
0.03425 |
14 (19.44%) |
0.000003 |
GO:0038061 |
NF-kB signaling |
3 (2.73%) |
0.04808 |
7 (6.36%) |
0.114357 |
GO:0006635 |
Fatty acid beta oxidation |
4 (5.63%) |
0.00157 |
9 (12.68%) |
9.21E-05 |
GO:0038093 |
Fc receptor signaling pathway |
7 (2.88%) |
0.00851 |
||
GO:0000165 |
MAPK cascade |
7 (0.81%) |
0.02193 |
7 (0.81%) |
0.676457 |
hsa04151 |
PI3K-AKT signaling pathway |
15 (4.40%) |
0.671795 |
||
hsa04152 |
AMPK signaling pathway |
8 (6.45%) |
0.164278 |
||
Gene ontologies were analyzed with the GeneXplain and ClueGO database; statistically significantly enriched biological processes were considered at a p-value < 0.05. The percentage of genes associated with biological terms and pathways were calculated with the AmiGO 2 software (http://amigo.geneontology.org/amigo/landing) and KEGG repository data entries.
Table 4: Enriched biological processes and pathways in kidney after diclofenac treatment
GO ID |
Biological process |
Low dose |
High dose |
||
|---|---|---|---|---|---|
No of genes (% associated genes with term) |
P-value |
No of genes (% associated genes with term) |
P-value |
||
GO:0006955 |
Immune response |
41 (2.63%) |
6.66E-07 |
||
GO:0006959 |
Humoral immune response |
4 (1.76%) |
0.04546 |
13 (5.73%) |
1.50E-07 |
GO:0006954 |
Inflammatory response |
19 (2.87%) |
3.43E-04 |
||
GO:0006950 |
Response to stress |
111 (3.10%) |
3.12E-12 |
||
GO:0055114 |
Oxidation-reduction process |
16 (1.46%) |
0.04881 |
46 (4.20%) |
2.12E-07 |
GO:0001666 |
Response to hypoxia |
16 (5.67%) |
8.86E-04 |
||
GO:0034097 |
Response to cytokine stimulus |
36 (4.52%)) |
1.63E-16 |
||
GO:0019221 |
Cytokine-mediated signaling pathway |
16 (2.93%) |
5.31E-04 |
||
GO:0009611 |
Response to wounding |
32 (5.07%) |
4.85E-08 |
||
GO:0006805 |
Xenobiotic metabolic process |
11 (11.58%) |
1.04E-04 |
||
GO:0000075 |
Cell cycle checkpoint |
6 (2.70%) |
0.03000 |
12 (5.41%) |
0.00852 |
GO:0051726 |
Regulation of cell cycle |
16 (1.58%) |
0.01735 |
16 (1.58%) |
4.96E-04 |
GO:0010941 |
Regulation of cell death |
54 (3.57%) |
2.65E-05 |
||
GO:0097190 |
Apoptotic signalling pathway |
16 (2.77%) |
5.97E-04 |
||
GO:0006952 |
Defense response |
52 (3.56%) |
7.89E-08 |
||
GO:0006629 |
Lipid metabolic process |
20 (1.49%) |
0.03631 |
67 (5.01%) |
5.95E-16 |
GO:0006635 |
Fatty acid β-oxidation |
3 (4.22%) |
0.02734 |
3 (4.23%) |
0.00923 |
GO:0019318 |
Hexose metabolic process |
15 (6.25%) |
5.56E-05 |
||
GO:0019538 |
Protein metabolic process |
91 (1.65%) |
0.02606 |
||
GO:0055085 |
Transmembrane transport |
19 (1.34%) |
0.01840 |
47 (3.31%) |
2.18E-08 |
GO:0006956 |
Complement activation |
12 (10.08%) |
4.33E-13 |
||
GO:0035357 |
PPAR signaling pathway |
4 (5.56%) |
0.01541 |
13 (18.06%) |
3.9000E-07 |
hsa04910 |
Insulin signaling pathway |
9 (6.43%) |
0.01732371 |
||
hsa04066 |
HIF-1 signaling pathway |
9 (8.74%) |
0.00341 |
||
hsa04920 |
Adipocytokine signaling pathway |
4 (5.71%) |
0.00990 |
11 (15.71%) |
4.4600E-06 |
hsa04151 |
PI3K-AKT signaling pathway |
19 (5.57%) |
0.00717776 |
||
Gene ontologies were analyzed with the GeneXplain and ClueGO database; statistically significantly enriched biological processes were considered at a p-value < 0.05. The percentage of genes associated with biological terms and pathways were calculated with the AmiGO 2 software (http://amigo.geneontology.org/amigo/landing) and KEGG repository data entries.
Table 5: Drug induced steatosis regulated genes in liver and kidney after diclofenac treatment
Gene |
Gene description |
Liver |
Kidney |
||
|---|---|---|---|---|---|
LD |
HD |
LD |
HD |
||
Fold change (average)±SD |
|||||
Lipogenesis |
|||||
ACACB |
Acetyl-CoA carboxylase beta |
1.65±0.25* |
-1.37±0.02 |
-1.02±0.3 |
-3.82±1.85* |
ELOVL2 |
ELOVL fatty acid elongase 2 |
4.01±1.67* |
9.75±3.04* |
1.23±0.1 |
-2.03±1.09* |
FADS1 |
Fatty acid desaturase 1 |
-1.07±0.05 |
1.04±0.07 |
-1.04±0.11 |
2.68±0.82* |
FASN |
Fatty acid synthase |
-1.74±0.42* |
-1.23±0.2 |
-1.12±0.07 |
-4.87±2.22* |
INSIG1 |
Insulin induced gene 1 |
1.27±0.07 |
1.57±0.2* |
1.02±0.04 |
-2.17±0.81* |
LAMA1 |
Laminin subunit alpha 1 |
-1.06±0.15 |
-1.88±0.22* |
1.17±0.16 |
-3.68±2.24* |
MLXIPL |
MLX interacting protein like |
-1.24±0.21 |
-3.39±2.17* |
1.01±0.01 |
-1.14±0.18 |
NCEH1 |
Neutral cholesterol ester hydrolase 1 |
-1.01±0.08 |
-2.44±1.29* |
-1.06±0.03 |
-1.09±0.03 |
UGCG |
UDP-glucose ceramide glucosyltransferase |
-1.17±0.13 |
1.29±0.3 |
-1.08±0.05 |
3.69±1.48* |
Fatty acid oxidation/mitochondrial stress |
|||||
ACSL1 |
Acyl-CoA synthetase long-chain family member 1 |
-1.01±0.05 |
-1.22±0.18 |
1.03±0.03 |
-4.23±2.01* |
ACSL3 |
Acyl-CoA synthetase long-chain family member 3 |
-1.12±0.09 |
2.06±0.06* |
1.39±0.06 |
1.63±0.06* |
ACSL4 |
Acyl-CoA synthetase long-chain family member 4 |
-1.62±0.24 |
2.65±0.96* |
1.08±0.12 |
6.25±3.38* |
ACSL6 |
Acyl-CoA synthetase long-chain family member 6 |
1.66±0.21* |
1.2±0.67 |
1.23±0.2 |
-1.95±0.44* |
CLIC1 |
Chloride intracellular channel 1 |
1.1±0.06 |
1.92±0.59* |
-1.06±0.04 |
3.11±0.98* |
CPT1A |
Carnitine palmitoyltransferase 1A |
-1.06±0.03 |
-1.14±0.09 |
1±0.02 |
2.22±0.9* |
Lipid transport |
|||||
CD36 |
CD36 Molecule |
1±0.03 |
-2.03±1.77* |
-1.21±0.07 |
-1.51±0.30* |
FABP1 |
Fatty acid binding protein 1 |
4.66±2.72* |
1.64±4.19 |
-1±0.03 |
-2.61±1.29 |
FABP7 |
Fatty acid binding protein 7 |
1.88±0.15* |
2.34±0.98* |
1.12±0.1 |
-1.12±0.06 |
SLC27A2 |
Solute carrier family 27 member 2 |
-1.15±0.07 |
-2.68±2.07* |
-1.27±0.04 |
-3.56±2.52* |
LD growth/ER stress |
|||||
APOE |
Apolipoprotein E |
1.17±0.12 |
3.6±0.6* |
-1.01±0.12 |
-1.2±0.06 |
ERLIN1 |
ER lipid raft associated 1 |
1.02±0.02 |
2.25±0.78* |
1.12±0.12 |
1.25±0.2 |
MGLL |
Monoglyceride lipase |
1.03±0.06 |
-3.05±4.32* |
1.04±0.05 |
-1.53±0.28 |
PLIN2 |
Perilipin 2 |
1.65±0.26* |
8.11±4.19* |
1.41±0.3 |
2.26±1.21* |
TIMP1 |
TIMP metallopeptidase inhibitor 1 |
1.04±0.06 |
18.9±13.11 |
-1.06±0.03 |
12.05±2.55* |
Lipid metabolism marker genes |
|||||
FGF21 |
Fibroblast growth factor 21 |
1.64±0.44* |
3.87±1.56* |
1.03±0.05 |
-1.01±0.02 |
GLUD1 |
Glutamate dehydrogenase 1 |
1.08±0.09 |
-2.3±1* |
1.02±0.02 |
-1.21±0.11 |
GPT |
Glutamic-pyruvic transaminase |
-1.14±0.11 |
-2.2±0.59* |
1.17±0.13 |
-2.28±0.06* |
KRT18 |
Keratin 18 |
-1.02±0.06 |
2.52±0.06* |
1.23±0.08 |
2.68±0.06* |
KRT8 |
Keratin 8 |
1.13±0.09 |
3.09±1.18* |
1.1±0.06 |
2.54±0.81* |
Signalling events |
|||||
ARG2 |
Arginase 2 |
1.06±0.05 |
2.18±0.39* |
1.04±0.01 |
3.39±1.44* |
CXCL14 |
C-X-C Motif chemokine ligand 14 |
-1.05±0.06 |
1.01±0.05 |
-1.28±0.17 |
2.01±0.71* |
HIF1A |
Hypoxia Inducible factor 1 alpha subunit |
1.18±0.03 |
3.71±2.86* |
1±0.01 |
5.21±2.13* |
PEBP1 |
Phosphatidylethanolamine binding protein 1 |
-1.09±0.07 |
-2.54±1.43* |
-1.04±0.03 |
-1.24±0.08 |
PRKAA1 |
Protein kinase AMP-activated catalytic subunit alpha 1 |
1.08±0.12 |
3.39±1.35* |
-1.04±0.02 |
1.11±0.06 |
SERPINE2 |
Serpin family E member 2 |
-1.08±0.23 |
3.77±1.85* |
-1.2±0.12 |
-1.09±0.36 |
STAT1 |
Signal transducer and activator of transcription 1 |
1.04±0.06 |
4.06±1.7* |
-1.04±0.06 |
-1.18±0.23 |
STAT3 |
Signal transducer and activator of transcription 3 |
-1.15±0.03 |
2.37±0.69* |
-1.07±0.04 |
2.25±0.99* |
TLR4 |
Toll like receptor 4 |
1.04±0.02 |
2.11±0.74* |
-1.08±0.14 |
-1-11±0.23 |
Glucose metabolism |
|||||
CES1 |
Carboxylesterase 1 |
1.14±0.06 |
-2.87±1.35* |
-1.15±0.02 |
-3.86±2.09* |
GK |
Glycerol kinase |
1.58±0.36* |
3.06±0.67* |
1.03±0.05 |
-1.64±0.15 |
PKLR |
Pyruvate kinase, Liver and RBC |
-1.78±0.38* |
-8.22±5.31* |
1.04±0.07 |
-1.42±0.48 |
Based on mechanistically linked and lipid droplet associated gene regulations, a total of 41 DEGs were identified [228, 229].
* Statistically significant.
Diclofenac treatment caused similar but also organ specific genomic responses (Table 6) and a list of commonly regulated genes in liver and kidney was compiled. Given in Table 6 are 106 DEGs that could be categorized based on significantly enriched ontology terms. Among others the transferrin receptor, the early growth response 1, asparaginase synthase, cyclin dependent kinase inhibitor 1 and LY6E were regulated by 6-, 4-,5- and 4-fold in the liver, respectively, to indicate inflammation and cell death responses. With the exception of LY6E, however, the magnitude of regulation in kidney was approximatively half of that seen in liver. Conversely, the induction of gap junction protein ß2 and HIF1α was more pronounced in kidney as was the repression of the sulfotransferase 1B member 1; the latter supports excretion of drugs. Another highly regulated gene is the aldo-keto reductase family 1 member C3 (AKR1C3). This enzyme catalyzes metabolism of prostaglandin D2 to 9α, 11β-PGF2 and is a major prostaglandin released by mast cells to promote inflammation (Figure 9). This prostaglandin is therefore a sensitive marker of mast cell activation [63].
Table 6: Commonly regulated genes in liver and kidney after diclofenac treatment
Gene symbol |
Gene Description |
HD_liver |
HD_kidney |
|---|---|---|---|
Fold change (average)±SD |
|||
Inflammatory response |
|||
APOC3 |
Apolipoprotein C3 |
-3.55±1.03 |
-2.05±1.95 |
CCL20 |
C-C motif chemokine ligand 20 |
7.28±3.13 |
2.54±1.13 |
CD163 |
CD163 molecule |
2.3±0.89 |
2.27±0.2 |
FCGR1A (IgG) |
Fc fragment of IgG receptor Ia |
3.54±1.66 |
2.72±0.94 |
PTGS2 |
Prostaglandin-endoperoxide synthase 2 |
5.34±2.54 |
2.91±1.37 |
STAT3 |
Signal transducer and activator of transcription 3 |
2.37±0.69 |
2.25±0.99 |
TFRC (CD71) |
Transferrin receptor |
6.33±1.49 |
2.86±0.57 |
Response to oxidative stress |
|||
AKR1C3 |
Aldo-keto reductase family 1 member C3 |
-14.39±9.74 |
-2.04±1.4 |
BTG3 |
BTG anti-proliferation factor 3 |
4.17±1.94 |
2.32±0.7 |
GJB2 |
Gap junction protein beta 2 |
3.35±1.06 |
7.97±5.58 |
HIF1A |
Hypoxia inducible factor 1 alpha subunit |
3.71±2.86 |
5.21±2.61 |
NQO1 |
NAD(P)H quinone dehydrogenase 1 |
-2.77±1.98 |
-2.37±0.48 |
SOD1 |
Superoxide dismutase 1 |
-2.46±0.97 |
-1.68±0.15 |
Oxidation-reduction process |
|||
ACSS1 |
Acyl-CoA synthetase short-chain family member 1 |
2.5±1.01 |
2.12±0.88 |
AKR1E2 |
Aldo-keto reductase family 1 member E2 |
-2.7±3.82 |
-2.6±2.99 |
ALDH1B1 |
Aldehyde dehydrogenase 1 family member B1 |
-5.24±1.26 |
-2.09±1.19 |
CRYL1 |
Crystallin lambda 1 |
-3.02±0.81 |
-2.1±1.81 |
CYP4V2 |
Cytochrome P450 family 4 subfamily V member 2 |
-2.78±2.86 |
-2.43±1.55 |
DMGDH |
Dimethylglycine dehydrogenase |
-3.36±1.4 |
-2.32±0.68 |
FTH1 |
Ferritin heavy chain 1 |
-2.54±2.38 |
-2.01±0.59 |
G6PC |
Glucose-6-phosphatase catalytic subunit |
-2.2±1.08 |
-2.86±1.15 |
GPD1 |
Glycerol-3-phosphate dehydrogenase 1 |
-5.11±1.9 |
-1.92±0.38 |
HSD17B14 |
Hydroxysteroid 17-beta dehydrogenase 14 |
-2.61±2.87 |
-2±1.09 |
SLC27A2 |
Solute carrier family 27 member 2 |
-2.68±2.07 |
-3.56±2.52 |
TST |
Thiosulfate sulfurtransferase |
2.34±0.68 |
1.88±0.66 |
Response to stress |
|||
ABHD2 |
Abhydrolase domain containing 2 |
2.05±0.46 |
1.92±0.51 |
UPP1 |
Uridine phosphorylase 1 |
7.84±1.94 |
6.19±0.49 |
VWF |
Von Willebrand factor |
4.22±1.71 |
1.91±0.31 |
Xenobiotic metabolic process |
|||
CES1 |
Carboxylesterase 1 |
-2.87±1.35 |
-3.86±2.09 |
EPHX1 |
Epoxide hydrolase 1 |
-3.73±6.87 |
-1.91±0.88 |
GSTM3 |
Glutathione S-transferase mu 3 |
-9.55±1.75 |
2.34±0.25 |
GSTZ1 |
Glutathione S-transferase zeta 1 |
-2.51±1.86 |
-2.1±0.45 |
NR1I3 (CAR) |
Nuclear receptor subfamily 1 group I member 3 |
-2.04±0.97 |
-1.94±0.74 |
SULT1A1 |
Sulfotransferase family 1A member 1 |
-2.69±1.83 |
-2.33±0.41 |
SULT1B1 |
Sulfotransferase family 1B member 1 |
-2.35±0.75 |
-6.53±1.94 |
Cytokine-mediated signaling pathway |
|||
EGR1 |
Early growth response 1 |
6.6±3 |
2.36±1.13 |
IL13RA1 |
Interleukin 13 receptor subunit alpha 1 |
2.87±1.18 |
2.73±0.81 |
KRT18 |
Keratin 18 |
3.01±1.33 |
2.68±0.69 |
KRT8 |
Keratin 8 |
3.3±1.6 |
2.62±0.99 |
PLP2 |
Proteolipid protein 2 |
2.07±0.65 |
2.42±0.35 |
Response to cytokine |
|||
ARG2 |
Arginase 2 |
2.18±0.48 |
3.39±1.44 |
HNMT |
Histamine N-methyltransferase |
-2.09±1.79 |
-1.98±0.8 |
Complement activation |
|||
C5 |
Complement C5 |
2.71±1.03 |
2.2±0.53 |
CFI |
Complement factor I |
3.05±0.86 |
2.15±0.61 |
Defense response |
|||
CD46 |
CD46 molecule |
2.49±1.19 |
2.54±0.98 |
CXADR |
Coxsackie virus and adenovirus receptor |
2.24±0.59 |
2.3±0.25 |
HERC6 |
HECT and RLD domain containing E3 ubiquitin protein ligase family member 6 |
-2.36±0.67 |
2.06±0.24 |
LY6E |
Lymphocyte antigen 6 complex, locus E |
-4.34±2.11 |
-3.63±1.32 |
PRKCSH |
Protein kinase C substrate 80K-H |
2.59±0.99 |
3.52±1.12 |
Cell cycle regulation |
|||
CENPM |
Centromere protein M |
-2.32±1.56 |
-2.91±1.38 |
CENPP |
Centromere protein P |
-2.49±2.03 |
-2.37±0.96 |
Regulation of cell death and apoptosis |
|||
ASNS |
Asparagine synthetase (glutamine-hydrolyzing) |
4.63±1.48 |
2.27±0.48 |
CDKN1A |
Cyclin dependent kinase inhibitor 1A |
5.1±1.17 |
2.64±0.36 |
CLDN7 |
Claudin 7 |
2.26±0.36 |
2.75±0.94 |
CSTB |
Cystatin B |
4.1±1.89 |
3.43±0.8 |
CYLD |
CYLD lysine 63 deubiquitinase |
2.12±0.9 |
2.01±0.41 |
DNAJC3 |
DnaJ heat shock protein family (Hsp40) member C3 |
4.49±2.5 |
2.03±0.72 |
DNASE1 |
Deoxyribonuclease 1 |
-2.89±1.91 |
-3.71±2.34 |
GABRB3 |
Gamma-aminobutyric acid type A receptor beta3 subunit |
-2.04±1.52 |
-1.96±0.52 |
LITAF |
Lipopolysaccharide induced TNF factor |
2.04±0.52 |
2.02±0.03 |
MCL1 |
BCL2 family apoptosis regulator |
2.75±1.24 |
2.03±0.53 |
PDXK |
Pyridoxal (pyridoxine, vitamin B6) kinase |
2.08±0.77 |
2.43±0.96 |
PLK2 |
Polo like kinase 2 |
3.23±1.58 |
-2.17±1.34 |
RGN |
Regucalcin |
-3.24±2.28 |
-2.4±0.5 |
SDF2L1 |
Stromal cell derived factor 2 like 1 |
7.33±4.14 |
2.18±0.61 |
Lipid metabolic process |
|||
ABCB4 |
ATP binding cassette subfamily B member 4 |
2.15±0.73 |
3.08±1.61 |
ACSM3 |
Acyl-CoA synthetase medium-chain family member 3 |
-2.72±1.44 |
-2.24±1.26 |
CRLS1 |
Cardiolipin synthase 1 |
-2.38±1.52 |
-2.38±1.06 |
ELOVL2 |
ELOVL fatty acid elongase 2 |
9.75±3.04 |
-2.03±1.09 |
IDI1 |
Isopentenyl-diphosphate delta isomerase 1 |
-2.08±0.49 |
-4.2±0.23 |
LRAT |
Lecithin retinol acyltransferase |
-2.7±3.2 |
-7.21±2.82 |
MOGAT3 |
Monoacylglycerol O-acyltransferase 3 |
-2.7±2.17 |
-2.69±1.79 |
NANS |
N-acetylneuraminate synthase |
-3.89±2.28 |
2.16±0.74 |
OXCT1 |
3-oxoacid CoA-transferase 1 |
-6.24±3.46 |
-1.98±0.59 |
PLIN2 |
Perilipin 2 |
8.11±4.19 |
2.26±1.21 |
TIMP1 |
TIMP metallopeptidase inhibitor 1 |
18.9±13.11 |
12.05±2.55 |
Amino acid metabolic process |
|||
ACMSD |
Aminocarboxymuconate semialdehyde decarboxylase |
-2.1±1.45 |
-2.21±1.04 |
AGMAT |
Agmatinase |
-3.61±7.29 |
-3.45±3.4 |
GLYAT |
Glycine-N-acyltransferase |
-4.08±8.57 |
-2.25±0.86 |
GPT |
Glutamic--pyruvic transaminase |
-2.2±0.59 |
-2.28±0.06 |
PPA1 |
Pyrophosphatase (inorganic) 1 |
2.07±0.64 |
2.67±1.05 |
UPB1 |
Beta-ureidopropionase 1 |
-2.43±2.71 |
-2.65±0.73 |
Protein metabolism |
|||
FUOM |
Fucose mutarotase |
-3.27±2.71 |
-2.12±0.36 |
TRAM1 |
Translocation associated membrane protein 1 |
5.72±3.12 |
1.92±0.65 |
WEE2 |
WEE1 homolog 2 |
-3.4±3.14 |
-2.17±0.51 |
Fructose metabolism |
|||
FBP1 |
Fructose-bisphosphatase 1 |
-3.09±1.97 |
-1.9±1.08 |
GLYCTK |
Glycerate kinase |
-2.01±1.82 |
-1.88±0.69 |
Anion transport |
|||
AGXT |
Alanine-glyoxylate aminotransferase |
-4.25±2.92 |
-1.94±0.25 |
SLC12A4 |
Solute carrier family 12 member 4 |
2.75±1.41 |
1.94±0.19 |
SLC16A4 |
Solute carrier family 16 member 4 |
-3.26±1.12 |
-2.21±1.08 |
SLC1A4 |
Solute carrier family 1 member 4 |
7.41±4.58 |
1.94±0.66 |
Transporter activity |
|||
AQP11 |
Aquaporin 11 |
-2.45±3.67 |
-2.57±2.07 |
MVP |
Major vault protein |
2.86±1.06 |
2.65±0.41 |
NIPAL1 |
NIPA like domain containing 1 |
-2.39±0.09 |
-2.64±0.72 |
RBP5 |
Retinol binding protein 5 |
-2.85±7.37 |
-3.35±1.41 |
SFT2D2 |
SFT2 domain containing 2 |
2.31±0.54 |
1.88±0.68 |
Transcriptional activation of mitochondrial biogenesis |
|||
MRPL22 |
Mitochondrial ribosomal protein L22 |
2.02±0.39 |
2.06±0.72 |
PPRC1 |
Peroxisome proliferator-activated receptor gamma, coactivator-related 1 |
2.73±1.12 |
2.06±0.54 |
Extracellular matrix organization |
|||
CRISPLD2 |
Cysteine rich secretory protein LCCL domain containing 2 |
3.78±1.83 |
3.58±2.09 |
ECM2 |
Extracellular matrix protein 2 |
-4.39±2.21 |
-4.06±2 .0 |
Regulation of epithelial cell differentiation and proliferation |
|||
PBLD |
Phenazine biosynthesis like protein domain containing |
-4.23±6.9 |
-2.92±1.34 |
TAGLN2 |
Transgelin 2 |
2.59±1 |
2.08±0.47 |
Cell junction assembly |
|||
CD151 |
CD151 molecule (Raph blood group) |
2.19±0.77 |
2.4±0.57 |
DSG1 |
Desmoglein 1 |
-3.91±2.69 |
-3.23±2.58 |
Circadian rhythm |
|||
BHLHE41 |
Basic helix-loop-helix family member e41 |
-2.33±0.24 |
-2.84±1.37 |
DBP |
D-box binding PAR bZIP transcription factor |
-2.49±1.29 |
-3.12±1.67 |
The highly significant repression and near complete silencing of AKR1C3 implies an adaptive response to the mastocytosis induced by diclofenac treatment (Figure 5). Similarly, an induced expression of cystatin B suggests differentiation of monocytes into macrophages, and an independent study showed LPS treatment of human monocytes to induce cystatin B expression [64]. Indeed, the >30-fold induction of LBP in the liver of diclofenac treated animals highlights activation of the innate immune response though cystatin B may also function as an inhibitor of apoptosis as reported by others [65]. Testimony to drug induced inflammation is also the 19- and 12-fold induction of TIMP1, an inhibitor of metalloproteinases in liver and kidney. TIMP1 is highly induced by cytokines and was shown to inhibit cytokine dependent activation of NF-kappaB in pancreatic islets and beta-cells [66].
Furthermore, histopathology revealed almost complete depletion of hepatic glycogen in high dose treated animals to imply drug induced stress (Figure 5). We therefore investigated key member in glycogen synthesis and metabolism but only a small number of genes were significantly regulated (Supplementary Table 1); notwithstanding, the gene coding for the rate limiting step in glycolysis, i.e. PKLR was highly significantly repressed in expression to nearly 10% of control animals.
Upon diclofenac treatment various signaling pathways were regulated in liver and kidney (Supplementary Table 4) and included a 3-fold induction of glycerol kinase (GK). Note, GK is a key enzyme in triglyceride and glycerophospholipid synthesis and the near 4- and 3-fold repression of apolipoprotein C3 and the sterol carrier protein 2 define altered PPAR signaling. Alike, members of the PI3K-Akt pathway were regulated as shown by the 5-fold induction of the cyclin dependent kinase inhibitor 1A (p21) that blocks cell cycle progression, the >4-fold repression of insulin like growth factor 1 and the 4-fold induction of the Von Willebrand factor. Moreover, the 8- and 5-fold induction of the interleukin 1 receptor type 1 and 2 and the nearly 90% repression of the heat-shock cognate protein HSPA8 are testimony to an altered MAPK signaling pathway. Besides Fcγ receptor signaling was changed as demonstrated by the 4-fold induced expression of the Fc fragment of the IgG receptor Ia. Importantly, this receptor is strongly expressed on monocytes and macrophages and interacts with the Fc-fragment of IgG to adjust immune responses (Supplementary Table 4).
A visualization of liver and kidney enriched pathway terms and biological processes computed with the ClueGo and the GeneXplain software is shown for high dose treated animals in Figures 16 and 17, and Supplementary Figures 5 and 6 inform on the low dose treatments.
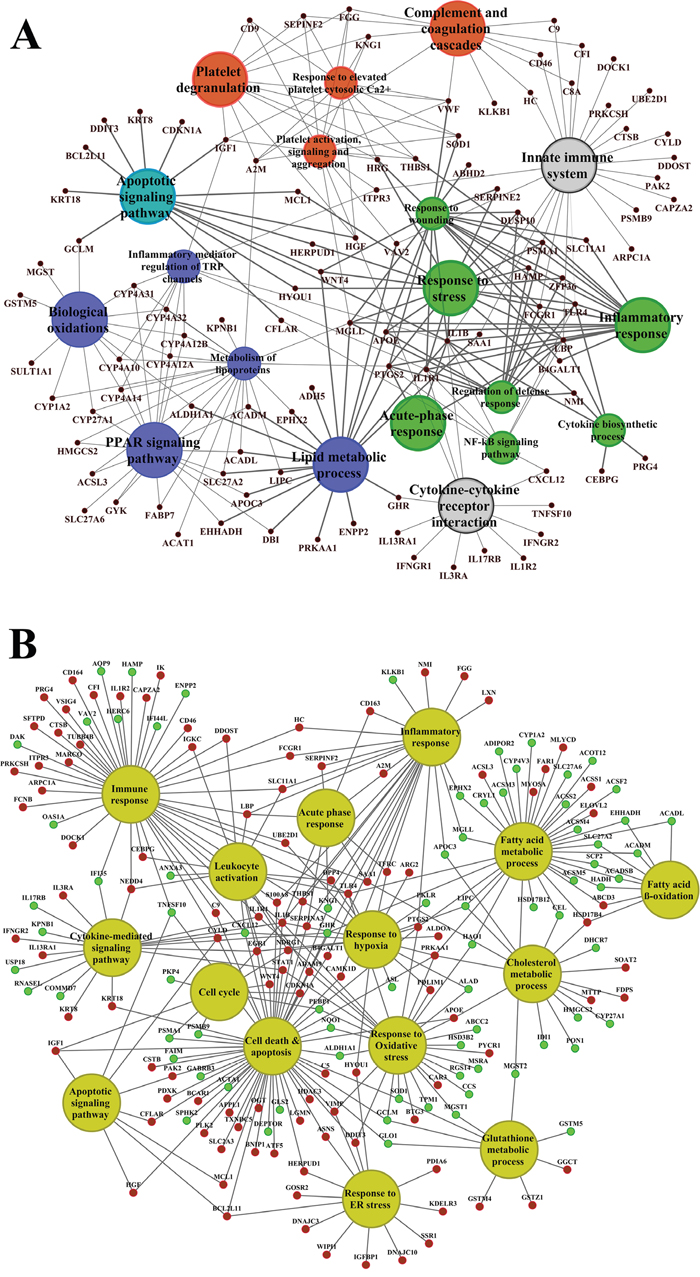
Figure 16: ClueGO gene ontology and pathway annotated hepatic networks in response to high dose diclofenac treatment. A visualization of hepatic enriched pathway terms and biological processes computed with the ClueGo and the GeneXplain software of high dose treated animals. (Panel A) Network constructed by the plug-in ClueGO of the Cytoscape software. (Panel B) Network constructed manually using the GeneXplain platform. The enriched biological processes and pathways annotated with the GeneXplain platform and visualized with the Cytoscape software version 3.4. The red and green color nodes illustrate up- and down- regulated genes, respectively.
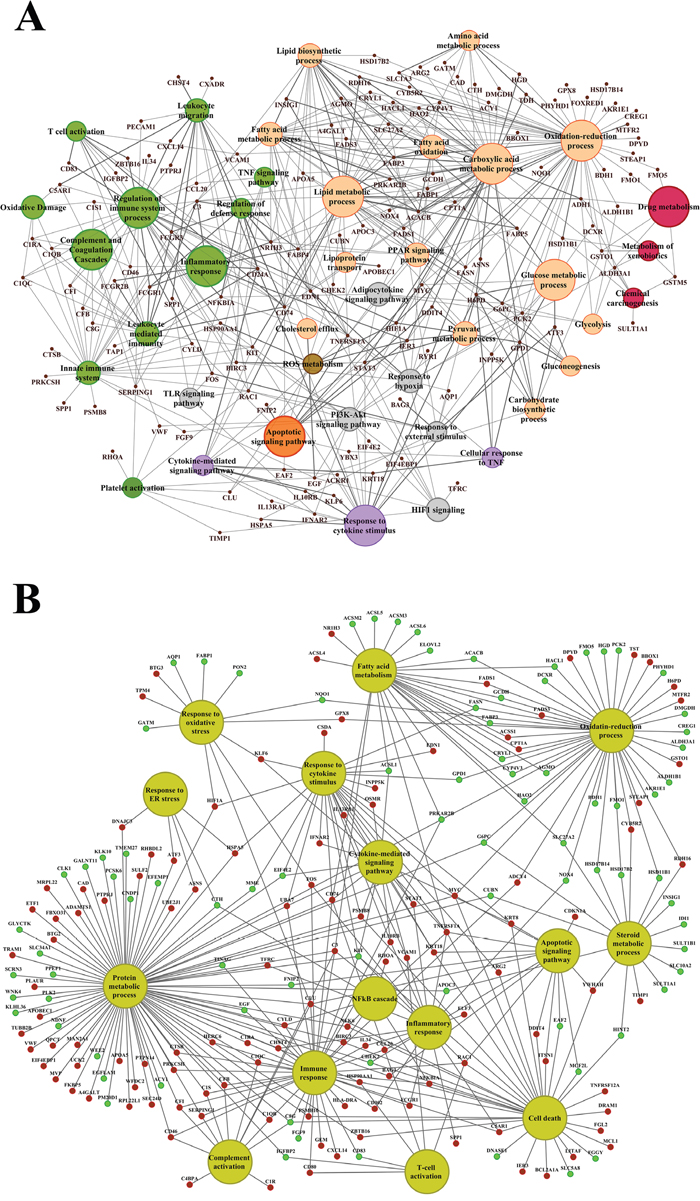
Figure 17: ClueGO gene ontology and pathway annotated networks of DEGs regulated in kidney in response to high dose diclofenac treatment. A visualization of kidney enriched pathway terms and biological processes computed with the ClueGo and the GeneXplain software of high dose treated animals. (Panel A) Network constructed by the plug-in ClueGO of the Cytoscape software. (Panel B) Networks constructed manually using the GeneXplain platform. The enriched biological processes and pathways were annotated with the GeneXplain platform and visualized with the Cytoscape software version 3.4. The red and green color nodes illustrate up- and down- regulated genes, respectively.
Drug metabolism and transporters
Diclofenac is extensively metabolized; we therefore considered regulation of CYP monooxygenases and transporters involved in the metabolism and excretion of diclofenac and its metabolites. Predominant repression of hepatic CYP2A7 and CYP2A13 in the low dose and up to 90% repressed transcripts coding for CYP1A2, CYP27A1, CYP2C18, CYP2D15, CYP3A26, CYP3A4, CYP4A11, CYP4V2 in the high dose treatment was observed (Supplementary Table 5). Notwithstanding, CYP26A1 and CYP2B6 were commonly and dose dependently repressed among the two treatment groups. With kidney and at the low-dose CYB5B was repressed in expression. Conversely, a 2-fold increase in CYB5R2 and a similar 2-fold repression in CYP4V2 were determined for high dose treated animals. Among the Phase II drug metabolizing enzymes the glutathione and glucuronyl transferases GSTA4, GSTM3, GSTM4 and UGT2B4 were significantly repressed (up to 90%) in the liver of diclofenac treated animals. Similarly, transcripts of the sulfotransferase SULT1A1 and SULT1B1 were significantly repressed in kidney, and except of SLC1A4 and SLC13A3 which were induced by 7- and 3-fold, respectively, most of the transporters and mitochondrial solute carriers were repressed in expression (Supplementary Table 5). The reduced expression of the canalicular transporters ABCC2, ABCG2 and of the cholesterol transporter ABCG5 leads to impaired bile acid, bilirubin and cholesterol excretion and in the long term to intrahepatic cholestasis as was observed in DILI patients treated with diclofenac. Conversely, ABCA8 and ABCA9 were induced in expression (approx. 3-fold) to support efflux of drug metabolites and bile salts across the basolateral membrane into the systemic circulation. A summary of regulated drug metabolism, transporters and solute carriers in liver and kidney is shown in Figures 18 and 19.
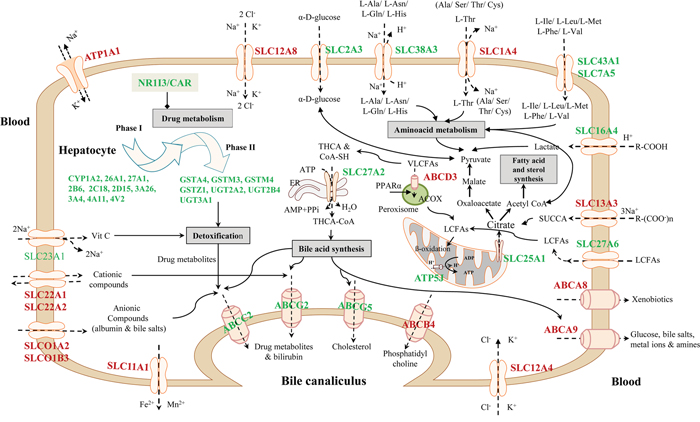
Figure 18: Schema of regulated drug metabolizing enzymes, solute carriers and transporters in the liver of diclofenac treated animals. Genes shown in red are significantly up-regulated while those given in green are repressed in expression.
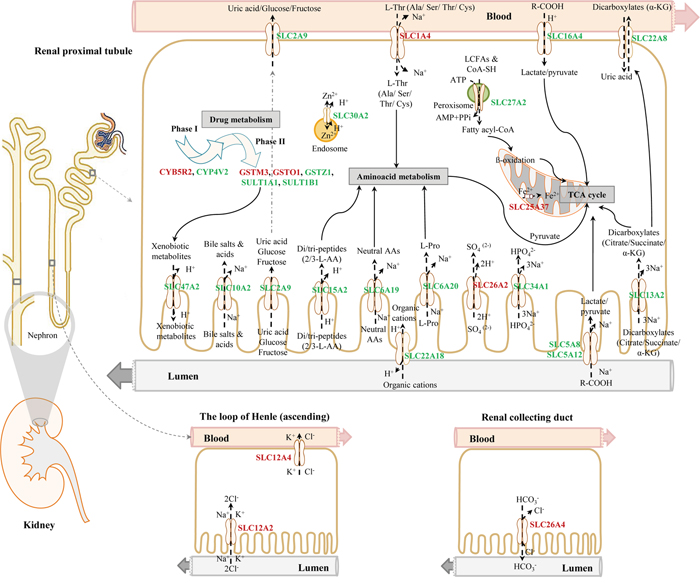
Figure 19: Schema of drug regulated metabolizing enzymes, solute carriers and transporters in the kidney of diclofenac treated animals. Genes shown in red are significantly up-regulated while those given in green are repressed in expression.
Markers of innate immune competent cells
The macrophage marker genes ARG2, CCL20, CD163, and CXCL8/IL-8, IgG FCγ receptor I, macrophage receptor with collagenous structure (MARCO), COX2 and C-reactive protein were up to 7- and 3-fold induced in liver and kidney, respectively, after repeated treatment for 28 days. Alike the T-, B- and Th-cell marker genes C3, DPP4, EGR1, IFNGR2, IL1B, STAT1, STAT3 and TLR4 were significantly increased up to 7-fold, and a similar up to 10-fold induction of the granulocyte markers CD9, CD63, CD164, ICAM-1, LRG1 and S100A8 was determined in the liver of high dose treated animals (Table 7 and Supplementary Table 6). Conversely, IL17RB and LY6E were repressed in expression.
Table 7: Gene expression markers of immune cells significantly regulated in diclofenac treated animals
Gene symbol |
Gene Description |
Liver |
Kidney |
||
|---|---|---|---|---|---|
LD |
HD |
LD |
HD |
||
Fold change (average)± SD |
|||||
Macrophage activation marker genes |
|||||
M1 polarization |
|||||
C5AR1 |
Complement C5a Receptor 1 |
-1.06±0.04 |
1.65±0.41 |
-1.02±0.05 |
2.2±0.44* |
CCL2 |
C-C motif chemokine ligand 2 |
1.01±0.1 |
2.34±1.74 |
-1.01±0.14 |
2.5±1.08* |
CCL20 |
C-C Motif Chemokine Ligand 20 |
-1.02±0.11 |
7.28±3.13* |
-1.3±0.13 |
2.54±0.1* |
CD163# |
CD163 molecule |
-1.01±0.03 |
2.3±0.89* |
-1.03±0.02 |
1.26±0.24 |
CD80 |
CD 80 molecule |
1.18±0.14 |
1.53±0.24 |
1.2±0.05 |
2.02±0.66* |
CRP |
C-reactive protein |
-2.19±1.5* |
7.61±3.63* |
1.03±0.04 |
-1.13±0.23 |
CXCL10§ |
C-X-C motif Chemokine Ligand 10 |
-1.5±0.42* |
-1.17±0.48 |
1.18±0.23 |
5.45±3.02* |
FCGR1A (IgG) |
Fc Fragment Of IgG Receptor Ia |
1.1±0.06 |
3.54±1.66* |
1.1±0.08 |
2.72±0.77* |
HIF1A |
Hypoxia Inducible Factor 1 Alpha Subunit |
1.18±0.03 |
3.71±2.86* |
1±0.01 |
5.21±2.61* |
HLA-DRB1 (MCH2)ǂ |
Major Histocompatibility Complex, Class II, DR Beta 1 |
1.11±0.13 |
1.29±0.16 |
1.18±0.22 |
3.57±0.45* |
IDO1 |
Indoleamine 2,3-Dioxygenase 1 |
1.17±0.23 |
-1.18± 0.19 |
-1.08± 0.08 |
-1.86±0.5* |
IFNAR1 |
Interferon Alpha And Beta Receptor Subunit 1 |
1.02±0.1 |
1.35±0.27 |
1.18±0.09 |
1.57±0.21* |
IFNAR2 |
Interferon Alpha And Beta Receptor Subunit 2 |
-1.09±0.07 |
-1.07±0.08 |
1.01±0.01 |
2.37±0.06* |
IFNGR2 |
Interferon Gamma Receptor 2 |
1.31±0.11 |
2.23±0.93* |
1.19±0.07 |
1.28±0.1 |
IL1Bɸ |
Interleukin 1 beta |
1.82±0.32* |
2.02±0.16* |
1.07±0.19 |
1.07±0.22 |
IL1R1 |
Interleukin 1 Receptor Type 1 |
1.01±0.03 |
8.23±1.92* |
1.04±0.08 |
2.6±2.21* |
IL8/CXCL8 |
Interleukin 8 |
1.18±0.15 |
2.85±1.65* |
-1.3±1.07 |
1.2±0.15 |
INHBA |
Inhibin Beta A Subunit (Activin A) |
1.07±0.08 |
1.37±0.43 |
1.14±0.1 |
1.74±0.37* |
IRF3 |
Interferon Regulatory Factor 3 |
1.09±0.07 |
1.06±0.09 |
1.04±0.03 |
1.82±0.26* |
MYD88 |
Myeloid Differentiation Primary Response 88 |
-1.19±0.13 |
-1.17±0.14 |
1.14±0.16 |
1.76±0.34* |
PTGS2/COX2 |
Prostaglandin-Endoperoxide Synthase 2 |
-1.07±0.03 |
5.34±2.54* |
1.17±0.08 |
2.91±1.37* |
STAT1ɸ |
Signal Transducer And Activator of Transcription 1 |
1.04±0.06 |
4.06±1.7* |
-1.04±0.06 |
-1.18±0.23 |
TLR2 |
Toll like receptor 2 |
1.14±0.17 |
1.6±0.24* |
1.11±0.08 |
1.48±0.38 |
TLR4¥ |
Toll Like Receptor 4 |
1.04±0.02 |
2.11±0.74* |
-1.08±0.14 |
-1-11±0.23 |
M2a polarization |
|||||
ARG2 |
Arginase 2 |
1.06±0.05 |
2.18±0.39* |
1.04±0.01 |
3.39±1.44* |
CD14 |
CD14 molecule |
1.11±0.2 |
2.11±0.65* |
1.14±0.12 |
3.89±1.96* |
IL10RB |
Interleukin 10 receptor subunit beta |
1.07±0.05 |
1.74±0.71* |
-1.1±0.07 |
3.22±1.24* |
IL13RA1 |
Interleukin 13 Receptor Subunit Alpha 1 |
1.23±0.13 |
2.87±0.98* |
1.1±0.05 |
2.73±0.81* |
IL1R2 |
Interleukin 1 Receptor Type 2 |
1.02±0.06 |
4.96±2.1* |
-1.5±0.07 |
1.29±0.27 |
MARCO |
Macrophage Receptor With Collagenous Structure |
1.36±0.22 |
2.61±0.77* |
1.14±0.05 |
1.36±0.04 |
MPO |
Myeloperoxidase |
1.38±0.13 |
2.35±1.19* |
-1.06±0.05 |
1.02±0.09 |
STAT3¤ |
Signal Transducer and Activator of Transcription 1 |
-1.15±0.03 |
2.37±0.69* |
-1.07±0.04 |
2.25±0.99* |
TGM2 |
Transglutaminase 2 |
1.28±0.22 |
4.48±3.07* |
-1.11±0.1 |
1.08±0.06 |
M2d polarization |
|||||
ADK |
Adenosine Kinase |
-1.2±0.11 |
-1.6±0.17* |
1.26±0.05 |
-1.28±0.03 |
CXCL16 |
C-X-C motif Chemokine Ligand 16 |
1.01±0.07 |
1.3±0.29 |
1.25±0.35 |
12.25±2.83* |
VEGFA |
Vascular Endothelial Growth Factor A |
1.14±0.12 |
1.77±0.46* |
-1.13±0.11 |
-1.15±0.19 |
Sensors and effectors of M2 macrophage activation |
|||||
C1QA |
Complement C1q A Chain |
1.03±0.02 |
-1.03±0.22 |
-1.01±0.08 |
1.80±0.67* |
C1QB |
Complement C1q B Chain |
1.43±0.37 |
1.58±0.38* |
1.15±0.09 |
1.95±0.69* |
C1QC |
Complement C1q C Chain |
1.03±0.03 |
1.32±0.16 |
1.22±0.18 |
2.77±0.96* |
IGF1 |
Insulin Like Growth Factor 1 |
1.09±0.16 |
-4.25±1.7* |
-1.08±0.05 |
-1.19±0.29 |
NPY1R |
Neuropeptide Y Receptor Y1 |
1.03±0.06 |
1.14±0.11 |
-1.11±0.09 |
-2.55±0.97* |
T-, B- and Th-cell markers |
|||||
C3 |
Complement factor 3 |
1.32±0.01 |
1.96±0.03* |
1.18±0.13 |
6.12±2.01* |
DPP4 |
Dipeptidyl Peptidase 4 |
1.91±0.7 |
3±1.26* |
-1.07±0.02 |
-1.14±0.13 |
EGR1 |
Early Growth Response 1 |
2.56±0.59 |
6.6±2.45* |
-1.21±0.15 |
2.36±1.13* |
IFNGR2 |
Interferon Gamma Receptor 2 |
1.1±0.09 |
2.23±0.76* |
1.03±0.05 |
1.12±0.08 |
IL17RB |
Interleukin 17 Receptor B |
-1.15±0.04 |
-2.41±1.09* |
1.04±0.04 |
-1.29±0.46 |
SLC11A1 |
Solute Carrier Family 11 Member 1 |
1.07±0.07 |
2.75±0.9* |
-1.05±0.09 |
2.71±0.07* |
Granulocyte markers |
|||||
CD116/CSF2RA |
Colony Stimulating Factor 2 Receptor Alpha Subunit |
1.12±0.02 |
1.88±0.17* |
1.05±0.05 |
1.76±0.32* |
CD164 |
CD164 Molecule |
1.19±0.17 |
2.92±0.95* |
1.33±0.03 |
1.85±0.48* |
CD62/SELP |
Selectin P |
1.38±0.08 |
1.96±0.38* |
1.13±0.06 |
1.44±0.11 |
CD63 |
CD63 Molecule |
1.34±0.2 |
2.66±0.88* |
1.04±0.01 |
1.63±0.07 |
CD9 |
CD9 Molecule |
1.78±0.48 |
2.81±1.18* |
-1.09±0.16 |
-1.52±0.31 |
CMA1 |
Chymase 1 |
-1.02±0.04 |
-2.29±0.94* |
1.11±0.05 |
-1.16±0.1 |
ICAM1 |
Intercellular Adhesion Molecule 1 |
-1±0.03 |
2.38±1.02* |
1±0.04 |
1.62±0.42 |
LRG1 |
Leucine Rich Alpha-2-Glycoprotein 1 |
-1.12±0.06 |
2.56±0.76* |
-1.02±0.02 |
20.25±13.17 |
LY6E |
Lymphocyte Antigen 6 Complex, Locus E |
-1.18±0.28 |
-4.34±2.11* |
1.04±0.26 |
-3.63±1.32* |
NCF1 |
Neutrophil Cytosolic Factor 1 |
1.03±0.01 |
1.89±0.69* |
1.37±0.13 |
1.33±0.32 |
S100A8 |
S100 Calcium Binding Protein A8 |
1.57±0.08 |
9.77±2.02* |
1.08±0.13 |
5.25±3.35 |
The marker genes signify polarized macrophages, T-, B-, Th-cells and granulocytes. Some marker genes were commonly expressed among different immune cells and are highlighted by the following symbols.
# M1, M2a, M2c and M2-tissue resident.
ǂ M1, M2a and M2b.
¥ M1, M2 sensors and T-, B- and Th-cell marker.
§ M1 and M2d.
ɸM1 and T-, B- and Th-cell marker.
¤ M2a and T-, B- and Th-cell marker.
* Statistically significant.
In kidney C3 expression was induced by 6-fold and an up to 3-fold induction for SLC11A1, EGR1 and STAT3 was observed. Although statistically insignificant LRG1 was highly induced by 20-fold; nonetheless the acute phase protein and granulocyte marker S100A8 was statistically significantly induced by 5-fold.
Shown in Table 7 are marker genes of immune cells to evidence a heterogeneous population of polarized macrophages and cytotoxic lymphocytes in response to diclofenac treatment, and Figure 20 summarizes the molecular signals of M1 and M2 polarized macrophages (see also Supplementary Table 6 for insignificantly regulated marker genes).
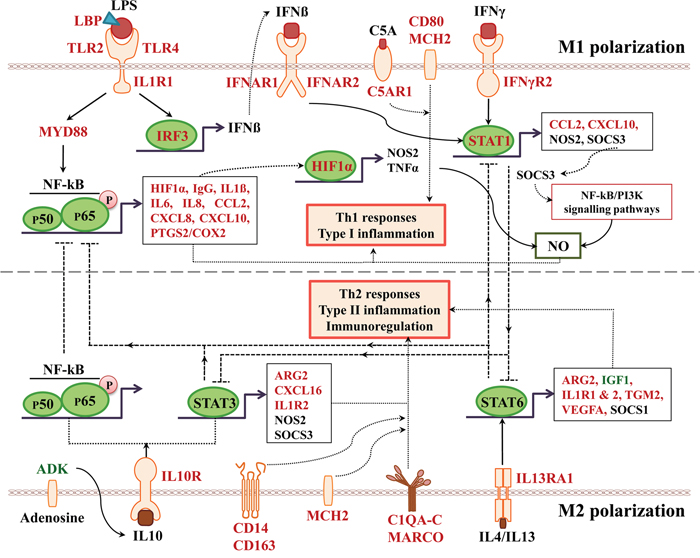
Figure 20: Schema of regulated marker genes associated with M1 and M2 polarized macrophages in the liver of diclofenac treated animals. Genes shown in red are significantly up-regulated while those given in green are repressed in expression. Expressed but unchanged genes in canonical pathways are shown in black.
STRING PPI networks
Interaction networks for liver and kidney regulated genes were constructed by mapping the data to the STRING database. Among hepatic DEGs 52% (148 out of 276 genes) and 78% (519 out of 663 genes) engaged in 258 and 1749 protein-protein interactions (PPIs) after low and high dose treatments (Figure 21A and 21B). Likewise, 54% (135 out of 246 genes) in the low and 69% (338 out of 488 genes) in the high dose were regulated in kidney and engaged in 227 and 1031 PPIs, respectively (Figure 22A and 22B). The PPI networks could be consolidated by considering biological processes to reveal networks of immune, inflammation, acute phase and stress responses.
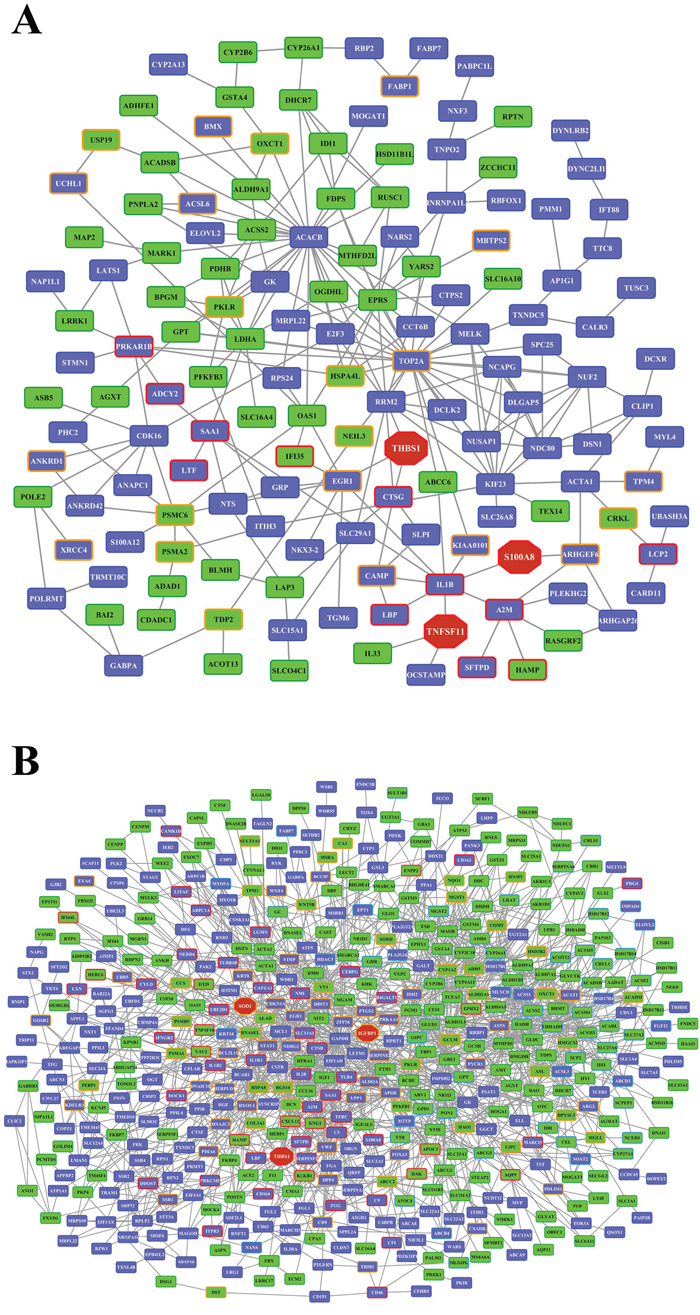
Figure 21: STRING protein-protein interaction networks in the liver of diclofenac treated animals. (Panel A) Low dose treatment. A total of 287 DEGs were used to construct a PPI network of which 148 interacted among 258 PPIs. The purple and green color highlights up- and down-regulated DEGs. (Panel B) High dose treatment. A total of 663 DEGs were used to construct a PPI network of which 519 DEGs interacted among 1749 PPIs. The purple and green color highlights the up- and down-regulated DEGs.
The red hexagon denotes master regulator molecules of the network. Immune and inflammation response genes were marked by red colored boxes, whereas stress response genes and lipid metabolic genes are highlighted in orange and blue colored boxes, respectively. The protein interaction networks were constructed using STRING version 10.0. Zoom in for better readability of individual genes.
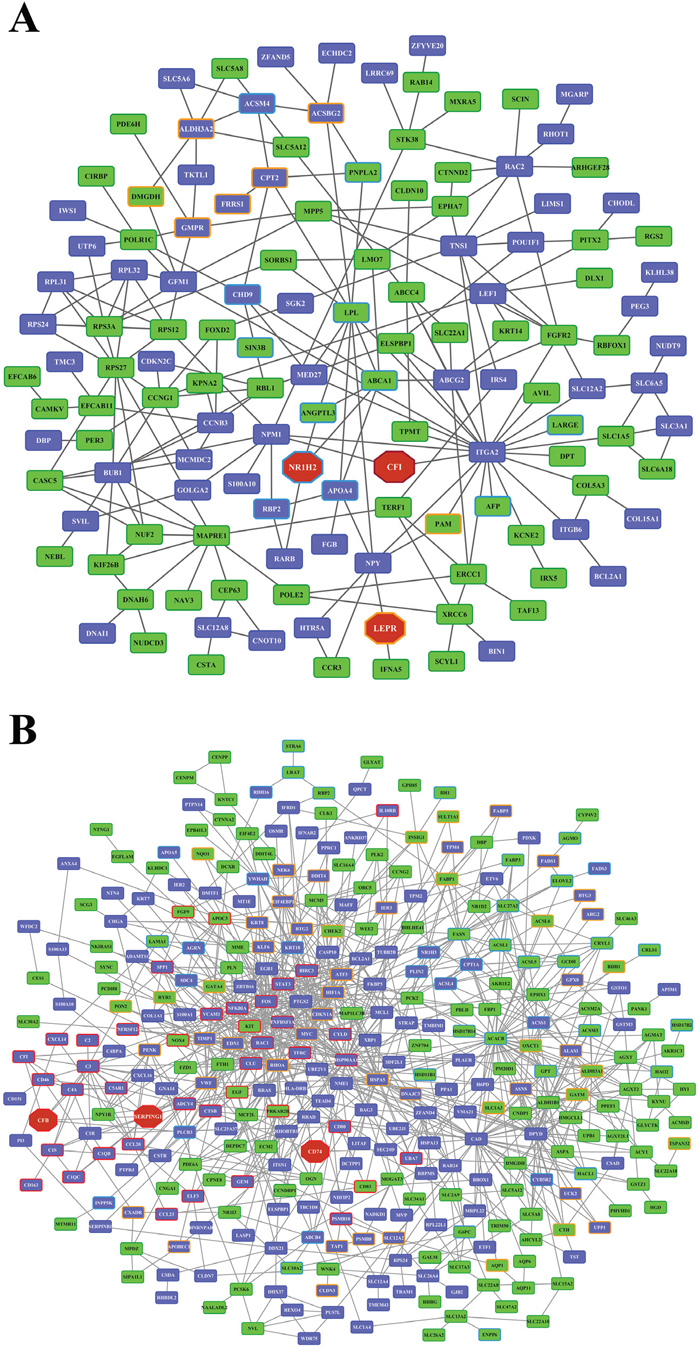
Figure 22: STRING protein-protein interaction networks in kidney of diclofenac treated animals. (Panel A) Low dose treatment. Out of 249 DEGs a network that consists of 135 DEGs was constructed and interacted among 227 PPIs. (Panel B) High dose treatment. Out of 488 DEGs a network that consists of 338 DEGs was constructed and interacted among 1031 PPIs. The purple and green color rectangles highlight the up- and down-regulated DEGs and red hexagon indicates master regulatory molecules of the network. Immune and inflammation response genes were marked by red colored boxes, whereas stress response genes and lipid metabolic genes are highlighted in orange and blue colored boxes, respectively. Zoom in for better readability of individual genes.
Master regulator genes and their associated networks
In an effort to determine regulatory gene networks the GeneWays platform was queried; in the case of liver specific gene regulations thrombospondin 1 (THBS1), TNF (ligand) superfamily, member 11 (TNFSF11), S100 calcium binding protein A8 (S100A8) and IL-17A were identified as master regulators. After low dose diclofenac treatment the constructed networks consisted of 58, 60, 59 and 45 significantly regulated DEGs (about 21% of DEGs). Alike, the high dose diclofenac treatments linked 22% of hepatic DEGs in networks of THBS1 (160 DEGs), superoxide dismutase 1 (SOD1) (144 DEGs) and insulin-like growth factor binding protein 1 (150 DEGs). The same methodology was applied to kidney specific gene regulations. This defined the leptin receptor (LEPR), nuclear receptor subfamily 1, group H, member 2 (NR1H2) and complement component factor I (CFI) as master regulators. Here, 17% of DEGs of the low dose treatment were connected to the constructed networks. Alike after high dose diclofenac treatment 18% of DEGs were allied in networks linked to serine peptidase inhibitor, clade G, member 1 (SERPING1), CD74 antigen (CD74), and complement factor B (CFB). It is of considerable importance that except for IL-17A the master regulators themselves were significantly regulated in liver and kidney of low and high dose treated animals (Table 8).
Table 8: Master regulatory genes in liver and kidney after low and high dose diclofenac treatments
Master regulatory genes |
No of genes |
Score |
FDR |
Z-score |
Fold change (average)±SD |
|
|---|---|---|---|---|---|---|
Total no. of genes in the network |
Statistically significant DEGs |
|||||
Low dose_liver |
||||||
Thrombospondin 1 (THBS1) |
120 |
58 |
0.50532 |
0.003 |
2.38305 |
1.74±0.48 |
Tumor necrosis factor (ligand) superfamily, member 11 (TNFSF11) |
123 |
60 |
0.52204 |
0.016 |
1.8603 |
1.54± 0.18 |
S100 calcium binding protein A8 (S100A8) |
120 |
59 |
0.49161 |
0.032 |
1.66594 |
1.57±0.1 |
Interleukin 17A (IL17A) |
83 |
45 |
0.34041 |
0.018 |
2.80822 |
1.14±0.20 |
High dose_liver |
||||||
Thrombospondin 1 (THBS1) |
287 |
160 |
0.43202 |
0.021 |
2.29552 |
2.14±0.55 |
Superoxide dismutase 1, soluble (SOD1) |
245 |
144 |
0.32782 |
0.043 |
2.01236 |
-2.46±0.97 |
Insulin-like growth factor binding protein 1 (IGFBP1) |
261 |
150 |
0.34794 |
0.045 |
2.13555 |
5.97±3.56 |
Low dose_kidney |
||||||
Leptin receptor (LEPR) |
114 |
50 |
0.39552 |
0.038 |
1.7895 |
-1.64±0.2 |
Nuclear receptor subfamily 1, group H, member 2 (NR1H2) |
95 |
45 |
0.36826 |
0.05 |
1.59419 |
-1.51±0.31 |
Complement factor I (CFI) |
59 |
30 |
0.20321 |
0.03 |
2.01247 |
-1.62±0.22 |
High dose_kidney |
||||||
CD74 molecule (CD74) |
138 |
85 |
0.20624 |
0.025 |
2.02739 |
5.34±0.97 |
Serpin peptidase inhibitor, clade G (C1 inhibitor), member 1 (SERPING1) |
180 |
103 |
0.34598 |
0.031 |
2.18179 |
2.03±0.59 |
Complement factor B (CFB) |
117 |
73 |
0.20292 |
0.018 |
2.7436 |
5.56±2.08 |
The key master molecules were identified and their regulatory networks were constructed using the GeneXplain software version 3.0. Given is a summary of master regulatory genes and its associated networks with the number of total interacting genes and DEGs, network score, Z-score and average fold change. The filtering criteria Z- Score>1 and Score>0.2 was set to select statistically significant master regulators.
We next considered cross-talk amongst individual gene networks and therefore constructed an integrated master regulatory network. The liver networks consisted of 22% and 24% of DEGs in low and high dose diclofenac treatment regimens. Likewise, 21% of DEGs were regulated in common in kidney specific networks (Supplementary Figures 7 and 8). Note, the complement factor CFI was also regulated in fused gene networks of the liver.
Co-occupancy of TFBS in promoters of regulated genes
To gain further insight into regulatory gene networks, the enriched transcription factor binding sites at gene specific promoters coding for inflammation, immune, stress, hypoxia, acute-phase response, cytotoxicity (cell death and apoptosis) and oxidation-reduction were investigated. The computational analysis utilised positional weight matrices available within the MatInspector database of the Genomatix software suite (Supplementary Tables 7-10). The co-occupancy of different TFBS at gene specific promoters was also analysed with the FrameWorker tool that encompasses the vertebrate matrix library 9.2 of the MatInspector database. Among enriched TFBS we found two significant modules with two elements in liver specific gene regulations after low dose diclofenac treatment and these consisted of ETS1 and P53 (Supplementary Figure 9A1) and the autoimmune regulator AIRE and E2F-myc activator/cell cycle regulator (E2F) family transcription factors (Supplementary Figure 9A2). At the high dose the Krüppel-like transcription factor KLF6 and E2F1 were significantly enriched (Supplementary Figure 9B). Composite modules were also constructed for kidney associated DEGs and consisted of MYOD and E2F1 for low (Supplementary Figure 10A) and CREB and GATA for high dose treatments (Supplementary Figure 10B).
Highly regulated genes
A total of 28 and 23 genes were >5-fold regulated in liver and kidney, respectively (Supplementary Table 3), and notable examples of hepatic inflammatory and immune responses are the induced expression of alpha-2 macroglobulin, CRP, transferrin receptor as well as hepcidin antimicrobial peptide, proteoglycan 4, uridine phosphorylase 1, early growth response 1 and ficolin 1; the latter is part of the lectin pathway of the complement system. Alike the cyclin dependent kinase inhibitor 1 A was significantly induced. Further examples include fatty acid elongase 2 and perilipin 2 which were >9 fold increased in expression. Their regulation is associated with oxidative stress and hepatic steatosis by increasing intracellular triacylglycerol synthesis and lipid droplet accumulation [67]. Furthermore, carbonic anhydrase III (CA III) was significantly down-regulated in liver; repression of this protein was reported to increase oxidative stress in hepatocytes after administration of ethanol and carbon tetrachloride [68].
With kidney highly regulated genes included increased expression of secreted phosphoprotein 1, CXCL10 and HLA-DRA that latter being induced by 10-fold. As seen with the liver uridine phosphorylase 1 was markedly increased in expression as was the chaperone clusterin that is regulated in conditions of oxidative stress and inflammation to influence programmed cell death.
Cross-validation of gene expression data by RT-qPCR
To confirm the microarray data with another method RT-qPCR assays were performed. We selected genes coding for master regulators and highly regulated ones. As shown in Figures 23A and 23B similar results were obtained when fold changes among the two platforms were compared. Notwithstanding the RT-qPCR assays revealed the master regulators THBS1, TNFSF11, IL17A to be consistently higher in low dose treated animals though SOD1 and IGFBP1 was lower in expression in high dose treated animals (Figure 23A). Furthermore, RT-qPCR suggested higher fold-changes for CD74 and complement factor B (Figure 23B). We next considered highly regulated genes and once again observed agreement among the two platforms. Notwithstanding IL1R1 and PKLR were less but SAA1 was increased in hepatic expression. Similar the RT-qPCR assays revealed increased expression of C3, CD302, TIMP1 and VCAM-1 in kidney (Figure 24A and 24B).
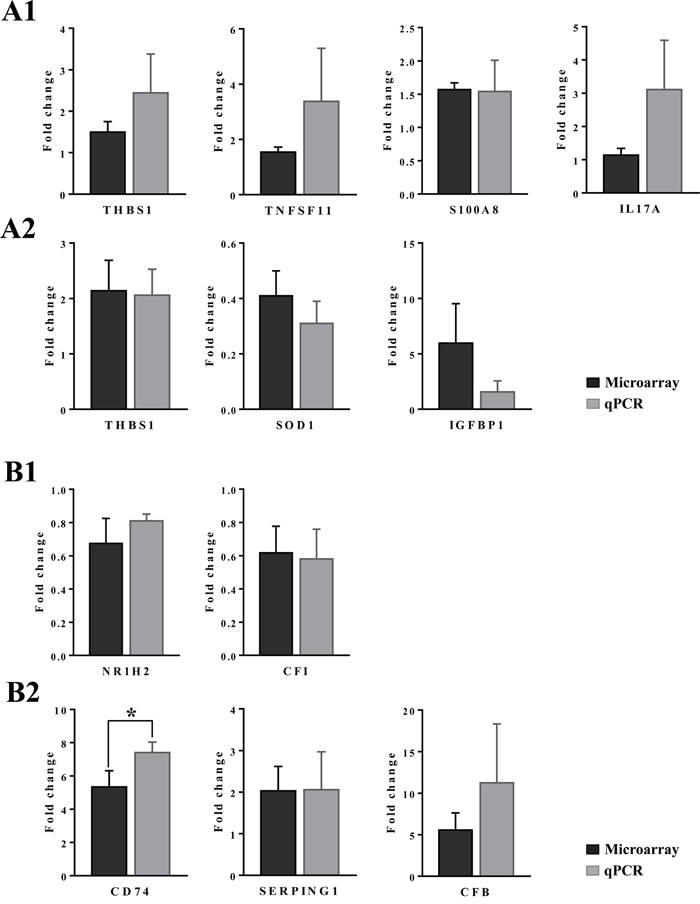
Figure 23: Experimental validation of master regulators by quantitative real-time PCR. (Panel A1 and A2) depict the expression of hepatic master regulator genes after low and high dose diclofenac treatment, respectively. (Panel B1 and B2) illustrate expression of master regulatory genes in kidney after low and high dose diclofenac treatment, respectively. The y-axis indicates the average fold change in expression (diclofenac-treated vs. controls). Data are means ± SD (n = 3).
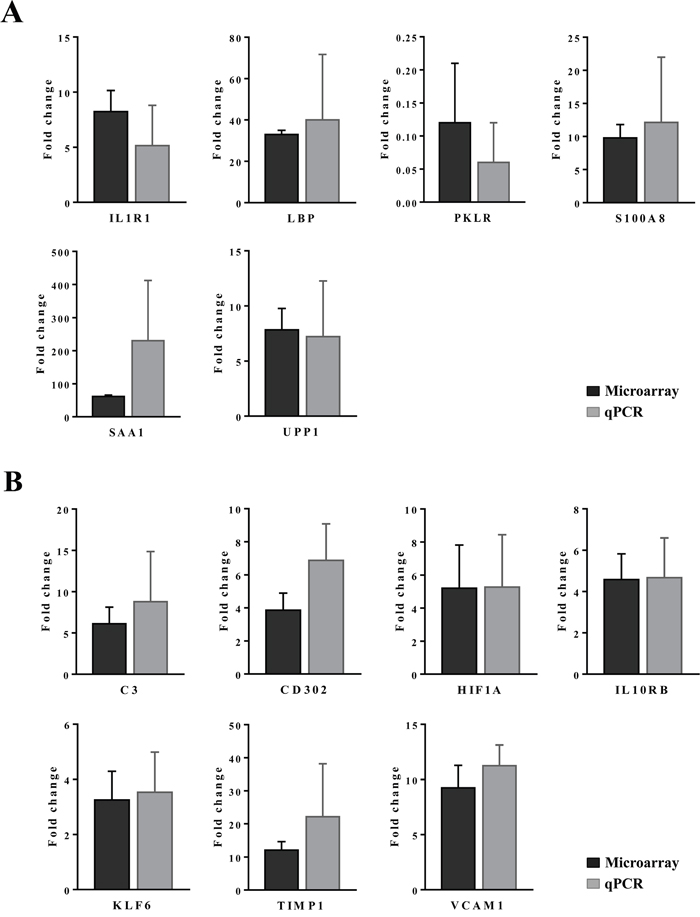
Figure 24: Experimental validation of highly regulated genes in liver and kidney in response to diclofenac treatment. (Panel A) Highly regulated genes in liver. (Panel B) Highly regulated genes in kidney. The y-axis indicates the average fold change in expression (diclofenac-treated vs. controls). Data are means ± SD (n = 3).
DISCUSSION
Idiosyncratic DILI is an unpredictable event [69] and risk factors associated with it were summarized in the seminal review of Chalasani and Björnsson [70].
Diclofenac is one of the most commonly used NSAID around the world, however burdened with significant risks for ADRs. Recently, the Pharmacovigilance Risk Assessment Committee (PRAC) of the European Medical Agency endorsed new measures to minimize risk for adverse drug reactions with diclofenac medications. This NSAID though effective in the management of pain and inflammation is associated with an increased risk for arterial thromboembolic events and liver and kidney injury. The mechanism of diclofenac mediated liver and kidney injury remains to be clarified. Frequently elevated serum transaminases are observed in patients on chronic drug use and histopathology is typically associated with necrosis (zone 3) and inflammation (portal/peri-portal). Chronic liver injury induced by diclofenac may involve interface hepatitis and even fibrosis as well as mixed hepatocellular cholestatic hepatitis. Alike, the spectrum of syndromes associated with diclofenac induced kidney injury includes acute kidney injury/tubulonecrosis, interstitial nephritis, membranous nephropathy, hyponatremia, hypokalemia, hypertension, papillary necrosis and analgesic nephropathy.
In an effort to define mechanism(s) of diclofenac induced allergic liver injury, whole genome expression profiling was performed. This revealed significant changes in the regulation of immune, stress, inflammation, apoptotic and ADME-coding genes in response to diclofenac treatment. Several lines of evidence suggest a critical role of diclofenac reactive metabolites in eliciting immune mediated responses. We observed marked induction of myeloperoxidase expression in Kupffer cells and cellular depletion of SOD1 as a result of oxidative stress. Importantly MPO catalyzes diclofenac reactive metabolism therefore linking innate immune cells of the liver to the production of reactive metabolites. We further assessed genes coding for drug metabolism and transport and observed highly significant repression of CYP monooxygenases in the liver but not in kidney of treated animals. Alike, various glutathione-S- and UDP-glucuronyl transferases were repressed. The significant repression of hepatic CYP monooxygenases and phase II enzymes may be caused by the immune response. Testimony to diclofenac induced sterile inflammation is the highly significant regulation of acute phase proteins with a >60-fold induction of serum amyloid A (SAA), i.e. the foremost acute phase protein, as well as α-2 macroglobulin, fibrinogen, various complement factors in addition to a number of cytokines. A major function of SAA is inhibition of myeloperoxidase (MPO) and activation of cytotoxic lymphocyte. The significant induction of SAA can be considered as an adaptive response to protect against the harmful effects of MPO and exaggerated reactive metabolite production. Similarly, the regulation of major solute carriers in liver and kidney is an important finding and differed among the two organs (Supplementary Table 5). The hepatic expression of SOD1 was decreased after diclofenac treatment and its regulation is associated with oxidative stress and programmed cell death as was shown in previous studies with mouse and rat [71, 72]. In kidney the mitochondrial reductase CYB5B, CYB5R2 and the fatty acid hydroxylase CYP4V2 were significantly repressed after diclofenac treatment. Note, CYB5B and CYB5R2 where shown to function in androgenesis in Leydig cells of rats [73], and the significant reduction in testis and epididymis tissue weight overserved in the present study agrees with the aforementioned study. Furthermore, these monooxygenases are involved in the fatty acid metabolism and regulation of cholesterol synthesis [74].
We recently reported the complex pro- and anti-inflammatory reactions in mice after diclofenac treatment, and it appears that the immune system is generally involved in the toxicity of several NSAIDs [22, 75–77]. Given that the liver is enriched with macrophages and other cells of the innate and adaptive immune system such as sinusoidal endothelium and hepatic stellate cells with functions in antigen presentation and cytokine release [19, 78, 79] we were particularly interested in investigating immune mediated reactions of hepatic injury. We observed a range of cytokines, chemokines and TNFα mediated causes of liver injury. Specifically, the pro-inflammatory chemokine CXCL12 and its receptor CXCR4 and CXCR7 was shown to play a major role in cancer progression [80]; however, this chemokine also induces CD4+ T cell activation and regulates the trafficking of inflammatory cells (neutrophils, leukocytes, B-lymphocytes) and apoptosis to sites of inflammation [81, 82]. IL-1ß is another potent pro-inflammatory cytokine; it likewise activates and recruits leukocytes, especially neutrophils and induces expression of acute phase proteins including SAA1 to SAA3 to cause liver injury by releasing proteases during diclofenac treatment [22, 83, 84]. Increased expression of IL-1ß was reported for different NSAID including diclofenac treated mice [17, 22, 85, 86]. Additionally, we observed repressed IL-33, and this member of the IL-1 superfamily stimulates production of type 2 cytokines by T helper cells during inflammation [87]. Additionally, the TNF family member TNFSF11 (also known as RANKL) was significantly up-regulated, and this cytokine is known to be involved in T cell-dependent immune response and hepatic inflammation by activating RANK/RANKL signaling [88, 89]. Moreover, TNFSF15, which we found to be up-regulated upon diclofenac treatment, is associated with T helper (Th1, Th2 and Th17) cell-mediated immune response [90, 91]. The significant repression of TNFSF10 or TRAIL to 30% of controls signifies adaptive response to cytokine induced apoptosis as observed in the present study (Figure 5) and in cultures of human intestinal epithelial cells [92]. Collectively, the above mentioned cytokines and chemokines bind and activate their respective receptors to promote inflammatory responses in the liver. In addition, a highly significant >30 fold induction of LPS-binding protein (LBP, an acute phase protein) and of the Toll- like receptor 4 (TLR4) (>2 fold) was observed. The role of these proteins in hepatic injury by mediating LPS-induced inflammatory cascades has been the subject of several independent reports [93–96].
Next to the liver we considered inflammatory responses in kidney and observed significant regulation of cytokines and chemokines including CXCL14, CXCL16, CCL20, and IL-34 and its receptor IL10RB. The chemokines and their receptors regulate the trafficking of immune-competent cells to sites of inflammation in organs such as intestines, liver, lungs and kidneys. In this regard the chemokine CXCL14 (breast- and kidney-expressed) is of particular importance for its ability to stimulate proliferation of tissue macrophages; its increased expression promotes T-cell activation and Th1 differentiation as well as the trafficking of macrophages, dendritic cells and natural killer cells to sites of inflammation [97–99]. The chemokine CXCL16 was also significantly up-regulated (12 fold) in response to diclofenac treatment and plays a pivotal role in the pathogenesis of renal injury and fibrosis by regulating macrophage and T-cell infiltration and myeloid fibroblast accumulation in kidney [100, 101]. Several factors including TWEAK, ANG II and inflammatory cytokines were reported to induce the expression of CXCL16 during renal inflammation [101–103]. Additionally, chemokine (C-C motif) ligand 20 (CCL20), also known as macrophage inflammatory protein-3α, is mainly expressed in activated cells of inflamed tissues, and the ligand-receptor pair CCL20-CCR6 attracts immature dendritic cells, effector/memory T cells and B cells to the site of renal inflammation [104, 105]. The increased expression of IL-34 is testimony to a coordinate response by regulating the activation and differentiation of monocytes and macrophages in the pathogenesis of inflammation [106, 107]. Expression of IL10RB was also increased (5-fold) in response to diclofenac treatment; as a co-receptor, IL10RB interacts with heterodimeric receptor complex of IL-10 cytokine family members and activate JAK/STAT signaling pathway [108–110]. An activated JAK/STAT signaling was shown to play a decisive role in inflammatory cell infiltration, accumulation of an extracellular matrix and development of tubulointerstitial fibrosis of the kidney [111]. Moreover, several studies reported this pathway to be implicated in renal diseases including diabetic nephropathy [112, 113], glomerular nephritis [114, 115] and renal ischemia/reperfusion (I/R) injury [116]. Thus, the increased expression of these cytokines and chemokines in response to diclofenac treatment promotes immune-mediated glomerular injury as was summarized in a review [117].
In kidney of diclofenac treated animals, significant up-regulation of the genes coding for C1Q, C1S, C1R, C2, C3, C4, CFB and CFI was observed. The activation of complement factors is part of the innate immune system but can also be activated as a result of I/R injury induced in renal cells [118, 119]. Specifically, diclofenac treatment induced transcriptional activation of C1Q, C1S, C1R and C2 which are implicated in the activation of classical pathway and are ultimately responsible for the activation of C3 convertase, a key molecule of the alternative pathway by cleaving the C3 molecule [120]. As was observed in hepatic tissue an increased expression of C3, C5 and C9 facilitates the formation of membrane attack complex (MAC) to cause cell lysis and resulting in tubulointerstitial injury after reperfusion [121, 122]. The release of pro-inflammatory cytokines/chemokines and ROS by anaphylatoxins (C3a and C5a), i.e. the cleavage of C3 and C5 molecules, perpetuate the immune response and injury [122]. Our study highlights activation of the complement system as a mechanism of renal toxicity as was reported for patients who developed renal papillary necrosis and other injuries in response to diclofenac medication. Furthermore, the reduction in prostaglandin formation and associated renal blood flow causes ischemia and hypoxic injury. Moreover, the expression of several membrane complement regulatory proteins known to inhibit complement activation was observed. We found significant induction (3-fold) of CD46, a membrane cofactor protein which regulates the inactivation of soluble factor I mediated complement cascades to protect renal cells from damage [123, 124].
Apart, pathway analysis revealed activation of MAPK signaling molecules in the liver of diclofenac treated animals most notably ARHGEF6, CDK1, CRKL, DDIT3, DUSP10, HSPA8, IL-1ß, IL1R1, IL1R2, MAP2K7, PAK2 and TNFSF11. Their regulation can be triggered by a variety of extracellular stimuli including mitogens, cellular stress or pro-inflammatory cytokines and play a crucial role in cellular activities such as gene expression, proliferation, differentiation, cell cycle control, apoptosis and inflammation-mediated hepatotoxicity [125–128].
Gene regulatory networks in the liver
The network analysis defined several master regulators, i.e. THBS1, TNFSF11, S100A8, IL17A, IGFBP-1 and SOD1 after low and high dose diclofenac treatment in liver. THBS1 is an adhesive glycoprotein and facilitates platelet aggregation and cell matrix interaction. It was significantly up-regulated (2-fold) in response to diclofenac treatment and is released early during the acute phase response. Importantly, THBS1 activates transforming growth factor (TGF)-β, a key molecule in the development of liver fibrosis [129–131] and inflammatory renal diseases [132–134]. Several studies reported increased expression of THBS1 in hepatic fibrosis and hepatocellular carcinoma [130, 135, 136], and a recent review summarizes the function of THBS1 and its activity via CD47 in inhibiting NO, cGMP, cAMP and VEGF signalling to promote thrombosis and to decrease tissue survival [137]. These findings suggest an important role of THBS1 in liver diseases; its inhibition improves liver regeneration and therefore represents an interesting drug target to mitigate hepatic injury [138].
TNFSF11, also known as receptor activator of NF-κB (RANK) is another master regulator and functions in the regulation of T cell-dependent immune response [139]. TNFSF11 instructs activation of NF-κB, JNK, p38 and ERK1/ERK2 and promotes multiple cellular events including apoptosis, proliferation, survival and differentiation [140]. NF-kB activation is a major molecular response in I/R injury, and the interaction of RANK with its ligand (RANKL) promotes its activation and hepatic inflammation [89]. Note, RANKL and RANK were modestly but significantly induced by 50% and a similar 1.5-fold induction was observed for TNFRSF11B (osteoprotegrin), a decoy receptor of RANKL after repeated diclofenac treatments for 28 days. In mice, RANKL was shown to protect against hepatic I/R injury; therefore, it is tempting to speculate that oxidative stress induced by diclofenac treatments elucidated an adaptive response to reduce liver injury [89]. The acute phase protein S100A8 was identified as another master regulator and was shown to be strongly induced in various pathological conditions associated with inflammation [141, 142]. S100A8/9 amplifies pro-inflammatory signals such as IL-6, TNFα, CXCL1 and CXCL2 which were induced up to 12 and 3-fold, respectively, in liver of diclofenac treated dogs. Furthermore, increased transcript expression of S100A8 was observed in the livers of mice after treatment with a range of drugs, e.g. acetaminophen, diclofenac and halothane [143], and a similar 2-fold induction of this acute phase reactant was determined in the present study. In addition, we identified IL-17A as master regulator after low dose diclofenac treatment, and this cytokine is produced by CD4+ Th- cells (Th17). Increased expression of plasma IL-17 levels was also reported after diclofenac treatment of mice [22]. Consistent with the broad function of its receptor, IL-17 up-regulates expression of several pro-inflammatory cytokines, chemokines and metalloproteases and plays a critical role in neutrophil recruitment, angiogenesis, inflammation and autoimmune diseases [144]. Collectively, IL-17 plays an essential role in the pathogenesis of immune-mediated liver injury induced by alpha-naphthyl isothiocyanate [145], carbamazepine [146], diclofenac [22] and halothane [147].
Furthermore, we determined SOD1 as a master regulator in the liver of diclofenac treated dogs. SOD1 is one of the major intracellular antioxidant enzymes and of critical importance in antioxidant defence by catalyzing the conversion of superoxide free radicals to hydrogen peroxide and molecular oxygen [148]. Earlier studies reported ROS to be significantly increased in hepatocytes treated with diclofenac [149]. We observed decreased SOD1 expression in harmed hepatocytes to aggravates liver injury and similar findings had been reported by others [72, 150–152]. Another master molecule significantly up-regulated in response to high dose diclofenac treatment was IGFBP-1, a member of structurally related soluble proteins that binds and modulates the actions of insulin growth factors 1 and 2. Several proteins of the IGFBP family are potent inducers of the apoptotic cell death pathways; however, IGFBP-1 acts as a pro-survival factor by modulating the mitochondrial apoptotic pathway in the liver [153]. IGFBP-1 is an early-response factor rapidly induced by glucocorticoids, pro-inflammatory cytokines and ROS [154, 155] as well as other stress-related events [156, 157] with hepatic IGFBP-1 mRNA expression being also increased in alcoholic liver disease, cirrhosis [156], hepatocellular carcinomas [158] and steatosis [159]. Elevated IGFBP1 serum levels are also a prognostic factor for worse outcome in critically ill patients [160].
Gene regulatory network in the kidney
Network analysis of LD and HD diclofenac treated dogs revealed LEPR, NR1H2, CFI, SERPING1, CD74 and CFB as master regulatory molecules in kidney. Intriguingly, at the low dose all master regulators were repressed in expression, however, at the 3 mg/kg/day dose CD74 and complement factor B were induced >5-fold. The leptin receptor plays a key role in energy expenditure and food intake but also in the control of inflammation by influencing monocyte/macrophage-mediated responses [161, 162]. Several studies suggest leptin to be a pro-inflammatory molecule whereby the leptin receptor directly or indirectly modulates signaling pathways involved in kinase-induced phosphorylation by JAK2/STAT3, ERBB2, ERK, IRSl and Rho/Rac [163]. Among its versatile functions leptin induces the expression of TGF-β1 in glomerular endothelial cells and promotes G1 progression of the cell cycle through cyclin-dependent kinases [164]. Leptin induces proliferation, differentiation and function of haemopoietic cells including T cells [165] and plays a role in renal fibrosis [166]. It also activates human leukocytes via receptor expression on monocytes [167] and induces oxidative stress [168]. Collectively, leptin is a mediator of the immune response [169], and in our recently published study with diclofenac treated mice we evidenced induction of the leptin receptor by immunohistochemistry, even though transcriptional responses are opposite when the two species are compared [17].
Furthermore, computational analysis revealed the nuclear receptor NR1H2 (also known as LXRß) as another master molecule. This receptor functions a key regulator of lipid metabolism, immune and inflammatory signalling in macrophages [170–172]. It was shown that LPS and inflammatory cytokines repress the expression of LXRs and its target genes (i.e. ABCA1 and ABCG4) to cause acute renal injury through lipid accumulation in kidney cells [173, 174]. Moreover, the complement factor I and B were identified as master regulators in kidney of diclofenac treated dogs, and the kidney was shown to be susceptible to complement-mediated inflammatory injury in different animal models [175]. Interestingly, diclofenac treatment elicited activation of the alternate pathway in liver but the classical pathway in kidney with strong induction of IgM and IgG in liver (as evidenced by IHC) and up to nearly 9-fold induction of individual components of the classical pathway (e.g. C1RA (8.5-fold), C1S (7.5-fold), C3 (6-fold), CFB/C2 (5.5-fold), CFI and C4 (approx. 2.5-fold)) in kidney. An activation of the two master regulators CFI and CFB are considered to be culprits of immune complex mediated glomerular tissue injury [176–179].
The present study also highlights SERPING1 (also known as C1INH), an extracellular matrix protein, as a master molecule that regulates complement activation and leukocyte trafficking to prevent tissue damage induced by inflammatory cytotoxic reactions. It was reported that the increased expression of this inhibitor at inflammation sites protects the kidney from complement-mediated injury by non-specific defence mechanisms during renal I/R injury and fibrosis [122, 180]. Lastly, network analysis revealed CD74, a single-pass type II transmembrane glycoprotein that functions as a chaperon in the control antigenic peptide loading as a master regulator. A functional heteromeric MIF factor is formed by CD74 and CXCR4 [181] and its associated protein complexes (i.e. MIF, CD44, and CXCR) regulate various signal transduction pathways during immune-mediated inflammatory conditions [47, 182–185]. High glucose, metabolic mediators of injury, nephrotoxins and cytokines increase the expression of CD74 in renal cells to cause kidney injury [186] and is also highly up-regulated in clear cell renal cell carcinoma [187]. CD74 also regulates B-cell development and proliferation, survival and inflammatory mediators in non-immune cells [183, 188] and the performed immunohistochemistry (see Figure 8) clearly evidenced high expression of CD74 of activated leukocytes in hepatic sinusoids of diclofenac treated animals.
Co-occupancy of transcription factor binding sites in liver and kidney
To further interrogate the constructed networks, TFBS at gene specific promoters for immune, stress, inflammatory, hypoxia, cytokine stimulus and acute-phase responses were analyzed, and the related TFBS modules/composite modules were computed for low and high dose diclofenac administered liver and kidney. Specifically, E2F1, a member of the E2F transcription factor family, was significantly repressed in expression in liver and kidney of low dose treated animals. This transcription factor endorses cell cycling and regulates the expression of genes involved in cell proliferation, differentiation, apoptosis and DNA repair [189]. The increased expression of E2F1 transcription factor can alter TGF-ß mediated growth inhibitory effects by inducing cell cycle arrest and apoptosis as a result of liver and kidney injury [190–192] but also contributes to cancer development [193, 194]. E2F1 was also identified as a novel regulator of immune responses to LPS treatment of mice [195, 196]. Furthermore, the transcription factor AIRE is part of the hepatic composite module and a key regulator in autoimmune diseases [197]. It was shown that the CARD domain of AIRE forms a protein complex through dimerization that triggers apoptosis, inflammation and innate immune recognition [198]. AIRE-induced stress response and cell death could be a result of the simultaneous transcription of a high number of genes including T-cell receptors [197].
Additionally, low dose diclofenac treatment revealed hepatic P53 which is typically regulated in response to DNA damage and hypoxia and mediates a variety of anti-proliferative processes [199, 200]. As a stress-activated transcription factor, P53 regulates the expression of numerous downstream genes which could promote apoptosis via cell cycle arrest [201] and in some cases represses the expression of genes to protect cells from cytotoxicity [157]. Another transcription factor of the composite module is ETS1, and the ETS family of transcription factors are critical regulators for endothelial cell proliferation, differentiation, migration, apoptosis and cell-cell interactions [202]. ETS1 is implicated in the cell response to stress [203], and an increased expression of this factor regulates various metabolic and oxidative stress pathways in several cancer models [204, 205] but mediates vascular inflammation as well [206]. Moreover ETS1 interacts with P53 to activate p53-responsive pro-apoptotic genes including BAX, DR5 and FAS [207]; however, in the present study the genes were mostly unchanged in liver and kidney of diclofenac treated animals.
In addition, KLF6 was identified as part of the composite module, and this zinc finger protein influences a wide range of processes including cellular differentiation, cell cycle progression, oxidative stress and apoptosis as well as adipogenesis and glucogenesis [208–210]. Among the KLF proteins, isoforms 1-3, 6, 11 and 13 play major roles in hematopoiesis and immunity [211] whereas KLF4 and KLF6 regulate pro-inflammatory signaling in macrophage [62, 212]. In the present study most of the KLF-transcription factors were unchanged or slightly (<2-fold) regulated in liver and kidney; however, KLF6 transcript was induced >3-fold and the protein was markedly expressed (Figure 13). Increased KLF6 expression augments enhanced collagen 1 and TGFß1 expression to result in liver fibrosis [213], and overexpression of KLF2 induces expression of the fatty acid translocator CD36 [214] whereas KLF15 plays an essential role in ER stress-mediated insulin resistance in the liver [215]. Of note, CD36 was increased by 2-fold and histopathology revealed hepatic steatosis (Figure 5 and Table 5).
Interrogation of promoter sequences of regulated genes in kidney revealed MYOD as enriched transcription factor. Pro-inflammatory cytokine mediated hypoxia and stress response signaling repress the expression of MYOD and this was also observed in the present study. MYOD was reported to induce cell cycle arrest through activation of E2F and P21 mediated activities [216, 217].
Additionally, the constructed composite module identified cAMP response element binding protein (CREB) as significantly enriched, and this protein plays an important role in the regulation of T- and B- lymphocytes and Th-cells [218]. A variety of growth factors and inflammatory/stress signals induce CREB1 activation though diclofenac treatment caused a minor 1.6-fold increased transcript expression of this factor. Collectively, CREB participates in the transcriptional regulation of pro-inflammatory and/or immune-related genes as observed in the present study and as reported by others [218, 219].
Finally, GATA factors though unchanged in expression were enriched in the constructed composite module. Of note, GATA1 plays a major role in the hematopoietic and immune system in mice [220] and regulates pro- and anti-inflammatory chemokine receptors in the orchestration of the inflammatory response [221].
In conclusion, a mechanism of allergic liver injury is proposed that results in lobular inflammation, inflammatory cell infiltrates, hepatocellular damage and granulomatous hepatitis. Diclofenac causes unprecedented induction of MPO in macrophages and oxidative stress that is associated with reactive metabolite production and the formation of diclofenac adducts. These are phagocytized by APCs and other cells of the mononuclear phagocytic system and through interaction with MHC molecules elicit a T- and B-cell response. The highly induced mast cell infiltration and their activation is testimony to an allergic reaction and involve the complement system. Given the observed sequence of liver lesions we consider the findings as relevant for other NSAIDs and may possibly be extended to a general mechanism of allergic liver injury.
MATERIALS AND METHODS
Animals
Nine male beagle dogs were purchased from the Marshall Beijing (Marshall Farms Wayao village, Liucun town, Changping District, China). The average body weight was 7.5±0.17 kg. The animals were maintained under controled housing conditions of a temperature of 23±3°C, humidity of 55±10% and with 12-hour light/dark cycle at 150–300 lux and an air ventilation of 10-20 times/hour. The dogs were given dog chow - 300 g (Safe Diet, Scientific Animal Food & Engineering, France) and water ad libitum. All animals were acclimatized to their housing for 4 weeks prior to randomization into treatment groups.
Drug treatment
Diclofenac was purchased from Sigma-Aldrich, Inc (CA, USA) and next to controls (N=3) groups of N=3 animals were administrated orally with either 1 mg/kg/day (LD) or 3 mg/kg/day (HD) for 28 days. The drug substance was loaded into gelatine capsules to achieve individual doses based on body weights and the vehicle control group received one empty capsule per day.
Clinical pathology
Blood and urine samples were collected during pre-treatment and treatment periods (Day 1, 15 and 28) for evaluation of haematology, serum chemistry and urinalysis. The animals were fasted overnight prior to blood or urine collection. The blood samples were collected from the cephalic vein. For haematology, 0.5 mL of the blood samples were placed into the tubes containing EDTA-2K and the parameters white blood cells (WBC), red blood cells (RBC), haemoglobin concentration (HGB), hematocrit (HCT), platelet (PLT) and differential leukocyte count were measured with an ACL 9000 analyser (Instrumentation Laboratory, Italy). In addition, 2.0 mL blood samples were drained into tubes without an anticoagulant and stored at room temperature for 90 minutes and then centrifuged at 3000 rpm for 10 minutes at room temperature to obtain serum. Aspartate aminotransferase (AST), alanine aminotransferase (ALT), alkaline phosphatase (ALP), gamma glutamyl transferase (GGT), total bilirubin (TBIL), triglyceride (TG), glucose (GLU), albumin (ALB), total protein (TP), creatine phosphokinase (CK), blood urea nitrogen (BUN) and creatinine (CREA) were assayed on a Toshiba 200FR NEO (Toshiba Co., Japan). Furthermore, the serum and urine electrolytes (Na, K, Ca and Cl) were analyzed on a Toshiba 200FR NEO (Toshiba Co., Japan).
Histopathology
Using standard operating procedures of the laboratory a range of stains were employed to evaluate the liver morphology of control and diclofenac treated dog liver and kidney and included Hematoxylin and Eosin (H&E), Periodic Acid-Schiff's reaction (PAS), PAS diastase digestion, Elastica van Gieson, silver and Prussian blue, Giemsa and chloroacetate esterase (CAE) stain.
Immunohistochemistry
Immunohistochemistry was done as described in our recent study [17]. Livers from control and diclofenac treated animals were fixed in 4% buffered paraformaldehyde and embedded in paraffin block using standard protocols of the laboratory. 1 μm thick sections were deparaffinised and rehydrated through a descending alcohol series followed by a 4 min washing step in distilled H2O. Subsequently, antigen retrieval was performed in citrate buffer (pH 6) in a water bath at 98°C for 30 minutes. The ZytoChem-Plus HRP Polymer-Kit of Zytomed Systems (Berlin, Germany) was used for immunohistochemistry. The slides were rinsed with distilled H2O, and after a 5 min incubation step in tris-buffered saline (washing buffer) endogenous peroxidase activity was blocked with 3% peroxidase blocking reagent (Merck, Darmstadt, Germany) for 5 min followed by a second washing step. Thereafter, the sections were blocked for 5 min with protein-block serum free reagent (ZytoChem-Plus HRP Polymer-Kit, reagent 1) and incubated with primary antibodies for 60 min. The antibodies were purchased from diverse vendors and diluted with washing buffer as given in parenthesis (see Table below). The bound primary antibodies or bridging antibodies were incubated with labeled polymer HRP Anti-Rabbit or anti-mouse secondary antibody (ZytoChem-Plus HRP Polymer-Kit, reagent 2) for 20 minutes. Subsequently, the reaction was developed and visualized by use of reagent 3 of the ZytoChem-Plus HRP Polymer-Kit and by placing the slides in a moist chamber at room temperature allowing an incubation time of 30 min.
Finally, the sections were counterstained with hematoxylin for 5 min, washed under running warm tap water for 10 minutes and dehydrated in a cabinet at 60°C for 20 minutes, cover slipped and examined under a light microscope (Nikon Ni-E microscope, Japan). Image capture was done with the Nikon NIS basic research microscopic imaging software version 4.3. The images were converted into tiff files and unless otherwise stated the images were finalized in Adobe Photoshop version CS5.
List of antibodies used in immunohistochemistry
Antibody |
Vendor |
Cat no. |
Lot number |
Dilution |
Antigen retrieval |
|---|---|---|---|---|---|
C1 INH |
Santa Cruz |
Sc-46298 |
B2706 |
1:50 |
pH6 |
C3 |
Abcam |
ab112820 |
GR119618-2 |
1:1000 |
pH6 |
CD 74 |
Santa Cruz |
sc-5441 |
12807 |
1:150 |
pH6 |
DEC205 (D-18) |
Santa Cruz |
sc-14602 |
L1813 |
1:25 |
pH6 |
Factor B |
Santa Cruz |
sc-67141 |
G1808 |
1:25 |
pH9 |
HIF-1alpha |
Abcam |
ab463 |
GR252860-1 |
1:50 |
Pronase |
IgM |
Dako |
REF A0425 |
00086531 |
1:1000 |
Pronase |
KLF6 |
Biobyt |
orb36742 |
E5903 |
1:50 |
ph6 |
MPO |
Dako |
REF A0398 |
20001076 |
1:500 |
- |
SAA1 |
Abcam |
ab171030 |
GR147621-10 |
1:100 |
pH6 |
SOD 1 |
Abcam |
ab13498 |
GR80256-31 |
1:200 |
pH6 |
SOD 2 |
Santa Cruz |
sc-30080 |
J0713 |
1:250 |
pH6 |
VCAM-1 (D-19) |
Santa Cruz |
sc-1504 |
H1215 |
1:50 |
pH6 |
RNA extraction
Liver and kidneys were surgically removed from diclofenac treated dogs (1 and 3 mg/kg/day) and control animals and snap-frozen in liquid nitrogen. The liver and kidney samples were stored in a deep freezer until RNA extraction. Frozen liver samples were immediately added to buffer RLT with β-mercaptoethanol and homogenized using a TissueLyser (Qiagen, Hilden, Germany) for microarray analysis. Total RNA from each tissue was isolated and purified using the RNase mini kit (Qiagen) according to the manufacturer’s protocol. Furthermore, the concentration of total RNA was measured using NanoDrop spectrophotometer (NanoDrop Technologies, Wilmington, DE) and RNA integrity was determined on a 2100 Bioanalyzer (Agilent Technologies, Santa Clara, CA).
Microarray experiments and data analysis
250 ng of total RNA was used for each microarray experiment. All steps of cDNA synthesis, biotin labeling, fragmentation, hybridization, staining, washing and scanning was done according to the manufacturer's recommendation (Affymetrix, Santa Clara, CA) and further details are given in [17, 222]. Whole genome expression profiling was performed with the Affymetrix GeneChip canine genome 2.0 and scanned on a GeneChip Scanner 3000 (Affymetrix).
In vivo liver and kidney expression data from the low (1 mg/kg/day) and high (3 mg/kg/day) dose and vehicle control groups was processed with the MAS5 algorithm available in the GeneXplain 3.0 platform (http://platform.genexplain.com/bioumlweb). Thereafter, differentially expressed genes (DEGs) were identified from the normalized datasets by applying the hypergeometric statistical analysis with a fold change >1.5 and a p-value<0.05. Genes satisfying those conditions were grouped as up- and down-regulated, and heatmaps for the predicted DEGs were constructed based on the average-linkage hierarchical clustering with Euclidean distance using the software Multi Experimental Viewer (MeV) (http://www.tm4.org/mev.html).
RT-qPCR
RT-qPCR was performed for 13 genes selected by their level of regulation and included master regulators. The primers were purchased from GenoTech (Daejeon, Korea). Total RNA (2 μg) was reverse-transcribed with SuperScript II (Invitrogen, Carlsbad, CA) using an oligo-dT primer as described by the manufacturer. cDNA samples were stored at –20°C until use. Quantitative real-time RT-PCR was performed in a 20 μl reaction volume containing 0.5 μl (10pM) forward and reverse specific primers, 10 μl of SYBR Green master mix (Applied Biosystems, Carlsbad, California), 2 μl of cDNA and 7 μl of nuclease-free water. The cDNA was amplified using a StepOne and StepOnePlus Real-Time PCR System (Applied Biosystems) following the manufacturer’s protocol. The 18S ribosomal RNA primers were used as an internal control. Note, the primer sequences of all genes investigated are listed in Supplementary Table 11.
Identification of orthologous genes
As the dog genome is not fully sequenced, orthologs for diclofenac regulated genes were searched against human, mouse and rat genomes using the g:Orth tool in g:profiler server (http://biit.cs.ut.ee/gprofiler/gorth.cgi). This tool retrieves orthologues based on sequence similarity [223] and the identified genes were used for further analysis.
Functional enrichment analysis
The mapping of DEGs to ontologies included biological processes, cellular components, molecular functions, metabolic and signaling pathways and transcription factor classification. For each ontological term the p-value and the expected and actual number of hits were calculated using the GeneXplain platform version 3.0. A biological process was considered significant at a p-value <0.05 and the terms were used for further analysis. In addition, significantly enriched gene ontology term/pathway networks were visualized with the ClueGO version 2.3.2, a Cytoscape plug-in. Note, ClueGO retrieves the enriched biological term/pathway and gene ontology clusters from precompiled annotation files including GO, KEGG and BioCarta database entries and calculates enrichment score based on the hypergeometric distribution [224].
Gene/protein interaction networks
Protein-protein-interaction (PPI) networks for DEGs were constructed using the STRING database version 10.0 (http://string-db.org/). The functional relationship among DEGs is considered by retrieving the associations from the publically available biological datasets including high-throughput experimental data, mining of databases and literature and predictions based on genomic context analysis. Furthermore, it calculates the confidence score for each predicted association and constructs protein-protein-interaction (PPI) networks [225].
Identification of master regulatory molecules
Master regulatory molecules and associated networks of DEGs were identified based on the network analysis tool of the GeneWays database (http://anya.igsb.anl.gov/Geneways/GeneWays.html). The tool is available within the GeneXplain platform version 3.0. A default cutoff (score at 0.2, FDR at 0.05 and Z-score at 1.0) with a maximum radius of 4 steps upstream of an input gene set was used for predicting statistically significant master regulatory genes. The tool automatically extracts, analyze, visualize and integrate molecular pathway data from published peer reviewed articles and more than eight million abstracts [226].
Promoter analysis
Transcription factor binding sites (TFBS) in promoter sequences of regulated genes were identified within the Genomatix software suite (Munich, Germany). For this purpose DEGs implicated in inflammation, immune, stress, hypoxia, cytokine stimulus, acute-phase responses, cytotoxicity (cell death and apoptosis) and oxidation-reduction processes were retrieved and inspected with the Gene2Promoter tool. The promoter sequences were extracted and transcription start sites (TSS) were automatically assigned on the basis of 5′ cap site database entries. Next, the cis-regulatory binding sites of genomic sequences with a length of -1000 to +100 base pairs relative to TSS were interrogated with the MatInspector tool. Overrepresented (=enriched) TFBS were defined based on statistical significance and by calculating the Z-scores using the vertebrate matrix family library version 9.2 (IUPAC strings and predefined IUPAC libraries) [227].
In addition, composite modules based on the co-occupancy of sets of significantly enriched TFBS in promoters of regulated genes were computed using DEGs as input function. After individual TFBS such modules represent the next level of functional organization. We used the following parameters to predict specific TFBS combinations: The quorum constraint for framework, i.e. minimum number of sequences to contain the common framework was set as 75%, minimum number of TFBSs in a framework 2, variation of distance range 20 bp, minimum distance 10 bp and a maximum distance of 200 bp between TFBS. Eventually the FrameWorker tool listed all modules up to a given number of elements that are found to be common among input sequences.
Abbreviations
ADR: Adverse drug reaction; ADME: Absorption, distribution, metabolism and excretion; AKR1C3: Aldo-keto reductase family 1 member C3; ALB: Albumin; ALP: Alkaline phosphatase; ALT: Alanine aminotransferase; APC: Antigen presenting cell; AST: Serum aspartate aminotransferase; BUN: Blood urea nitrogen; CA: Carbonic anhydrase; CAE: Chloracetate esterase; CARPA: Complement activation-related pseudoallergy; CK: Creatine phosphokinase; COX: Cyclooxygenase; CREA: Creatinine; CYP: Cytochrome P450; DAMPs: Danger-associated molecular patterns; DEGs: Differentially expressed genes; DILI: Drug-induced liver injury; EMA: European Medicine Agency; GGT: Gamma glutamyl transferase; GLU: Glucose; GO: Gene Ontology; H&E: Hematoxylin and Eosin; HCT: Hematocrit; HD: High dose; HGB: Haemoglobin; IFN: Interferon; Ig: Immunoglobulin; IHC: Immunohistochemistry; IL: Interleukin; LD: Low dose; LPS: Lipopolysaccharide; LUC: Large undifferentiated cells; MAC: Membrane attack complex; MeV: Multi Experimental Viewer; MPO: Myeloperoxidase; NMDA: N-methyl-D-aspartate receptor; NSAID: Nonsteroidal anti-inflammatory drug; PAS: Periodic acid-Schiff reaction; PLT: Platelet; PPI: protein-protein interaction; PRAC: Pharmacovigilance Risk Assessment Committee; RBC: Red blood cells; ROS: Reactive oxygen species; TBIL: Total bilirubin; TFBS: Transcription factor binding site; TG: Triglyceride; Th: T helper cells; TLR: Toll-like receptor; TNF: Tumour necrosis factor; TP: Total protein; TSS: Transcription start site; VLCFA: Very long chain fatty acids; WBC: White blood cells.
Author contributions
HYH and SY were in charge of the animal study and supervised the animal technicians. JHO performed the microarray study. EHL performed the RT-qPCR studies. JB and RS performed the histopathology study and together with FL interpreted the results. SS performed complex data analysis and the bioinformatics and computational biology studies. SS constructed regulatory gene and protein interaction networks based on transcription factor and master regulatory molecules. SS prepared a draft of the bioinformatics part of the manuscript. All authors discussed the data. JB wrote the final manuscript that was approved by all authors.
ACKNOWLEDGMENTS
The technical assistance of Gabi Onken in performing immunohistopathology is gratefully acknowledged. The authors are thankful to Frauke Schoppmeier for the preparation of the histopathology Figures.
CONFLICTS OF INTEREST
The authors declare that they have no competing interests.
FUNDING
The financial support from The Virtual Liver Network (grant 031 6154) of the German Federal Ministry of Education and Research (BMBF) to JB is gratefully acknowledged. The cooperation between the Division of Predictive Toxicology, Korea Institute of Toxicology and the Institute of Pharmaco- and Toxicogenomics of Hannover Medical School is supported by a mobility program of the BMBF (grant 01DR14013 to JB). Furthermore, the work was supported by a grant (NRF-2016M3A9C4953144, 2017R1A6A3A01011544) from the Ministry of Science, ICT, and Future Planning and a general research grant (KK-1702) from the Korea Institute of Toxicology to JHO.
The funders had no role in study design, data collection and analysis, decision to publish, or preparation of the manuscript.
REFERENCES
1. Zuckner J. International experience with diclofenac in rheumatoid arthritis. Am J Med. 1986; 80:39-42.
2. van Laar M, Pergolizzi JV Jr, Mellinghoff HU, Merchante IM, Nalamachu S, O'Brien J, Perrot S, Raffa RB. Pain treatment in arthritis-related pain: beyond NSAIDs. Open Rheumatol J. 2012; 6:320-330.
3. Praskova E, Voslarova E, Siroka Z, Plhalova L, Macova S, Marsalek P, Pistekova V, Svobodova Z. Assessment of diclofenac LC50 reference values in juvenile and embryonic stages of the zebrafish (Danio rerio). Pol J Vet Sci. 2011; 14:545-549.
4. Chen JB, Gao HW, Zhang YL, Zhang Y, Zhou XF, Li CQ, Gao HP. Developmental toxicity of diclofenac and elucidation of gene regulation in zebrafish (Danio rerio). Sci Rep. 2014; 4:4841.
5. Gan TJ. Diclofenac: an update on its mechanism of action and safety profile. Curr Med Res Opin. 2010; 26:1715-1731.
6. Kato M, Nishida S, Kitasato H, Sakata N, Kawai S. Cyclooxygenase-1 and cyclooxygenase-2 selectivity of non-steroidal anti-inflammatory drugs: investigation using human peripheral monocytes. J Pharm Pharmacol. 2001; 53:1679-1685.
7. Sharma JN, Mohammed LA. The role of leukotrienes in the pathophysiology of inflammatory disorders: is there a case for revisiting leukotrienes as therapeutic targets? Inflammopharmacology. 2006; 14:10-16.
8. Adamson DJ, Frew D, Tatoud R, Wolf CR, Palmer CN. Diclofenac antagonizes peroxisome proliferator-activated receptor-gamma signaling. Mol Pharmacol. 2002; 61:7-12.
9. European Medicines Agency. PRAC recommends the same cardiovascular precautions for diclofenac as for selective COX-2 inhibitors 14/06/2013 (EMA/353084/2013). http://www.ema.europa.eu/docs/en_GB/document_library/Press_release/2013/06/WC500144451.pdf. Accessed 11 May 2017.
10. NIH LiverTox database. Diclofenac. https://livertox.nih.gov/Diclofenac.htm. Accessed 11 May 2017.
11. Laine L, Goldkind L, Curtis SP, Connors LG, Yanqiong Z, Cannon CP. How common is diclofenac-associated liver injury? Analysis of 17,289 arthritis patients in a long-term prospective clinical trial. Am J Gastroenterol. 2009; 104:356-362.
12. Bjornsson ES, Bergmann OM, Bjornsson HK, Kvaran RB, Olafsson S. Incidence, presentation, and outcomes in patients with drug-induced liver injury in the general population of Iceland. Gastroenterology. 2013; 144:1419-25.
13. Boelsterli UA. Diclofenac-induced liver injury: a paradigm of idiosyncratic drug toxicity. Toxicol Appl Pharmacol. 2003; 192:307-322.
14. Aithal GP. Hepatotoxicity related to antirheumatic drugs. Nat Rev Rheumatol. 2011; 7:139-150.
15. Aithal GP, Ramsay L, Daly AK, Sonchit N, Leathart JB, Alexander G, Kenna JG, Caldwell J, Day CP. Hepatic adducts, circulating antibodies, and cytokine polymorphisms in patients with diclofenac hepatotoxicity. Hepatology. 2004; 39:1430-1440.
16. Maria VA, Pinto L, Victorino RM. Lymphocyte reactivity to ex-vivo drug antigens in drug-induced hepatitis. J Hepatol. 1994; 21:151-158.
17. Lee EH, Oh JH, Selvaraj S, Park SM, Choi MS, Spanel R, Yoon S, Borlak J. Immunogenomics reveal molecular circuits of diclofenac induced liver injury in mice. Oncotarget. 2016; 7:14983-15017. https://doi.org/10.18632/oncotarget.7698.
18. Akcay A, Nguyen Q, Edelstein CL. Mediators of inflammation in acute kidney injury. Mediators Inflamm. 2009; 2009:137072.
19. Adams DH, Ju C, Ramaiah SK, Uetrecht J, Jaeschke H. Mechanisms of immune-mediated liver injury. Toxicol Sci. 2010; 115:307-321.
20. Njoku DB. Suppressive and pro-inflammatory roles for IL-4 in the pathogenesis of experimental drug-induced liver injury: a review. Expert Opin Drug Metab Toxicol. 2010; 6:519-531.
21. Paust HJ, Turner JE, Riedel JH, Disteldorf E, Peters A, Schmidt T, Krebs C, Velden J, Mittrucker HW, Steinmetz OM, Stahl RA, Panzer U. Chemokines play a critical role in the cross-regulation of Th1 and Th17 immune responses in murine crescentic glomerulonephritis. Kidney Int. 2012; 82:72-83.
22. Yano A, Higuchi S, Tsuneyama K, Fukami T, Nakajima M, Yokoi T. Involvement of immune-related factors in diclofenac-induced acute liver injury in mice. Toxicology. 2012; 293:107-114.
23. Pachkoria K, Lucena MI, Crespo E, Ruiz-Cabello F, Lopez-Ortega S, Fernandez MA, Romero-Gomez M, Madrazo A, Duran JA, de Dios AM, Borraz Y, Navarro JM, Andrade RJ, et al. Analysis of IL-10, IL-4 and TNF-alpha polymorphisms in drug-induced liver injury (DILI) and its outcome. J Hepatol. 2008; 49:107-114.
24. Mestas J, Hughes CC. Of mice and not men: differences between mouse and human immunology. J Immunol. 2004; 172:2731-2738.
25. Olson H, Betton G, Robinson D, Thomas K, Monro A, Kolaja G, Lilly P, Sanders J, Sipes G, Bracken W, Dorato M, Van Deun K, Smith P, et al. Concordance of the toxicity of pharmaceuticals in humans and in animals. Regul Toxicol Pharmacol. 2000; 32:56-67.
26. Radi ZA, Khan NK. Effects of cyclooxygenase inhibition on the gastrointestinal tract. Exp Toxicol Pathol. 2006; 58:163-173.
27. Li J, Zhang N, Ye B, Ju W, Orser B, Fox JE, Wheeler MB, Wang Q, Lu WY. Non-steroidal anti-inflammatory drugs increase insulin release from beta cells by inhibiting ATP-sensitive potassium channels. Br J Pharmacol. 2007; 151:483-493.
28. Grieff M, Bushinsky DA. Diuretics and disorders of calcium homeostasis. Semin Nephrol. 2011; 31:535-541.
29. Raisanen SR, Lehenkari P, Tasanen M, Rahkila P, Harkonen PL, Vaananen HK. Carbonic anhydrase III protects cells from hydrogen peroxide-induced apoptosis. FASEB J. 1999; 13:513-522.
30. Kharbanda KK, Vigneswara V, McVicker BL, Newlaczyl AU, Bailey K, Tuma D, Ray DE, Carter WG. Proteomics reveal a concerted upregulation of methionine metabolic pathway enzymes, and downregulation of carbonic anhydrase-III, in betaine supplemented ethanol-fed rats. Biochem Biophys Res Commun. 2009; 381:523-527.
31. Lei Y, Huang T, Su M, Luo J, Korteweg C, Li J, Chen Z, Qiu Y, Liu X, Yan M, Wang Y, Gu J. Expression and distribution of immunoglobulin G in the normal liver, hepatocarcinoma and postpartial hepatectomy liver. Lab Invest. 2014; 94:1283-1295.
32. Richards JA, Bucsaiova M, Hesketh EE, Ventre C, Henderson NC, Simpson K, Bellamy CO, Howie SE, Anderton SM, Hughes J, Wigmore SJ. Acute Liver Injury Is Independent of B Cells or Immunoglobulin M. PLoS One. 2015; 10:e0138688.
33. Ogden CA, Kowalewski R, Peng Y, Montenegro V, Elkon KB. IGM is required for efficient complement mediated phagocytosis of apoptotic cells in vivo. Autoimmunity. 2005; 38:259-264.
34. Chen Y, Park YB, Patel E, Silverman GJ. IgM antibodies to apoptosis-associated determinants recruit C1q and enhance dendritic cell phagocytosis of apoptotic cells. J Immunol. 2009; 182:6031-6043.
35. Zou L, Feng Y, Li Y, Zhang M, Chen C, Cai J, Gong Y, Wang L, Thurman JM, Wu X, Atkinson JP, Chao W. Complement factor B is the downstream effector of TLRs and plays an important role in a mouse model of severe sepsis. J Immunol. 2013; 191:5625-5635.
36. Qin X, Gao B. The complement system in liver diseases. Cell Mol Immunol. 2006; 3:333-340.
37. Byrne SN, Hammond KJ, Chan CY, Rogers LJ, Beaugie C, Rana S, Marsh-Wakefield F, Thurman JM, Halliday GM. The alternative complement component factor B regulates UV-induced oedema, systemic suppression of contact and delayed hypersensitivity, and mast cell infiltration into the skin. Photochem Photobiol Sci. 2015; 14:801-806.
38. Krystel-Whittemore M, Dileepan KN, Wood JG. Mast Cell: A Multi-Functional Master Cell. Front Immunol. 2016; 6:620.
39. Markiewski MM, Mastellos D, Tudoran R, DeAngelis RA, Strey CW, Franchini S, Wetsel RA, Erdei A, Lambris JD. C3a and C3b activation products of the third component of complement (C3) are critical for normal liver recovery after toxic injury. J Immunol. 2004; 173:747-754.
40. Strey CW, Markiewski M, Mastellos D, Tudoran R, Spruce LA, Greenbaum LE, Lambris JD. The proinflammatory mediators C3a and C5a are essential for liver regeneration. J Exp Med. 2003; 198:913-923.
41. Marzano C, Cazals-Hatem D, Rautou PE, Valla DC. The significance of nonobstructive sinusoidal dilatation of the liver: Impaired portal perfusion or inflammatory reaction syndrome. Hepatology. 2015; 62:956-963.
42. Kato M, McDonald KJ, Khan S, Ross IL, Vuckovic S, Chen K, Munster D, MacDonald KP, Hart DN. Expression of human DEC-205 (CD205) multilectin receptor on leukocytes. Int Immunol. 2006; 18:857-869.
43. Pietrzak-Nguyen A, Fichter M, Dedters M, Pretsch L, Gregory SH, Meyer C, Doganci A, Diken M, Landfester K, Baier G, Gehring S. Enhanced in vivo targeting of murine nonparenchymal liver cells with monophosphoryl lipid A functionalized microcapsules. Biomacromolecules. 2014; 15:2378-2388.
44. Shrimpton RE, Butler M, Morel AS, Eren E, Hue SS, Ritter MA. CD205 (DEC-205): a recognition receptor for apoptotic and necrotic self. Mol Immunol. 2009; 46:1229-1239.
45. Ohtani H. Granuloma cells in chronic inflammation express CD205 (DEC205) antigen and harbor proliferating T lymphocytes: similarity to antigen-presenting cells. Pathol Int. 2013; 63:85-93.
46. Hou X, Hao X, Zheng M, Xu C, Wang J, Zhou R, Tian Z. CD205-TLR9-IL-12 axis contributes to CpG-induced oversensitive liver injury in HBsAg transgenic mice by promoting the interaction of NKT cells with Kupffer cells. Cell Mol Immunol. 2016.
47. Leng L, Metz CN, Fang Y, Xu J, Donnelly S, Baugh J, Delohery T, Chen Y, Mitchell RA, Bucala R. MIF signal transduction initiated by binding to CD74. J Exp Med. 2003; 197:1467-1476.
48. Koch KS, Leffert HL. Ectopic expression of CD74 in Ikkbeta-deleted mouse hepatocytes. Acta Histochem. 2011; 113:428-435.
49. Assis DN, Leng L, Du X, Zhang CK, Grieb G, Merk M, Garcia AB, McCrann C, Chapiro J, Meinhardt A, Mizue Y, Nikolic-Paterson DJ, Bernhagen J, et al. The role of macrophage migration inhibitory factor in autoimmune liver disease. Hepatology. 2014; 59:580-591.
50. Eltzschig HK, Carmeliet P. Hypoxia and inflammation. N Engl J Med. 2011; 364:656-665.
51. Walczak-Drzewiecka A, Ratajewski M, Wagner W, Dastych J. HIF-1alpha is up-regulated in activated mast cells by a process that involves calcineurin and NFAT. J Immunol. 2008; 181:1665-1672.
52. Anthony D, McQualter JL, Bishara M, Lim EX, Yatmaz S, Seow HJ, Hansen M, Thompson M, Hamilton JA, Irving LB, Levy BD, Vlahos R, Anderson GP, et al. SAA drives proinflammatory heterotypic macrophage differentiation in the lung via CSF-1R-dependent signaling. FASEB J. 2014; 28:3867-3877.
53. Cook-Mills JM, Marchese ME, Abdala-Valencia H. Vascular cell adhesion molecule-1 expression and signaling during disease: regulation by reactive oxygen species and antioxidants. Antioxid Redox Signal. 2011; 15:1607-1638.
54. Sakai A. Diclofenac inhibits endothelial cell adhesion molecule expression induced with lipopolysaccharide. Life Sci. 1996; 58:2377-2387.
55. Kapiotis S, Sengoelge G, Sperr WR, Baghestanian M, Quehenberger P, Bevec D, Li SR, Menzel EJ, Muhl A, Zapolska D, Virgolini I, Valent P, Speiser W. Ibuprofen inhibits pyrogen-dependent expression of VCAM-1 and ICAM-1 on human endothelial cells. Life Sci. 1996; 58:2167-2181.
56. Hofbauer R, Speiser W, Kapiotis S. Ibuprofen inhibits leukocyte migration through endothelial cell monolayers. Life Sci. 1998; 62:1775-1781.
57. Dutta P, Hoyer FF, Grigoryeva LS, Sager HB, Leuschner F, Courties G, Borodovsky A, Novobrantseva T, Ruda VM, Fitzgerald K, Iwamoto Y, Wojtkiewicz G, Sun Y, et al. Macrophages retain hematopoietic stem cells in the spleen via VCAM-1. J Exp Med. 2015; 212:497-512.
58. Nussbaum C, Klinke A, Adam M, Baldus S, Sperandio M. Myeloperoxidase: a leukocyte-derived protagonist of inflammation and cardiovascular disease. Antioxid Redox Signal. 2013; 18:692-713.
59. Zuurbier KW, Bakkenist AR, Fokkens RH, Nibbering NM, Wever R, Muijsers AO. Interaction of myeloperoxidase with diclofenac. Inhibition of the chlorinating activity of myeloperoxidase by diclofenac and oxidation of diclofenac to dihydroxyazobenzene by myeloperoxidase. Biochem Pharmacol. 1990; 40:1801-1808.
60. Savill JS, Wyllie AH, Henson JE, Walport MJ, Henson PM, Haslett C. Macrophage phagocytosis of aging neutrophils in inflammation. Programmed cell death in the neutrophil leads to its recognition by macrophages. J Clin Invest. 1989; 83:865-875.
61. Silva MT. Macrophage phagocytosis of neutrophils at inflammatory/infectious foci: a cooperative mechanism in the control of infection and infectious inflammation. J Leukoc Biol. 2011; 89:675-683.
62. Date D, Das R, Narla G, Simon DI, Jain MK, Mahabeleshwar GH. Kruppel-like transcription factor 6 regulates inflammatory macrophage polarization. J Biol Chem. 2014; 289:10318-10329.
63. Bochenek G, Nizankowska E, Gielicz A, Swierczynska M, Szczeklik A. Plasma 9alpha, 11beta-PGF2, a PGD2 metabolite, as a sensitive marker of mast cell activation by allergen in bronchial asthma. Thorax. 2004; 59:459-464.
64. Suzuki T, Hashimoto S, Toyoda N, Nagai S, Yamazaki N, Dong HY, Sakai J, Yamashita T, Nukiwa T, Matsushima K. Comprehensive gene expression profile of LPS-stimulated human monocytes by SAGE. Blood. 2000; 96:2584-2591.
65. Kopitar-Jerala N. The role of cystatins in cells of the immune system. FEBS Lett. 2006; 580:6295-6301.
66. Han X, Sun Y, Scott S, Bleich D. Tissue inhibitor of metalloproteinase-1 prevents cytokine-mediated dysfunction and cytotoxicity in pancreatic islets and beta-cells. Diabetes. 2001; 50:1047-1055.
67. Kobayashi T, Zadravec D, Jacobsson A. ELOVL2 overexpression enhances triacylglycerol synthesis in 3T3-L1 and F442A cells. FEBS Lett. 2007; 581:3157-3163.
68. Wong LL, Fan ST, Man K, Sit WH, Jiang PP, Jor IW, Lee CY, Ling WL, Tam KT, Wan JM. Identification of liver proteins and their roles associated with carbon tetrachloride-induced hepatotoxicity. Hum Exp Toxicol. 2011; 30:1369-1381.
69. Tarantino G, Di Minno MN, Capone D. Drug-induced liver injury: is it somehow foreseeable? World J Gastroenterol. 2009; 15:2817-2833.
70. Chalasani N, Bjornsson E. Risk factors for idiosyncratic drug-induced liver injury. Gastroenterology. 2010; 138:2246-2259.
71. Gomez-Lechon MJ, Ponsoda X, O'Connor E, Donato T, Jover R, Castell JV. Diclofenac induces apoptosis in hepatocytes. Toxicol in vitro. 2003; 17:675-680.
72. Kessova IG, Ho YS, Thung S, Cederbaum AI. Alcohol-induced liver injury in mice lacking Cu, Zn-superoxide dismutase. Hepatology. 2003; 38:1136-1145.
73. Ogishima T, Kinoshita JY, Mitani F, Suematsu M, Ito A. Identification of outer mitochondrial membrane cytochrome b5 as a modulator for androgen synthesis in Leydig cells. J Biol Chem. 2003; 278:21204-21211.
74. Hardwick JP. Cytochrome P450 omega hydroxylase (CYP4) function in fatty acid metabolism and metabolic diseases. Biochem Pharmacol. 2008; 75:2263-2275.
75. Liu ZX, Govindarajan S, Kaplowitz N. Innate immune system plays a critical role in determining the progression and severity of acetaminophen hepatotoxicity. Gastroenterology. 2004; 127:1760-1774.
76. Njoku DB. Drug-induced hepatotoxicity: metabolic, genetic and immunological basis. Int J Mol Sci. 2014; 15:6990-7003.
77. Chen M, Suzuki A, Borlak J, Andrade RJ, Lucena MI. Drug-induced liver injury: Interactions between drug properties and host factors. J Hepatol. 2015; 63:503-514.
78. Gao B, Jeong WI, Tian Z. Liver: An organ with predominant innate immunity. Hepatology. 2008; 47:729-736.
79. Crispe IN. The liver as a lymphoid organ. Annu Rev Immunol. 2009; 27:147-163.
80. Sun X, Cheng G, Hao M, Zheng J, Zhou X, Zhang J, Taichman RS, Pienta KJ, Wang J. CXCL12 / CXCR4 / CXCR7 chemokine axis and cancer progression. Cancer Metastasis Rev. 2010; 29:709-722.
81. Wong MM, Fish EN. Chemokines: attractive mediators of the immune response. Semin Immunol. 2003; 15:5-14.
82. Karin N. The multiple faces of CXCL12 (SDF-1alpha) in the regulation of immunity during health and disease. J Leukoc Biol. 2010; 88:463-473.
83. Bode JG, Albrecht U, Haussinger D, Heinrich PC, Schaper F. Hepatic acute phase proteins--regulation by IL-6- and IL-1-type cytokines involving STAT3 and its crosstalk with NF-kappaB-dependent signaling. Eur J Cell Biol. 2012; 91:496-505.
84. Schulte W, Bernhagen J, Bucala R. Cytokines in sepsis: potent immunoregulators and potential therapeutic targets—an updated view. Mediators Inflamm. 2013; 2013:165974.
85. Cover C, Liu J, Farhood A, Malle E, Waalkes MP, Bajt ML, Jaeschke H. Pathophysiological role of the acute inflammatory response during acetaminophen hepatotoxicity. Toxicol Appl Pharmacol. 2006; 216:98-107.
86. Toyoda Y, Endo S, Tsuneyama K, Miyashita T, Yano A, Fukami T, Nakajima M, Yokoi T. Mechanism of exacerbative effect of progesterone on drug-induced liver injury. Toxicol Sci. 2012; 126:16-27.
87. Miller AM. Role of IL-33 in inflammation and disease. J Inflamm (Lond). 2011; 8:22.
88. Akiyama T, Shinzawa M, Akiyama N. RANKL-RANK interaction in immune regulatory systems. World J Orthop. 2012; 3:142-150.
89. Sakai N, Van Sweringen HL, Schuster R, Blanchard J, Burns JM, Tevar AD, Edwards MJ, Lentsch AB. Receptor activator of nuclear factor-kappaB ligand (RANKL) protects against hepatic ischemia/reperfusion injury in mice. Hepatology. 2012; 55:888-897.
90. Zhang Z, Li LY. TNFSF15 Modulates Neovascularization and Inflammation. Cancer Microenviron. 2012; 5:237-247.
91. Aiba Y, Nakamura M. The role of TL1A and DR3 in autoimmune and inflammatory diseases. Mediators Inflamm. 2013; 2013:258164.
92. Begue B, Wajant H, Bambou JC, Dubuquoy L, Siegmund D, Beaulieu JF, Canioni D, Berrebi D, Brousse N, Desreumaux P, Schmitz J, Lentze MJ, Goulet O, et al. Implication of TNF-related apoptosis-inducing ligand in inflammatory intestinal epithelial lesions. Gastroenterology. 2006; 130:1962-1974.
93. Uesugi T, Froh M, Arteel GE, Bradford BU, Wheeler MD, Gabele E, Isayama F, Thurman RG. Role of lipopolysaccharide-binding protein in early alcohol-induced liver injury in mice. J Immunol. 2002; 168:2963-2969.
94. Guo J, Friedman SL. Toll-like receptor 4 signaling in liver injury and hepatic fibrogenesis. Fibrogenesis Tissue Repair. 2010; 3:21.
95. Soares JB, Pimentel-Nunes P, Roncon-Albuquerque R, Leite-Moreira A. The role of lipopolysaccharide/toll-like receptor 4 signaling in chronic liver diseases. Hepatol Int. 2010; 4:659-672.
96. Fang H, Liu A, Dirsch O, Dahmen U. Liver transplantation and inflammation: is lipopolysaccharide binding protein the link? Cytokine. 2013; 64:71-78.
97. Starnes T, Rasila KK, Robertson MJ, Brahmi Z, Dahl R, Christopherson K, Hromas R. The chemokine CXCL14 (BRAK) stimulates activated NK cell migration: implications for the downregulation of CXCL14 in malignancy. Exp Hematol. 2006; 34:1101-1105.
98. Chen L, Guo L, Tian J, He H, Marinova E, Zhang P, Zheng B, Han S. Overexpression of CXC chemokine ligand 14 exacerbates collagen-induced arthritis. J Immunol. 2010; 184:4455-4459.
99. Hara T, Tanegashima K. Pleiotropic functions of the CXC-type chemokine CXCL14 in mammals. J Biochem. 2012; 151:469-476.
100. Xia Y, Entman ML, Wang Y. Critical role of CXCL16 in hypertensive kidney injury and fibrosis. Hypertension. 2013; 62:1129-1137.
101. Izquierdo MC, Martin-Cleary C, Fernandez-Fernandez B, Elewa U, Sanchez-Nino MD, Carrero JJ, Ortiz A. CXCL16 in kidney and cardiovascular injury. Cytokine Growth Factor Rev. 2014; 25:317-325.
102. Izquierdo MC, Sanz AB, Mezzano S, Blanco J, Carrasco S, Sanchez-Nino MD, Benito-Martin A, Ruiz-Ortega M, Egido J, Ortiz A. TWEAK (tumor necrosis factor-like weak inducer of apoptosis) activates CXCL16 expression during renal tubulointerstitial inflammation. Kidney Int. 2012; 81:1098-1107.
103. Zhen J, Li Q, Zhu Y, Yao X, Wang L, Zhou A, Sun S. Increased serum CXCL16 is highly correlated with blood lipids, urine protein and immune reaction in children with active nephrotic syndrome. Diagn Pathol. 2014; 9:23.
104. Welsh-Bacic D, Lindenmeyer M, Cohen CD, Draganovici D, Mandelbaum J, Edenhofer I, Ziegler U, Regele H, Wuthrich RP, Segerer S. Expression of the chemokine receptor CCR6 in human renal inflammation. Nephrol Dial Transplant. 2011; 26:1211-1220.
105. Huang C, Pollock CA, Chen XM. High glucose induces CCL20 in proximal tubular cells via activation of the KCa3.1 channel. PLoS One. 2014; 9:e95173.
106. Ciccia F, Alessandro R, Rodolico V, Guggino G, Raimondo S, Guarnotta C, Giardina A, Sireci G, Campisi G, De Leo G, Triolo G. IL-34 is overexpressed in the inflamed salivary glands of patients with Sjogren's syndrome and is associated with the local expansion of pro-inflammatory CD14(bright)CD16+ monocytes. Rheumatology (Oxford). 2013; 52:1009-1017.
107. Masteller EL, Wong BR. Targeting IL-34 in chronic inflammation. Drug Discov Today. 2014; 19:1212-1216.
108. Kotenko SV. The family of IL-10-related cytokines and their receptors: related, but to what extent? Cytokine Growth Factor Rev. 2002; 13:223-240.
109. Wolk K, Witte E, Witte K, Warszawska K, Sabat R. Biology of interleukin-22. Semin Immunopathol. 2010; 32:17-31.
110. de Weerd NA, Nguyen T. The interferons and their receptors—distribution and regulation. Immunol. Cell Biol. 2012; 90:483-491.
111. Matsui F, Meldrum KK. The role of the Janus kinase family/signal transducer and activator of transcription signaling pathway in fibrotic renal disease. J Surg Res. 2012; 178:339-345.
112. Marrero MB, Banes-Berceli AK, Stern DM, Eaton DC. Role of the JAK/STAT signaling pathway in diabetic nephropathy. Am J Physiol Renal Physiol. 2006; 290:F762-8.
113. Berthier CC, Zhang H, Schin M, Henger A, Nelson RG, Yee B, Boucherot A, Neusser MA, Cohen CD, Carter-Su C, Argetsinger LS, Rastaldi MP, Brosius FC, et al. Enhanced expression of Janus kinase-signal transducer and activator of transcription pathway members in human diabetic nephropathy. Diabetes. 2009; 58:469-477.
114. Zhang W, Chen X, Shi S, Wei R, Wang J, Yamanaka N, Hong Q. Expression and activation of STAT3 in chronic proliferative immune complex glomerulonephritis and the effect of fosinopril. Nephrol Dial Transplant. 2005; 20:892-901.
115. Arakawa T, Masaki T, Hirai T, Doi S, Kuratsune M, Arihiro K, Kohno N, Yorioka N. Activation of signal transducer and activator of transcription 3 correlates with cell proliferation and renal injury in human glomerulonephritis. Nephrol Dial Transplant. 2008; 23:3418-3426.
116. Yang N, Luo M, Li R, Huang Y, Zhang R, Wu Q, Wang F, Li Y, Yu X. Blockage of JAK/STAT signalling attenuates renal ischaemia-reperfusion injury in rat. Nephrol Dial Transplant. 2008; 23:91-100.
117. Imig JD, Ryan MJ. Immune and inflammatory role in renal disease. Compr Physiol. 2013; 3:957-976.
118. Diepenhorst GM, van Gulik TM, Hack CE. Complement-mediated ischemia-reperfusion injury: lessons learned from animal and clinical studies. Ann Surg. 2009; 249:889-899.
119. McCaughan JA, O'Rourke DM, Courtney AE. The complement cascade in kidney disease: from sideline to center stage. Am J Kidney Dis. 2013; 62:604-614.
120. Thurman JM, Holers VM. The central role of the alternative complement pathway in human disease. J Immunol. 2006; 176:1305-1310.
121. Zhou W, Farrar CA, Abe K, Pratt JR, Marsh JE, Wang Y, Stahl GL, Sacks SH. Predominant role for C5b-9 in renal ischemia/reperfusion injury. J Clin Invest. 2000; 105:1363-1371.
122. Danobeitia JS, Djamali A, Fernandez LA. The role of complement in the pathogenesis of renal ischemia-reperfusion injury and fibrosis. Fibrogenesis Tissue Repair. 2014; 7:16.
123. Gorter A, Blok VT, Haasnoot WH, Ensink NG, Daha MR, Fleuren GJ. Expression of CD46, CD55, and CD59 on renal tumor cell lines and their role in preventing complement-mediated tumor cell lysis. Lab Invest. 1996; 74:1039-1049.
124. Nangaku M. Complement regulatory proteins in glomerular diseases. Kidney Int. 1998; 54:1419-1428.
125. Kyriakis JM, Avruch J. Mammalian MAPK signal transduction pathways activated by stress and inflammation: a 10-year update. Physiol Rev. 2012; 92:689-737.
126. Nakagawa H, Maeda S. Molecular mechanisms of liver injury and hepatocarcinogenesis: focusing on the role of stress-activated MAPK. Patholog Res Int. 2012; 2012:172894.
127. Guegan JP, Ezan F, Theret N, Langouet S, Baffet G. MAPK signaling in cisplatin-induced death: predominant role of ERK1 over ERK2 in human hepatocellular carcinoma cells. Carcinogenesis. 2013; 34:38-47.
128. Nikolaou K, Sarris M, Talianidis I. Molecular pathways: the complex roles of inflammation pathways in the development and treatment of liver cancer. Clin Cancer Res. 2013; 19:2810-2816.
129. Breitkopf K, Sawitza I, Westhoff JH, Wickert L, Dooley S, Gressner AM. Thrombospondin 1 acts as a strong promoter of transforming growth factor beta effects via two distinct mechanisms in hepatic stellate cells. Gut. 2005; 54:673-681.
130. Kanemoto H, Ohno K, Sakai M, Nakashima K, Takahashi M, Fujino Y, Tsujimoto H. Expression of fibrosis-related genes in canine chronic hepatitis. Vet Pathol. 2011; 48:839-845.
131. Lopez-Dee Z, Pidcock K, Gutierrez LS. Thrombospondin-1: multiple paths to inflammation. Mediators Inflamm. 2011; 2011:296069.
132. Daniel C, Wiede J, Krutzsch HC, Ribeiro SM, Roberts DD, Murphy-Ullrich JE, Hugo C. Thrombospondin-1 is a major activator of TGF-beta in fibrotic renal disease in the rat in vivo. Kidney Int. 2004; 65:459-468.
133. Bige N, Shweke N, Benhassine S, Jouanneau C, Vandermeersch S, Dussaule JC, Chatziantoniou C, Ronco P, Boffa JJ. Thrombospondin-1 plays a profibrotic and pro-inflammatory role during ureteric obstruction. Kidney Int. 2012; 81:1226-1238.
134. Bige N, Boffa JJ, Lepeytre F, Shweke N. Role of thrombospondin-1 in the development of kidney diseases. Med Sci (Paris). 2013; 29:1131-1137.
135. Kondou H, Mushiake S, Etani Y, Miyoshi Y, Michigami T, Ozono K. A blocking peptide for transforming growth factor-beta1 activation prevents hepatic fibrosis in vivo. J Hepatol. 2003; 39:742-748.
136. Smalling RL, Delker DA, Zhang Y, Nieto N, McGuiness MS, Liu S, Friedman SL, Hagedorn CH, Wang L. Genome-wide transcriptome analysis identifies novel gene signatures implicated in human chronic liver disease. Am J Physiol Gastrointest Liver Physiol. 2013; 305:G364-74.
137. Rogers NM, Sharifi-Sanjani M, Csanyi G, Pagano PJ, Isenberg JS. Thrombospondin-1 and CD47 regulation of cardiac, pulmonary and vascular responses in health and disease. Matrix Biol. 2014; 37:92-101.
138. Hayashi H, Sakai K, Baba H, Sakai T. Thrombospondin-1 is a novel negative regulator of liver regeneration after partial hepatectomy through transforming growth factor-beta1 activation in mice. Hepatology. 2012; 55:1562-1573.
139. Romas E, Gillespie MT, Martin TJ. Involvement of receptor activator of NFkappaB ligand and tumor necrosis factor-alpha in bone destruction in rheumatoid arthritis. Bone. 2002; 30:340-346.
140. Aggarwal BB. Signalling pathways of the TNF superfamily: a double-edged sword. Nat Rev Immunol. 2003; 3:745-756.
141. Ishihara K, Namura T, Murayama H, Arai S, Totani M, Ikemoto M. Possibility of formation of the S100A8/A9-proinflammatory cytokine complexes in vivo in acute inflammation and their functional roles. Rinsho Byori. 2009; 57:324-331.
142. Deng X, Luyendyk JP, Ganey PE, Roth RA. Inflammatory stress and idiosyncratic hepatotoxicity: hints from animal models. Pharmacol Rev. 2009; 61:262-282.
143. Yano A, Oda S, Fukami T, Nakajima M, Yokoi T. Development of a cell-based assay system considering drug metabolism and immune- and inflammatory-related factors for the risk assessment of drug-induced liver injury. Toxicol Lett. 2014; 228:13-24.
144. Tan Z, Qian X, Jiang R, Liu Q, Wang Y, Chen C, Wang X, Ryffel B, Sun B. IL-17A plays a critical role in the pathogenesis of liver fibrosis through hepatic stellate cell activation. J Immunol. 2013; 191:1835-1844.
145. Kobayashi M, Higuchi S, Mizuno K, Tsuneyama K, Fukami T, Nakajima M, Yokoi T. Interleukin-17 is involved in alpha-naphthylisothiocyanate-induced liver injury in mice. Toxicology. 2010; 275:50-57.
146. Higuchi S, Yano A, Takai S, Tsuneyama K, Fukami T, Nakajima M, Yokoi T. Metabolic activation and inflammation reactions involved in carbamazepine-induced liver injury. Toxicol Sci. 2012; 130:4-16.
147. Kobayashi E, Kobayashi M, Tsuneyama K, Fukami T, Nakajima M, Yokoi T. Halothane-induced liver injury is mediated by interleukin-17 in mice. Toxicol Sci. 2009; 111:302-310.
148. Mates JM. Effects of antioxidant enzymes in the molecular control of reactive oxygen species toxicology. Toxicology. 2000; 153:83-104.
149. Gomez-Lechon MJ, Ponsoda X, O'Connor E, Donato T, Castell JV, Jover R. Diclofenac induces apoptosis in hepatocytes by alteration of mitochondrial function and generation of ROS. Biochem Pharmacol. 2003; 66:2155-2167.
150. Videla LA, Rodrigo R, Orellana M, Fernandez V, Tapia G, Quinones L, Varela N, Contreras J, Lazarte R, Csendes A, Rojas J, Maluenda F, Burdiles P, et al. Oxidative stress-related parameters in the liver of non-alcoholic fatty liver disease patients. Clin Sci (Lond). 2004; 106:261-268.
151. Uchiyama S, Shimizu T, Shirasawa T. CuZn-SOD deficiency causes ApoB degradation and induces hepatic lipid accumulation by impaired lipoprotein secretion in mice. J Biol Chem. 2006; 281:31713-31719.
152. Han ES, Muller FL, Perez VI, Qi W, Liang H, Xi L, Fu C, Doyle E, Hickey M, Cornell J, Epstein CJ, Roberts LJ, Van Remmen H, et al. The in vivo gene expression signature of oxidative stress. Physiol Genomics. 2008; 34:112-126.
153. Leu JI, Crissey MA, Taub R. Massive hepatic apoptosis associated with TGF-beta1 activation after Fas ligand treatment of IGF binding protein-1-deficient mice. J Clin Invest. 2003; 111:129-139.
154. Lang CH, Nystrom GJ, Frost RA. Regulation of IGF binding protein-1 in hep G2 cells by cytokines and reactive oxygen species. Am J Physiol. 1999; 276:G719-27.
155. Scharf JG, Unterman TG, Kietzmann T. Oxygen-dependent modulation of insulin-like growth factor binding protein biosynthesis in primary cultures of rat hepatocytes. Endocrinology. 2005; 146:5433-5443.
156. Lee PD, Giudice LC, Conover CA, Powell DR. Insulin-like growth factor binding protein-1: recent findings and new directions. Proc Soc Exp Biol Med. 1997; 216:319-357.
157. Leu JI, George DL. Hepatic IGFBP1 is a prosurvival factor that binds to BAK, protects the liver from apoptosis, and antagonizes the proapoptotic actions of p53 at mitochondria. Genes Dev. 2007; 21:3095-3109.
158. Kondoh N, Wakatsuki T, Ryo A, Hada A, Aihara T, Horiuchi S, Goseki N, Matsubara O, Takenaka K, Shichita M, Tanaka K, Shuda M, Yamamoto M. Identification and characterization of genes associated with human hepatocellular carcinogenesis. Cancer Res. 1999; 59:4990-4996.
159. Hannivoort RA, Hernandez-Gea V, Friedman SL. Genomics and proteomics in liver fibrosis and cirrhosis. Fibrogenesis Tissue Repair. 2012; 5:1.
160. Mesotten D, Delhanty PJ, Vanderhoydonc F, Hardman KV, Weekers F, Baxter RC, Van Den Berghe G. Regulation of insulin-like growth factor binding protein-1 during protracted critical illness. J Clin Endocrinol Metab. 2002; 87:5516-5523.
161. Fantuzzi G, Faggioni R. Leptin in the regulation of immunity, inflammation, and hematopoiesis. J Leukoc Biol. 2000; 68:437-446.
162. Matarese G, Moschos S, Mantzoros CS. Leptin in immunology. J Immunol. 2005; 174:3137-3142.
163. Cottrell EC, Mercer JG. Leptin receptors. Handb Exp Pharmacol. 2012; 3-21.
164. Wolf G, Hamann A, Han DC, Helmchen U, Thaiss F, Ziyadeh FN, Stahl RA. Leptin stimulates proliferation and TGF-beta expression in renal glomerular endothelial cells: potential role in glomerulosclerosis. Kidney Int. 1999; 56:860-872.
165. Lord GM, Matarese G, Howard JK, Baker RJ, Bloom SR, Lechler RI. Leptin modulates the T-cell immune response and reverses starvation-induced immunosuppression. Nature. 1998; 394:897-901.
166. Wolf G, Ziyadeh FN. Leptin and renal fibrosis. Contrib Nephrol. 2006; 151:175-183.
167. Zarkesh-Esfahani H, Pockley G, Metcalfe RA, Bidlingmaier M, Wu Z, Ajami A, Weetman AP, Strasburger CJ, Ross RJ. High-dose leptin activates human leukocytes via receptor expression on monocytes. J Immunol. 2001; 167:4593-4599.
168. Bouloumie A, Marumo T, Lafontan M, Busse R. Leptin induces oxidative stress in human endothelial cells. FASEB J. 1999; 13:1231-1238.
169. Fernandez-Riejos P, Najib S, Santos-Alvarez J, Martin-Romero C, Perez-Perez A, Gonzalez-Yanes C, Sanchez-Margalet V. Role of leptin in the activation of immune cells. Mediators Inflamm. 2010; 2010:568343.
170. Joseph SB, Castrillo A, Laffitte BA, Mangelsdorf DJ, Tontonoz P. Reciprocal regulation of inflammation and lipid metabolism by liver X receptors. Nat Med. 2003; 9:213-219.
171. Castrillo A, Tontonoz P. Nuclear receptors in macrophage biology: at the crossroads of lipid metabolism and inflammation. Annu Rev Cell Dev Biol. 2004; 20:455-480.
172. Li AC, Glass CK. PPAR- and LXR-dependent pathways controlling lipid metabolism and the development of atherosclerosis. J Lipid Res. 2004; 45:2161-2173.
173. Wang Y, Moser AH, Shigenaga JK, Grunfeld C, Feingold KR. Downregulation of liver X receptor-alpha in mouse kidney and HK-2 proximal tubular cells by LPS and cytokines. J Lipid Res. 2005; 46:2377-2387.
174. Proctor G, Jiang T, Iwahashi M, Wang Z, Li J, Levi M. Regulation of renal fatty acid and cholesterol metabolism, inflammation, and fibrosis in Akita and OVE26 mice with type 1 diabetes. Diabetes. 2006; 55:2502-2509.
175. Miao J, Lesher AM, Miwa T, Sato S, Gullipalli D, Song WC. Tissue-specific deletion of Crry from mouse proximal tubular epithelial cells increases susceptibility to renal ischemia-reperfusion injury. Kidney Int. 2014; 86:726-737.
176. Thurman JM, Ljubanovic D, Edelstein CL, Gilkeson GS, Holers VM. Lack of a functional alternative complement pathway ameliorates ischemic acute renal failure in mice. J Immunol. 2003; 170:1517-1523.
177. Nangaku M, Couser WG. Mechanisms of immune-deposit formation and the mediation of immune renal injury. Clin Exp Nephrol. 2005; 9:183-191.
178. Berger SP, Daha MR. Complement in glomerular injury. Semin Immunopathol. 2007; 29:375-384.
179. Markiewski MM, Lambris JD. The role of complement in inflammatory diseases from behind the scenes into the spotlight. Am J Pathol. 2007; 171:715-727.
180. Curci C, Castellano G, Stasi A, Divella C, Loverre A, Gigante M, Simone S, Cariello M, Montinaro V, Lucarelli G, Ditonno P, Battaglia M, Crovace A, et al. Endothelial-to-mesenchymal transition and renal fibrosis in ischaemia/reperfusion injury are mediated by complement anaphylatoxins and Akt pathway. Nephrol Dial Transplant. 2014; 29:799-808.
181. Schwartz V, Lue H, Kraemer S, Korbiel J, Krohn R, Ohl K, Bucala R, Weber C, Bernhagen J. A functional heteromeric MIF receptor formed by CD74 and CXCR4. FEBS Lett. 2009; 583:2749-2757.
182. Shi X, Leng L, Wang T, Wang W, Du X, Li J, McDonald C, Chen Z, Murphy JW, Lolis E, Noble P, Knudson W, Bucala R. CD44 is the signaling component of the macrophage migration inhibitory factor-CD74 receptor complex. Immunity. 2006; 25:595-606.
183. Starlets D, Gore Y, Binsky I, Haran M, Harpaz N, Shvidel L, Becker-Herman S, Berrebi A, Shachar I. Cell-surface CD74 initiates a signaling cascade leading to cell proliferation and survival. Blood. 2006; 107:4807-4816.
184. Fan H, Hall P, Santos LL, Gregory JL, Fingerle-Rowson G, Bucala R, Morand EF, Hickey MJ. Macrophage migration inhibitory factor and CD74 regulate macrophage chemotactic responses via MAPK and Rho GTPase. J Immunol. 2011; 186:4915-4924.
185. Lue H, Dewor M, Leng L, Bucala R, Bernhagen J. Activation of the JNK signalling pathway by macrophage migration inhibitory factor (MIF) and dependence on CXCR4 and CD74. Cell Signal. 2011; 23:135-144.
186. Sanchez-Nino MD, Sanz AB, Ihalmo P, Lassila M, Holthofer H, Mezzano S, Aros C, Groop PH, Saleem MA, Mathieson PW, Langham R, Kretzler M, Nair V, et al. The MIF receptor CD74 in diabetic podocyte injury. J Am Soc Nephrol. 2009; 20:353-362.
187. Sanchez-Nino MD, Sanz AB, Ruiz-Andres O, Poveda J, Izquierdo MC, Selgas R, Egido J, Ortiz A. MIF, CD74 and other partners in kidney disease: tales of a promiscuous couple. Cytokine Growth Factor Rev. 2013; 24:23-40.
188. Klasen C, Ohl K, Sternkopf M, Shachar I, Schmitz C, Heussen N, Hobeika E, Levit-Zerdoun E, Tenbrock K, Reth M, Bernhagen J, El Bounkari O. MIF promotes B cell chemotaxis through the receptors CXCR4 and CD74 and ZAP-70 signaling. J Immunol. 2014; 192:5273-5284.
189. Zhan L, Huang C, Meng XM, Song Y, Wu XQ, Miu CG, Zhan XS, Li J. Promising roles of mammalian E2Fs in hepatocellular carcinoma. Cell Signal. 2014; 26:1075-1081.
190. Qiu LQ, Sinniah R, Hsu SI. Role of differential and cell type-specific expression of cell cycle regulatory proteins in mediating progressive glomerular injury in human IgA nephropathy. Lab Invest. 2004; 84:1112-1125.
191. Sheahan S, Bellamy CO, Dunbar DR, Harrison DJ, Prost S. Deficiency of G1 regulators P53, P21Cip1 and/or pRb decreases hepatocyte sensitivity to TGFbeta cell cycle arrest. BMC Cancer. 2007; 7:215.
192. Yu F, Megyesi J, Safirstein RL, Price PM. Involvement of the CDK2-E2F1 pathway in cisplatin cytotoxicity in vitro and in vivo. Am J Physiol Renal Physiol. 2007; 293:F52-9.
193. Ma X, Gao Y, Fan Y, Ni D, Zhang Y, Chen W, Zhang P, Song E, Huang Q, Ai Q, Li H, Wang B, Zheng T, et al. Overexpression of E2F1 promotes tumor malignancy and correlates with TNM stages in clear cell renal cell carcinoma. PLoS One. 2013; 8:e73436.
194. Valle BL, D'Souza T, Becker KG, Wood WH 3rd, Zhang Y, Wersto RP, Morin PJ. Non-steroidal anti-inflammatory drugs decrease E2F1 expression and inhibit cell growth in ovarian cancer cells. PLoS One. 2013; 8:e61836.
195. Yang IV, Alper S, Lackford B, Rutledge H, Warg LA, Burch LH, Schwartz DA. Novel regulators of the systemic response to lipopolysaccharide. Am J Respir Cell Mol Biol. 2011; 45:393-402.
196. Warg LA, Oakes JL, Burton R, Neidermyer AJ, Rutledge HR, Groshong S, Schwartz DA, Yang IV. The role of the E2F1 transcription factor in the innate immune response to systemic LPS. Am J Physiol Lung Cell Mol Physiol. 2012; 303:L391-400.
197. Colome N, Collado J, Bech-Serra JJ, Liiv I, Anton LC, Peterson P, Canals F, Jaraquemada D, Alvarez I. Increased apoptosis after autoimmune regulator expression in epithelial cells revealed by a combined quantitative proteomics approach. J Proteome Res. 2010; 9:2600-2609.
198. Ferguson BJ, Alexander C, Rossi SW, Liiv I, Rebane A, Worth CL, Wong J, Laan M, Peterson P, Jenkinson EJ, Anderson G, Scott HS, Cooke A, et al. AIRE's CARD revealed, a new structure for central tolerance provokes transcriptional plasticity. J Biol Chem. 2008; 283:1723-1731.
199. Fridman JS, Lowe SW. Control of apoptosis by p53. Oncogene. 2003; 22:9030-9040.
200. Beckerman R, Prives C. Transcriptional regulation by p53. Cold Spring Harb Perspect Biol. 2010; 2:a000935.
201. Speidel D, Helmbold H, Deppert W. Dissection of transcriptional and non-transcriptional p53 activities in the response to genotoxic stress. Oncogene. 2006; 25:940-953.
202. Maroulakou IG, Bowe DB. Expression and function of Ets transcription factors in mammalian development: a regulatory network. Oncogene. 2000; 19:6432-6442.
203. Lelievre E, Lionneton F, Soncin F, Vandenbunder B. The Ets family contains transcriptional activators and repressors involved in angiogenesis. Int J Biochem. Cell Biol. 2001; 33:391-407.
204. Ito Y, Miyoshi E, Takeda T, Sakon M, Noda K, Tsujimoto M, Monden M, Taniguchi N, Matsuura N. Expression and possible role of ets-1 in hepatocellular carcinoma. Am J Clin Pathol. 2000; 114:719-725.
205. Verschoor ML, Verschoor CP, Singh G. Ets-1 global gene expression profile reveals associations with metabolism and oxidative stress in ovarian and breast cancers. Cancer Metab. 2013; 1:17.
206. Feng W, Chumley P, Hua P, Rezonzew G, Jaimes D, Duckworth MW, Xing D, Jaimes EA. Role of the transcription factor erythroblastosis virus E26 oncogen homolog-1 (ETS-1) as mediator of the renal proinflammatory and profibrotic effects of angiotensin II. Hypertension. 2012; 60:1226-1233.
207. Xu D, Wilson TJ, Chan D, De Luca E, Zhou J, Hertzog PJ, Kola I. Ets1 is required for p53 transcriptional activity in UV-induced apoptosis in embryonic stem cells. EMBO J. 2002; 21:4081-4093.
208. Atkins GB, Jain MK. Role of Kruppel-like transcription factors in endothelial biology. Circ Res. 2007; 100:1686-1695.
209. Brey CW, Nelder MP, Hailemariam T, Gaugler R, Hashmi S. Kruppel-like family of transcription factors: an emerging new frontier in fat biology. Int J Biol Sci. 2009; 5:622-636.
210. Wu Z, Wang S. Role of kruppel-like transcription factors in adipogenesis. Dev Biol. 2013; 373:235-243.
211. Alder JK, Georgantas RW 3rd, Hildreth RL, Kaplan IM, Morisot S, Yu X, McDevitt M, Civin CI. Kruppel-like factor 4 is essential for inflammatory monocyte differentiation in vivo. J Immunol. 2008; 180:5645-5652.
212. Feinberg MW, Cao Z, Wara AK, Lebedeva MA, Senbanerjee S, Jain MK. Kruppel-like factor 4 is a mediator of proinflammatory signaling in macrophages. J Biol Chem. 2005; 280:38247-38258.
213. Miele L, Beale G, Patman G, Nobili V, Leathart J, Grieco A, Abate M, Friedman SL, Narla G, Bugianesi E, Day CP, Reeves HL. The Kruppel-like factor 6 genotype is associated with fibrosis in nonalcoholic fatty liver disease. Gastroenterology. 2008; 135:282-291.e1.
214. Chen JL, Lu XJ, Zou KL, Ye K. Kruppel-like factor 2 promotes liver steatosis through upregulation of CD36. J Lipid Res. 2014; 55:32-40.
215. Jung DY, Chalasani U, Pan N, Friedline RH, Prosdocimo DA, Nam M, Azuma Y, Maganti R, Yu K, Velagapudi A, O'Sullivan-Murphy B, Sartoretto JL, Jain MK, et al. KLF15 is a molecular link between endoplasmic reticulum stress and insulin resistance. PLoS One. 2013; 8:e77851.
216. Di Carlo A, De Mori R, Martelli F, Pompilio G, Capogrossi MC, Germani A. Hypoxia inhibits myogenic differentiation through accelerated MyoD degradation. J Biol Chem. 2004; 279:16332-16338.
217. Ishido M, Kami K, Masuhara M. In vivo expression patterns of MyoD, p21, and Rb proteins in myonuclei and satellite cells of denervated rat skeletal muscle. Am J Physiol Cell Physiol. 2004; 287:C484-93.
218. Wen AY, Sakamoto KM, Miller LS. The role of the transcription factor CREB in immune function. J Immunol. 2010; 185:6413-6419.
219. Mayr B, Montminy M. Transcriptional regulation by the phosphorylation-dependent factor CREB. Nat Rev Mol. Cell Biol. 2001; 2:599-609.
220. Nei Y, Obata-Ninomiya K, Tsutsui H, Ishiwata K, Miyasaka M, Matsumoto K, Nakae S, Kanuka H, Inase N, Karasuyama H. GATA-1 regulates the generation and function of basophils. Proc Natl Acad Sci U S A. 2013; 110:18620-18625.
221. McKimmie CS, Fraser AR, Hansell C, Gutierrez L, Philipsen S, Connell L, Rot A, Kurowska-Stolarska M, Carreno P, Pruenster M, Chu CC, Lombardi G, Halsey C, et al. Hemopoietic cell expression of the chemokine decoy receptor D6 is dynamic and regulated by GATA1. J Immunol. 2008; 181:3353-3363.
222. Londhe KB, Borlak J. A cross-platform comparison of genome-wide expression changes of laser microdissected lung tissue of C-Raf transgenic mice using 3'IVT and exon array. PLoS One. 2012; 7:e40778.
223. Reimand J, Arak T, Vilo J. g:Profiler--a web server for functional interpretation of gene lists (2011 update). Nucleic Acids Res. 2011; 39:W307-15.
224. Bindea G, Mlecnik B, Hackl H, Charoentong P, Tosolini M, Kirilovsky A, Fridman WH, Pages F, Trajanoski Z, Galon J. ClueGO: a Cytoscape plug-in to decipher functionally grouped gene ontology and pathway annotation networks. Bioinformatics. 2009; 25:1091-1093.
225. Szklarczyk D, Franceschini A, Wyder S, Forslund K, Heller D, Huerta-Cepas J, Simonovic M, Roth A, Santos A, Tsafou KP, Kuhn M, Bork P, Jensen LJ, et al. STRING v10: protein-protein interaction networks, integrated over the tree of life. Nucleic Acids Res. 2015; 43:D447-52.
226. Rzhetsky A, Iossifov I, Koike T, Krauthammer M, Kra P, Morris M, Yu H, Duboue PA, Weng W, Wilbur WJ, Hatzivassiloglou V, Friedman C. GeneWays: a system for extracting, analyzing, visualizing, and integrating molecular pathway data. J Biomed Inform. 2004; 37:43-53.
227. Cartharius K, Frech K, Grote K, Klocke B, Haltmeier M, Klingenhoff A, Frisch M, Bayerlein M, Werner T. MatInspector and beyond: promoter analysis based on transcription factor binding sites. Bioinformatics. 2005; 21:2933-2942.
228. Sahini N, Borlak J. Recent insights into the molecular pathophysiology of lipid droplet formation in hepatocytes. Prog Lipid Res. 2014; 54:86-112.
229. Sahini N, Selvaraj S, Borlak J. Whole genome transcript profiling of drug induced steatosis in rats reveals a gene signature predictive of outcome. PLoS One. 2014; 9:e114085.