
INTRODUCTION
The conventional treatment strategies attempting to eradicate tumor cells as radical as possible, are frequently inefficient, because of the evasion from drugs, where the drug-sensitive tumor cells are eliminated, but the pre-existing insensitive sub-clones are selected and are able to survive [1, 2]; and drug resistance development represents an evolution of cancer cells, through mutations or reprogramming metabolic patterns due to the unstable genomes [3, 4]. As a consequence of drug evasion or resistance development, cancer therapy fails and leads to relapse [5]. In addition, the application of personalized medicine is limited by the lack of defined driver mutations, except in those patients carrying the genetic sequences that match the targeted drugs [5, 6]. For example, only 30% of mammary adenoid cystic carcinoma can be attributed to MYB/NFIB fusion, while the driver mutations in other cases remain unclear [7]. Therefore, the drug evasion, resistance development and the lack of defined therapeutic targets limit the development of efficient cancer therapies.
To some extent, tumors can be considered ecological systems in which Darwinian evolution applies [2, 5], and therefore, the modification of the tumor microenvironment may be an alternative approach to the inhibition of tumor progression [8], in order to prolong the survival periods. In tumor microenvironment, paracrine or autocrine molecules participate in maintaining favorable conditions for the propagation of tumor cells, such as the extracellular matrix (ECM) component extra domain A positive fibronectin (EDA+FN), as well as the vascular endothelial growth factor A isoforms (VEGF-Axxx), the pro-oncogenic isoforms generated by the alternative splicing of FN or VEGF genes [9, 10], respectively. These alternative spliced isoforms are always absent in normal adult tissues, but exclusively expressed in tumor, wound healing and inflammation. On this basis, most types of tumor cells could attenuate the physical barriers formed by the ECM [11, 12], or vascularize the tumor tissue in advance [10]. By targeting those paracrine or autocrine molecules spreading over the tumor microenvironment, it may not be necessary to eradicate all tumor cells, but modify a part of them, primarily the sub-populations supporting the propagation of the whole community [13]. The tumor recurrence can perhaps be avoided as well, because of the lack of survival pressure which facilitates the drug evasion or resistance development [14].
Using the type II bacterial clustered, regularly interspaced, palindromic repeats (CRISPR)-associated (Cas) system, the sub-population supporting the progression of tumors via their paracrine or autocrine molecules could be altered at the level of genome [15]. Although the limited efficiency of gene editing in vivo made it difficult to acquired therapeutic effects by targeting some oncogenes [16, 17], targeting paracrine or autocrine molecules using CRISPR/Cas system may be a strategy for amplifying the inhibition of tumor propagation, considering the diffusion of these molecules, and hence it is unnecessary to access each tumor cells. In this study, we confirmed the pro-oncogenic effects of EDA+FN, and the EDA exon-eliminating CRISPR/Cas9 plasmids were used both in vitro and in vivo to inhibit various tumor progression, based on our previous study [15].
RESULTS
In vitro EDA exon knockout with CRISPR/Cas system
Compared to the untreated CNE-2Z or SW480 cells respectively, the levels of EDA+FN protein were shown to be significantly decreased in each cell line, after tansfecting with CRISPR/Cas plasmids targeting EDA exon; and in accordance with a previous study [15], the amount of total FN remained almost unchanged (Figure 1A). FN gene was amplified in EDA knockout CNE-2Z or SW480 cells respectively, a relatively weak band of PCR product was 427 base pairs (bp) long, representing a minority of gene copies was edited; and a band represents EDA positive FN gene at the length of 675 bp, as same as those isolated from untreated CNE-2Z or SW480 cells (Figure 1B). DNA sequencing confirmed that the 427 bp product lacks EDA exon, and the double strain breaks (DSBs) were repaired by non-homologous end-joining (NHEJ), by inserting 19 bp (Figure 1C).
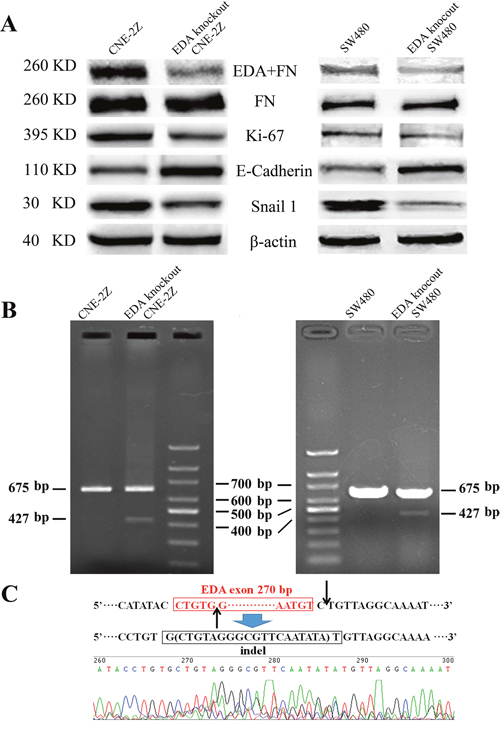
Figure 1: (A) Western blot analysis of EDA+FN and the total FN levels, as well as Ki-67, E-cadherin, and Snail 1 levels in the untreated and EDA knockout cells, the CNE-2Z and SW480 were presented respectively. (B) The PCR products of the genome isolated from EDA knockout and untreated cells, including CNE-2Z and SW480. (C) DNA sequencing of the PCR product at the length of 427 base pairs (bp), demonstrating EDA exon is removed in part of EDA knockout cells.
The exclusion of EDA exon inhibited cell proliferation and motility
Contrary to the EDA over-expressing cells, which illustrated the pro-oncogenic effect (Supplementary Figures 1 to 3); EDA exclusion led to a decreased cell proliferation. As demonstrated by colony forming assay, EDA knockout were shown to generate a significantly lower number of colony formation units (CFUs) (80.30±7.50/400 cells in CNE-2Z & 35.67±4.04/400 cells in SW480), in comparison with that of the untreated CNE-2Z (130.00±6.00/400 cells, P=0.010) or SW480 cells (79.00±5.57/400 cells, P<0.001) (Figure 2A&2B). EDA knockout also led to prolonged population doubling time (PDT) (69.00±11.24 h in CNE-2Z & 27.80±0.58 h in SW480), in comparison with that of the untreated CNE-2Z (46.71±8.24 h, P=0.05) or SW480 cells (24.24±0.31 h, P=0.002) respectively (Figure 2C&2D), while the levels of Ki-67 decreased as well in each EDA knockout cell line (Figure 1A).
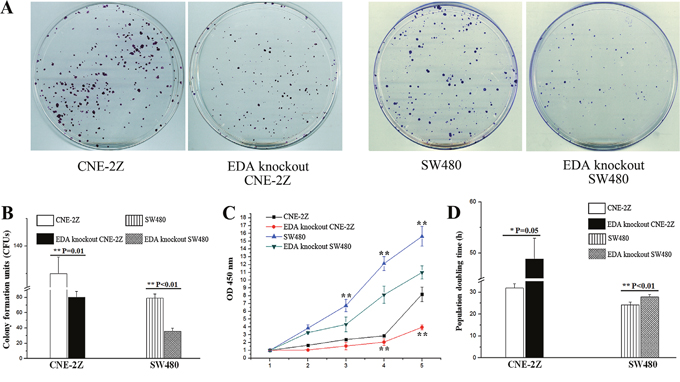
Figure 2: (A) CFUs developed from the untreated CNE-2Z or SW480 cells, in contrast with the EDA knockout CNE-2Z or SW480 cells respectively. (B) CFU numbers in untreated CNE-2Z or SW480, compared to the EDA knockout CNE-2Z or SW480 respectively. (C) Proliferation rates of untreated and EDA knockout CNE-2Z or SW480 cells. (D) PDT, measured using untreated and EDA knockout CNE-2Z (*P=0.05), as well as untreated and EDA knockout SW480 cells.
In the wound healing assay, the speed of EDA knockout cells was shown to be 9.15±0.84 μm/h in CNE-2Z and 8.76±0.66 μm/h in SW480 cells, which was significantly lower than untreated controls (CNE-2Z: 17.84±2.4μm/h, P=0.005 & SW480: 13.91±0.86μm/h, P=0.001) (Figure 3A&3C). Similarly, the invasion rate of EDA knockout CNE-2Z (45.67±14.01 cells per field) and SW480 cells (45.00±10.44 cells per field) were significantly decreased, in comparison with that of untreated controls respectively (CNE-2Z: 135.00±11.79 cells per field, P=0.001 & SW480: 68.67±5.51 cells per field, P=0.003) (Figure 3B&3D).
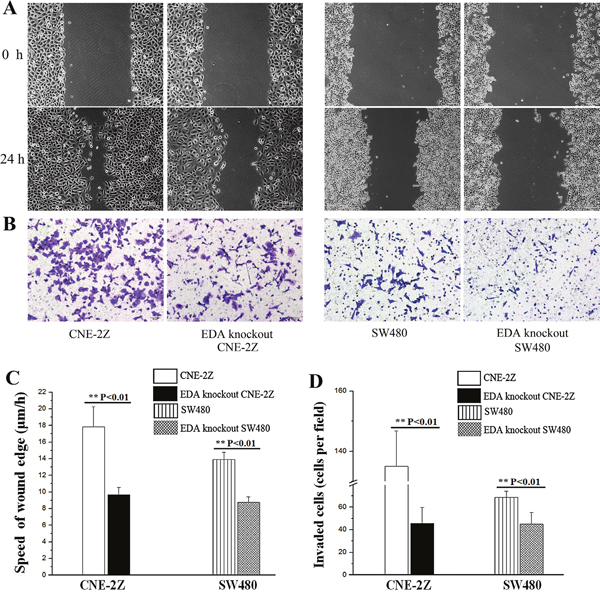
Figure 3: (A) Wound healing assay, showing the migratory abilities of untreated and EDA knockout cells. (original magnification, 100×; scale bar: 100 μm). (B) Transwell invasion assay results, showing the invasive rate of untreated and EDA knockout cells (original magnification, 200×; scale bar: 50 μm). (C) The speed of wound edge in the untreated and EDA knockout cells, including CNE-2Z and SW480. (D) The invasive rate of EDA knockout cells, compared with untreated CNE-2Z or SW480 cells, respectively.
EDA knockout suppressed the epithelia-mesenchymal transition (EMT)
In CNE-2Z cells, EDA knockout led to the enhancement of E-cadherin and decrement of Snail 1 at both mRNA and protein levels, as well as the decreased N-cadherin, Vimentin, α-SMA, and Slug at mRNA level; consistently, the down-regulated mRNA and protein levels of Snail 1, and the decreased mRNA levels of N-cadherin, α-SMA and Slug, appeared in the EDA knockout SW480 cells as well. The mRNA levels of VEGF decline in both EDA knockout cell lines (Figure 1A & 4A) (Table 1).
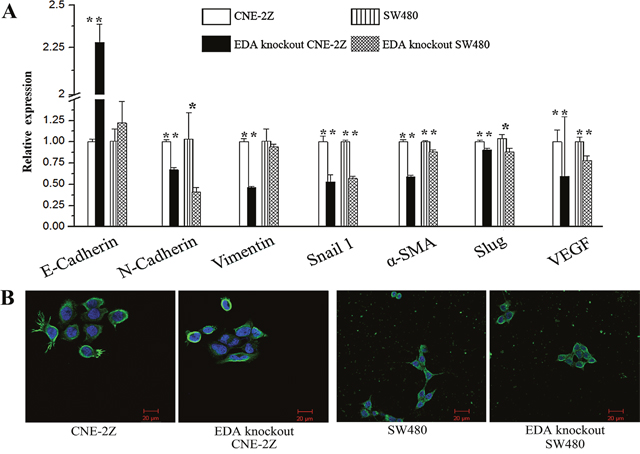
Figure 4: (A) Expression of epithelia-mesenchymal transtion (EMT)-related and VEGF genes in untreated and EDA knockout cells. (B) The Morphology and F-actin staining of CNE-2Z or SW480 cells, to illustrate the effects of EDA knockout on EMT (original magnification, 400×; scale bar: 20μm).
Table 1: The normalized expression of genes in untreated and EDA knockout cells
Genes |
untreated CNE-2Z |
EDA knockout CNE-2Z |
P |
E-cadherin |
1.0000±0.0318 |
2.2800±0.1070 |
**<0.001 |
N-cadherin |
1.0000±0.0222 |
0.6700±0.0256 |
**<0.001 |
Vimentin |
1.0000±0.0383 |
0.4645±0.0080 |
**<0.001 |
Snail1 |
1.0000±0.0651 |
0.5299±0.0828 |
**0.001 |
α-SMA |
1.0000±0.0249 |
0.5900±0.0184 |
**<0.001 |
Slug |
1.0000±0.0163 |
0.9044±0.0175 |
**0.002 |
VEGF |
1.0000±0.0139 |
0.5935±0.0700 |
**0.001 |
untreated SW480 |
EDA knockout SW480 |
P |
|
E-cadherin |
1.0065±0.1432 |
1.2209±0.2554 |
0.274 |
N-cadherin |
1.0332±0.3119 |
0.4109±0.0501 |
*0.027 |
Vimentin |
1.0066±0.1445 |
0.9387±0.0321 |
0.471 |
Snail1 |
1.0000±0.0206 |
0.5681±0.0233 |
**<0.001 |
α-SMA |
1.0000±0.0147 |
0.8808±0.0264 |
**0.002 |
Slug |
1.0369±0.0477 |
0.8835±0.0415 |
*0.014 |
VEGF |
1.0010±0.0550 |
0.7804±0.0503 |
**0.007 |
*P < 0.05; **P < 0.01.
Although the untreated CNE-2Z cells also displayed polygonal morphology, the EDA knockout CNE-2Z exhibited relatively weak and diffused F-actin staining, less membrane ruffling and lamellipodia. While the untreated SW480 tend to exhibit spindle morphology and more lamellipodia, in contrast with the polygonal morphology of EDA knockout SW480 (Figure 4B).
In vivo EDA knockout using CRISPR/Cas9 system
After the establishment of the xenograft tumor models with CNE-2Z or SW480 cells, the CRISPR/Cas9 plasmids containing the sgRNA targeting EDA exon were injected into the tumors, while those samples injected with PBS or Cas9 plasmid without sgRNA were used as controls. PCR amplification was performed using total DNA isolated from tumor samples. In the xenograft tumors of CNE-2Z, EDA exon was shown to be removed at least partly in vivo (the 1st~6th lane) (Figure 5A), and DNA sequencing confirmed that the DSBs were repaired by NHEJ. The gene sequences in most samples (the 1st~5th lane) were identical to EDA negative FN gene identified in vitro (Figure 1B), however, in one sample (the 6th lane), DSBs were repaired at different sites, and only one base pair (bp) was inserted between the DNA breaks (Figure 5B), leading to a shorter PCR product in the 6th lane (380bp). A relatively small number of cells appeared affected by gene editing, according to the width and light intensity of PCR bands, however, the protein levels of EDA+FN considerably decreased in the EDA knockout CNE-2Z tumors (Figure 5C).
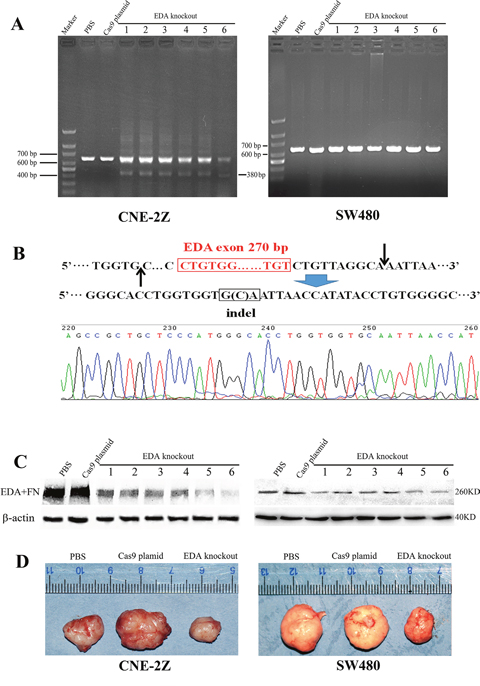
Figure 5: (A) The PCR products of the genome isolated from all EDA knockout samples, as well as the controls (PBS and Cas9 plasmid groups), CNE-2Z and SW480 xenografts were compared respectively. (B) The shorter PCR products (380 bp) representing another EDA knockout sequence in the 6th lane from the CNE-2Z xenografts were sequenced. (C) The protein level of EDA+FN in EDA knockout xenograft tumors and in the control groups, CNE-2Z and SW480 xenografts were compared respectively. (D) The size of the CNE-2Z or SW480 tumors between EDA knockout, PBS, and Cas9 groups.
In the xenograft tumors of SW480, the PCR bands of EDA knockout gene seemed absent, suggesting a very low efficiency of gene editing in vivo, which perhaps overwhelmed by the overexposed EDA+FN bands (Figure 5A). But the obviously decreased protein of EDA+FN indicated the EDA exclusion still functioned (Figure 5C), suggesting the amplified effects from the gene editing to protein expression.
EDA exclusion inhibits tumor progression in vivo
At the final time point, the weight of CNE-2Z tumors were lower in the EDA knockout group (0.347±0.194 g), in comparison with that in the PBS (0.675±0.195 g; P=0.008) or Cas9 plasmid groups (0.867±0.208 g; P<0.001). Similarly, the weight of EDA knockout SW480 tumors were also less than their PBS (1.047±0.915 g; P<0.001) or Cas9 plasmid groups (0.572±0.117 g; P<0.001) (Figure 5D&6A). Actually, in comparison with control groups, the growth of CNE-2Z tumor was shown to be significantly inhibited from the 7th day following the EDA knockout (Figure 6B1 and Table 2); and the growth of SW480 tumor was inhibited from the 5th day until the termination (Figure 6B2 and Table 2). However, there was little difference in the animal weight between the EDA knockout and the control groups, either in the animals carrying CNE-2Z or SW480 xenograft tumors (Figure 6C1&6C2) (Table 3).
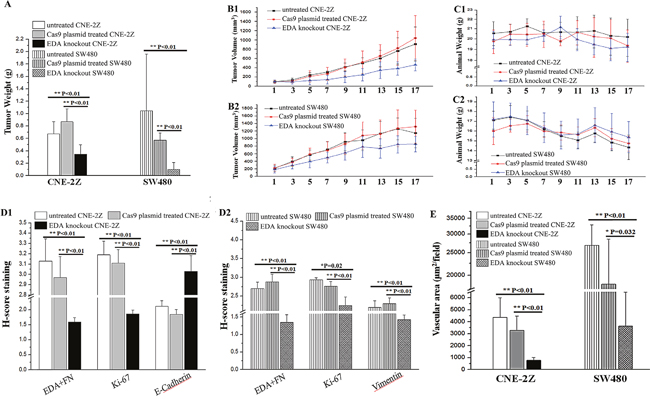
Figure 6: (A) The final weight in the EDA knockout CNE-2Z tumor (respectively compared with PBS or Cas9 plasmid groups), as well as the weight of EDA knockout SW480 tumor (compared with PBS or Cas9 plasmid groups respectively). (B) The growth rate of xenograft tumors in EDA knockout, PBS, and Cas9 plasmid groups, the CNE-2Z (B1) and SW480 (B2) tumor were presented respectively. (C) The changes of the animal weight in EDA knockout, PBS, and Cas9 plasmid groups, the animals carrying CNE-2Z (C1) and SW480 (C2) tumors were respectively exhibited. (D) The H-score of the immunohistochemical (IHC) staining of EDA+FN, Ki-67 and E-cadherin in CNE-2Z tumors (D1); and that of EDA+FN, Ki-67, and Vimentin in SW480 tumors (D2). (E) The vascular areas in EDA knockout group and PBS or Cas9 groups, accessed by CD34 staining of the endothelial cells, the samples of CNE-2Z and SW480 tumor were compared respectively.
Table 2: The tumors volume along with the day after treatment
Days after |
Tumor Volume of CNE-2Z xenograft (mm3) |
P |
||||
1(PBS) |
2(Cas9 plasmid) |
3(EDA knockout) |
1/2 |
1/3 |
2/3 |
|
1 |
99.1350±22.1796 |
96.7567±31.8253 |
98.4850±39.0632 |
0.899 |
0.278 |
0.335 |
3 |
136.2017±37.8534 |
109.8100±34.7430 |
92.5933±44.7186 |
0.263 |
0.074 |
0.461 |
5 |
241.3767±47.47940 |
211.2333±127.1313 |
124.9750±88.0416 |
0.584 |
*0.047 |
0.131 |
7 |
303.9100±28.8846 |
268.6417±137.4934 |
142.1567±94.9973 |
0.542 |
*0.012 |
*0.041 |
9 |
415.3583±84.7677 |
405.5050±186.1797 |
198.2550±119.2779 |
0.902 |
*0.015 |
*0.019 |
11 |
499.1333±118.9764 |
517.3650±242.6938 |
248.1817±132.5145 |
0.858 |
*0.024 |
*0.017 |
13 |
601.5350±175.3146 |
651.5217±248.1406 |
345.6333±180.6527 |
0.677 |
*0.046 |
*0.02 |
15 |
763.7717±285.0559 |
821.3167±367.0476 |
383.2050±143.5666 |
0.728 |
*0.033 |
*0.016 |
17 |
912.0017±368.0845 |
1040.9917±486.9214 |
461.7217±126.7161 |
0.544 |
*0.047 |
*0.014 |
Days after |
Tumor Volume of SW480 xenograft (mm3) |
P |
||||
1(PBS) |
2(Cas9 plasmid) |
3(EDA knockout) |
1/2 |
1/3 |
2/3 |
|
1 |
215.7511±83.776 |
225.555±97.4038 |
181.3938±88.3222 |
0.826 |
0.442 |
0.319 |
3 |
397.9±120.8684 |
372.208±106.9834 |
292.265±92.2442 |
0.609 |
0.055 |
0.131 |
5 |
569.1644±129.8603 |
587.572±163.0796 |
392.07±164.959 |
0.786 |
*0.0200 |
**0.0090 |
7 |
711.7867±206.4703 |
688.213±234.3666 |
497.785±139.0018 |
0.801 |
*0.0380 |
0.057 |
9 |
919.1556±236.4647 |
861.386±282.7709 |
621.3775±194.6118 |
0.611 |
*0.0190 |
*0.0490 |
11 |
958.7944±272.8455 |
1081.733±361.7609 |
782.8625±280.5097 |
0.398 |
0.137 |
*0.0240 |
13 |
1134.6489±321.6374 |
1122.583±372.289 |
740.2638±256.7685 |
0.936 |
*0.0200 |
*0.0210 |
15 |
1258.9156±288.6477 |
1274.397±486.1922 |
848.2925±229.6154 |
0.927 |
*0.0290 |
*0.0210 |
17 |
1149.4178±391.0696 |
1318.356±438.2028 |
855.6438±207.8501 |
0.446 |
**0.0030 |
*0.0140 |
*P < 0.05; **P < 0.01.
Table 3: The animals weight along with the day after treatment
Days after |
The Weight of animal carrying CNE-2Z xenograft (g) |
P |
||||
1(PBS) |
2(Cas9 plasmid) |
3(EDA knockout) |
1/2 |
1/3 |
2/3 |
|
1 |
20.5533±1.1915 |
19.7567±1.1362 |
19.925±0.8367 |
0.215 |
0.324 |
0.788 |
3 |
20.7083±0.7368 |
20.4633±1.0307 |
19.9383±0.5640 |
0.604 |
0.117 |
0.274 |
5 |
21.2700±0.7944 |
20.4300±1.1464 |
19.9133±0.43757 |
0.105 |
*0.014 |
0.306 |
7 |
20.5967±0.8355 |
20.4950±1.3178 |
20.3200±0.5557 |
0.856 |
0.624 |
0.756 |
9 |
20.6783±0.9959 |
19.7883±0.4465 |
21.1633±1.1629 |
0.376 |
*0.021 |
0.115 |
11 |
220.6550±1.6244 |
20.6400±1.2208 |
19.9467±1.0648 |
0.985 |
0.369 |
0.379 |
13 |
20.8017±1.6524 |
20.2350±1.9418 |
19.4683±0.9464 |
0.541 |
0.162 |
0.411 |
15 |
20.3083±1.8281 |
20.0583±1.9131 |
19.0950±1.1031 |
0.797 |
0.224 |
0.329 |
17 |
20.1883±1.8207 |
19.3600±1.5266 |
19.2330±1.3171 |
0.375 |
0.308 |
0.891 |
Days after |
The Weight of animal carrying SW480 xenograft (g) |
P |
||||
1(PBS) |
2(Cas9 plasmid) |
3(EDA knockout) |
1/2 |
1/3 |
2/3 |
|
1 |
17.1225±0.9145 |
16.013±1.3812 |
17.206±1.7903 |
0.117 |
0.904 |
0.076 |
3 |
17.428±1.1977 |
16.549±0.6462 |
17.486±1.3776 |
0.131 |
0.754 |
0.072 |
5 |
17.096±0.9621 |
16.756±0.8324 |
17.111±1.4783 |
0.505 |
0.976 |
0.487 |
7 |
16.193±0.7697 |
15.99±0.609 |
16.349±1.5125 |
0.666 |
0.74 |
0.447 |
9 |
15.5±1.0388 |
15.862±0.7697 |
15.596±1.4174 |
0.471 |
0.848 |
0.596 |
11 |
15.066±0.8319 |
15.641±0.7866 |
15.7133±1.5356 |
0.247 |
0.206 |
0.886 |
13 |
15.769±0.9022 |
16.35±0.926 |
16.5978±1.796 |
0.31 |
0.162 |
0.671 |
15 |
14.843±0.8335 |
15.224±1.0347 |
15.93±1.8866 |
0.52 |
0.082 |
0.251 |
17 |
14.35±1.2629 |
14.746±0.7994 |
15.3833±1.5933 |
0.484 |
0.083 |
0.276 |
*P < 0.05; **P < 0.01.
The EDA+FN staining in the EDA knockout CNE-2Z tumor was significantly lower than that observed in the groups injected with PBS (P<0.001) or Cas9 plasmids without sgRNA (P<0.001). The Ki-67 staining was also lower than that in PBS (P<0.001) or Cas9 plasmid (P<0.001) groups; while the E-cadherin staining increased, in comparison with the PBS (P=0.001) or Cas9 plasmid groups (P<0.001) (Figure 6D1 & Figure 7). The vascular area in the EDA knockout xenografts was shown to be much smaller than that in PBS (P<0.001) or Cas9 plasmid groups (P<0.001), as demonstrated by CD34 staining of endothelial cells (Figure 6E) (Table 4).
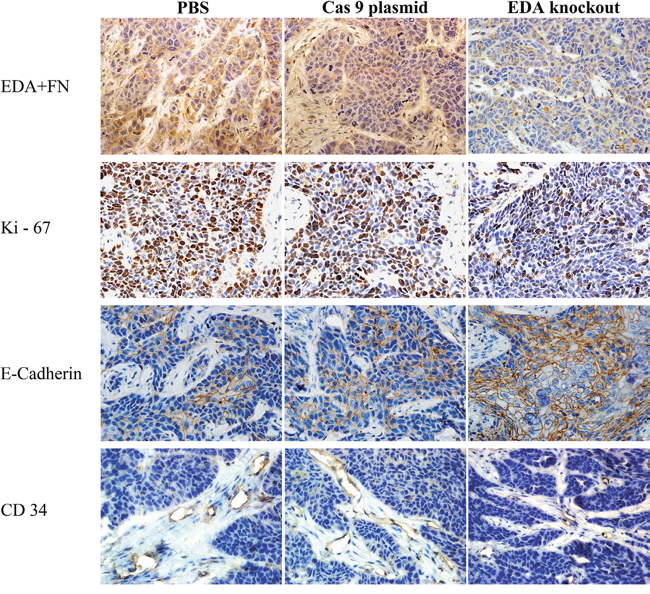
Figure 7: IHC EDA+FN, Ki-67, CD34, and E-cadherin staining of EDA knockout samples of CNE-2Z tumor, as well as the samples of PBS or Cas9 plasmid groups.
Table 4: The Immunohistochemical staining of CNE-2Z and SW480 xenografts
Immunohistochemistry |
CNE-2Z xenograft |
P |
||||
1(PBS) |
2(Cas9 plasmid) |
3(EDA knockout) |
1/2 |
1/3 |
2/3 |
|
EDA+FN (H-score) |
3.13±0.214 |
2.97±0.204 |
1.59±0.194 |
0.345 |
**<0.001 |
**<0.001 |
Ki-67 (H-score) |
3.11±0.131 |
3.19±0.132 |
1.86±0.127 |
0.4810 |
**<0.001 |
**<0.001 |
E-Cadherin (H-score) |
2.11±0.195 |
1.84±0.164 |
3.13±0.153 |
0.0960 |
**0.001 |
**<0.001 |
Vascular area (μm2) |
4378.15±1621.29 |
3275.72± 1201.42 |
781.26±250.02 |
0.2940 |
**<0.001 |
**<0.001 |
SW480 xenograft |
P |
|||||
1(PBS) |
2(Cas9 plasmid) |
3(EDA knockout) |
1/2 |
1/3 |
2/3 |
|
EDA+FN (H-score) |
2.70±0.173 |
2.88±0.202 |
1.35±0.218 |
0.301 |
**<0.001 |
**<0.001 |
Ki-67 (H-score) |
2.93±0.577 |
2.76±0.132 |
2.25±0.229 |
0.236 |
*0.02 |
**<0.001 |
E-Cadherin (H-score) |
2.20±0.173 |
2.30±0.150 |
1.43±0.126 |
0.448 |
**0.001 |
**<0.001 |
Vascular area (μm2) |
26895.35±5949.19 |
18356.45±10206.88 |
2831.91±3628.2 |
0.198 |
**<0.001 |
*0.032 |
*P < 0.05; **P < 0.01.
In the tumors of SW480, EDA+FN staining was also significantly decreased in the knockout xenografts, in comparison with PBS (P<0.001) or Cas9 plasmids (P<0.001) groups. The Ki-67 staining in the knockout group was also lower than that in PBS (P=0.02) or Cas9 plasmid groups (P=0.008). The suppressed EMT seemed reflected in the decreased Vimentin staining in the knockout tumors, in contrast with that in PBS (P<0.001) or Cas9 plasmids (P<0.001) groups (Figure 6D2 & Figure 8). The EDA knockout xenografts of SW480 developed less vascular area than that in PBS (P<0.001) or Cas9 plasmid groups (P=0.032) (Figure 6E) (Table 4).
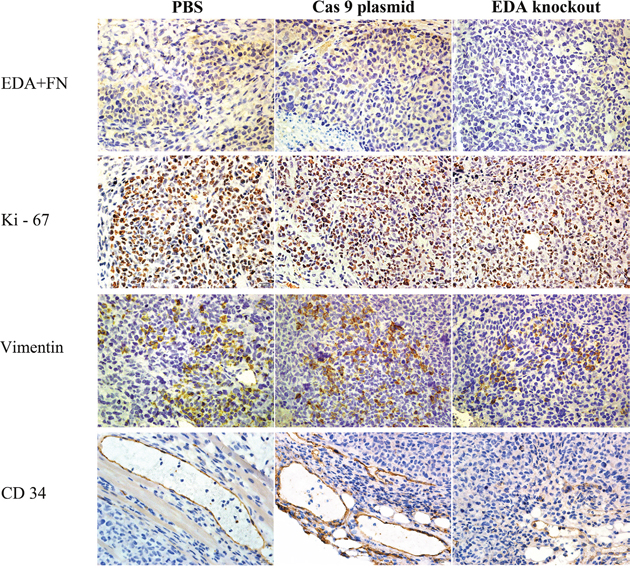
Figure 8: IHC EDA+FN, Ki-67, Vimentin and CD34 staining of EDA knockout sample of SW480 tumor, as well as the samples of PBS or Cas9 plasmid groups.
DISCUSSION
In this study, nasopharyngeal cell line CNE-2Z and colorectal carcinoma cell line SW480 were selected for their survival relying on EDA and easiness to form xenograft tumors [18, 19]. The promotion of cell motility of EDA had been demonstrated in salivary adenoid cystic carcinoma (SACC) previously [15], it suggested the necessity of ECM in the development of cancers [11, 20]. On this basis, we eliminated EDA exon in CNE-2Z and SW480 cell lines in vitro. According to the width and light intensity of PCR products, only minority of gene copies were edited, but EDA+FN protein levels considerably decreased in both cell lines. This may be explained by the ability of sgRNA-Cas9 complex to access the uncoiled DNA during gene replication or transcription, which is present in dividing cells or the actively transcribed genes [21, 22]. Therefore, in the subpopulation of cells that are actively proliferating or transcribing FN genes, the EDA exon tend to be knockout efficiently [13], allowing an amplified effects on the ECM components, thus leading to the decreased tumor cell propagation. In previous study, the highly aggressiveness but slow growth of SACC [23], made the cell motility relied on EDA significantly, but little effects of EDA on the cell proliferation [15]; however, in this study, EDA knockout inhibited both the motility and proliferation of CNE-2Z or SW480, consistent to the growth characteristics [18, 19]. Taken together, EDA knockout with CRISPR/Cas system provide a strategy for interrupting the interaction of tumor cells with their microenvironment, instead of eradicating cancer cells themselves.
The strategies for cancer treatment involving the complete eradication of tumor cells remain the mainstream in the field of cancer research. However, these approaches are limited by a series of problems, including the development of drug resistance or the immune evasion of tumor cells, as well as cancer recurrence and metastases [24–26]. Any attempts to eradicate all tumor cells may impose a survival pressure on tumor cells, which may force the tumor cells to disseminate and lead to the selection of drug insensitive subpopulation [1, 2, 26]. For these reasons, the remaining cancer cells can survive the initially effective treatment, and tumor may resume progression [5, 6]. A strategy based on the inhibition of tumor progression instead of eradicating cancer cells may be a feasible way to prolong patient survival, in a way similar to that of SACC patients, where the early development of metastases prevents successful tumor removal, but patient survival time is measured in years, due to the slow tumor growth [23]. Additionally, although an initial high dose of paclitaxel leads to the reduction in tumor volume in animal models, this is followed by a rapid cancer progression; however, the application of lower doses of paclitaxel led to a continuous inhibition of tumor growth, consequently prolonging survival periods [14]. The inhibition rather than eradication, may relieve the survival pressure and artificial selection, it may facilitate to maintain the intra-tumor heterogeneity, and hence the intercellular competition is likely to further inhibit tumor progression [13, 27].
Since the evolution of a ecosystem is affected by the environmental conditions, the modified ECM components may be an unfavorable factor on the tumor growth and progression (Figure 9) [8]. To confirm this hypothesis, CRISPR/Cas9 system was applied in vivo, knocking out EDA exon of the FN gene in the xenograft tumors. In accordance with the previous in vitro experiments, the relatively low efficiency of gene editing in vivo was accompanied by considerable decrease in EDA+FN protein levels, and significantly inhibited tumor growth of CNE-2Z or SW480 xenografts. While the observed changes in animal weight were similar in all investigated groups, indicating a low toxicity of the applied method. The declined cell proliferation most likely led to the initial inhibition of tumor growth, as demonstrated by a decrease in Ki-67 staining intensity in the EDA knockout group. Additionally, an increase in E-cadherin expression in the CNE-2Z tumor may limit the propagation of EDA knockout tumors; while the decreased Vimentin in the SW480 tumor suggested impaired cell propagation. Since EDA+FN has various paracrine and autocrine effects, the EDA-FN is likely to act as the physical limits of tumor cell migration rather than the pro-oncogenic roles [12], the gene editing affects not only the modified cells themselves, but also the entire tumor [8, 9]. The exclusion of EDA decreased VEGF expression, as investigated in vitro, which decreases angiogenesis or vascularization in vivo, may amplified the inhibition of tumor progression [28, 29].
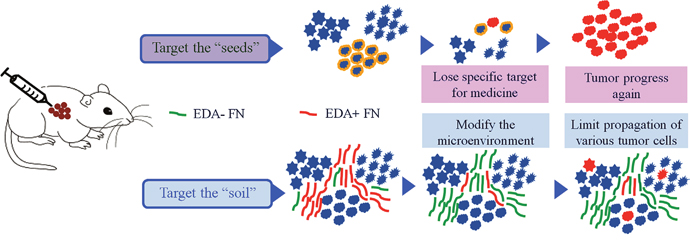
Figure 9: A schematic representation of treatment strategies. Using the strategy focusing on the eradication of tumor cells (the “seeds”), the therapeutic evasion appears inevitable. Alternatively, by targeting tumor microenvironment (the “soil”), tumor progression may be prevented without leading to the drug resistance development, as well as maintaining the heterogeneity within tumors.
The low efficiency of in vivo genome editing, even when using viral vector [21, 30], limits the application of CRISPR/Cas system [17], since the greater number of inaccessible cells may offset the effects of modifying onco-genes in some easily accessible cells [16, 31–33]. This issue may be avoided by targeting molecules that constitute tumor microenvironment, which would allow CRISPR/Cas system to access the paracrine or autocrine effects of subpopulation responsible for the whole tumor progression, just as the altered EDA+FN and VEGF in this study.
In various tumors, EDA exon knockout led to significantly inhibited tumor progression with little side effects in vivo. It suggested that, by modifying ECM components constituting tumor microenvironment, we may avoid the issue of the low efficiency of in vivo gene editing; and the general reliance of various tumor cells on some components of ECM made the specific therapeutic markers unnecessary [5, 6]; furthermore, the inhibition instead of eradication imposes little survival pressure on the tumor cells and facilitate a continuously inhibitive effects [14].
MATERIALS AND METHODS
Cell culture
Poorly differentiated human nasopharyngeal carcinoma cell line CNE-2Z was purchased from China Infrastructure of Cell Line Resource (Beijing, China), and it was grown in RPMI 1640 medium (Gibco, Grand Island, NY, USA). The colorectal carcinoma cell line SW480 was preserved in Peking University School of Stomatology, it was grown in Dulbecco’s Modified Eagle’s Medium (DMEM) (Gibco, Grand Island, NY, USA). All the cells were cultured in medium containing 10% fetal bovine serum (FBS, Gibco) at 37°C and 5% CO2.
Transfection with Cas9 plasmids containing single guide (sg) RNAs
Two single guide (sg) RNAs, complementing the sequences flanking EDA exon, were designed and cloned into CRIPSR/Cas9 plasmid PX330, as described previously [15, 17, 34].
As the CNE-2Z cells reached about 60-70% confluence, and the SW480 reach about 70-80% confluence, the medium were replaced with serum free one for 6 h. Then the two plasmids were co-transfected into the cells respectively, with the Lipofectamine 2000 (Life Technologies). In 24 hours later, puromycin was added to CNE-2Z cells; while in the SW480 cells, puromycin was added at 36 hours after transfection. Both cell lines were incubated with puromycin (1.6 μg/ml) for additional 48 h.
The genomic DNA was extracted, and then the efficiency of EDA knockout was accessed with PCR, DNA sequencing was used to confirm EDA knockout [15, 35]. Untreated CNE-2Z or SW480 cells were used as control respectively. The sequences of primer and sgRNAs are presented in Table 5.
Table 5: Sequences of CRISPR sgRNA and confirming primers used in this study
Name |
sgRNA sequence (5'-3') |
PAM sequences |
DSB site in fibronectin (FN) |
|---|---|---|---|
sgRNA up-stream-F |
GTTACAGACATTG |
CAG |
216251681 |
sgRNA up-stream-R |
AACTTAGGGCGATCAATGTCTGT |
||
sgRNA down-stream-F |
GTTCTGATTGGAACCCAGTCCAC |
AGG |
216251434 |
sgRNA down-stream-R |
AACGTGGA CTGGGTTCCAATCAG |
||
primers |
product |
product without EDA |
|
Primer-down |
atagtgggttaattggact |
675bp |
≈400bp |
Primer-up |
agggtaatcacagggag |
Colony-forming unit (CFU) and population doubling time (PDT) assays
EDA-knockout and untreated CNE-2Z or SW480 cells were seeded onto 100-mm dishes at the density of 400 cells/dish for the CFU assay. The cells were cultured in RPMI 1640 or DMEM for 7 days and stained with 0.1% crystal violet, respectively. Aggregations of more than 50 cells were defined as colony formation units (CFUs).
Additionally, the two cell lines seeded onto 96-well plates at a density of 1000 cells/well respectively, for the determination of PDT. The cell numbers were determined daily in six wells, using Cell Counting Kit-8 (Dojindo, Kumamoto, Japan), according to the manufacturer’s instructions.
Wound-healing and transwell invasion assays
Cells were seeded into 24-well plates, grown to confluence, synchronized in fresh medium containing 0.5% FBS for 6 h, and the cell monolayer was wounded using a 300-400 μm pipette tip. The average linear speed of the movement of wound edges was quantified over 24 h. Cell invasion assay was performed using transwell chambers with a polycarbonate membrane (Millipore, Bedford, MA, USA), coated with 20 μg ECM gel (Sigma-Aldrich, Trading Co Ltd, Shanghai, China). In the upper chambers, CNE-2Z was seeded at 4×10⁴ cells/well, and SW480 was seed at 1×10⁵ cells/well. After 24 h of incubation, the membranes were stained with 0.1% crystal violet and the cells remaining on the upper surface of the membrane were wiped off.
Establishment of the xenograft model and in vivo EDA knockout using CRIPSR/Cas9 system
Four-week-old male BALB/c nude mice were purchased from Vital River Experimental Animal Technique Company (Beijing, China) and maintained in a specific pathogen-free condition. All the animals were acclimatized for 1 week before experiments, and then maintained under controlled temperature (22±2°C), with light dark periods of 12 hours and with free access to water and commercial diet [36].
The cells were digested using trypsin and washed by phosphate buffered saline (PBS) twice respectively, the CNE-2Z was re-suspended at the concentration of 3×10⁷cells/ml in PBS; the concentration of SW480 was 5×10⁷cells/ml. Following this, 3×10⁶ CNE-2Z cells as well as 5×10⁶ SW480 cells were subcutaneously injected into the flank region of each mouse, respectively. Tumor volume was measured with caliper and calculated using the following formula: V=length×width2×(π/6) [37]. This study was approved by the animal care committee guidelines of the Peking University biomedical ethics committee for laboratory animal welfare ethics, Bejing, China (Permit number: LA2012-53).
When the subcutaneous tumor volumes reached 70-100mm3, mice were randomly divided into three groups (n=6). CRISPR/Cas9 plasmids with sgRNAs for EDA knockout, were delivered by intra-tumor injections every 2 days (1μg/μL, 40μL/mouse; EDA knockout group), and the mice with tumors injected with PBS (40μL/mouse) or the CRISPR/Cas9 plasmid without sgRNAs (1μg/μL, 40μL/mouse) were included in the control groups: PBS and Cas9 plasmid groups, respectively. Tumor size and mouse weights were measured every other day. The mice were euthanized at the 17th day, and the weights of tumors were recorded.
RNA extraction, reverse transcription, and PCR amplification
Total RNA was isolated from all cells with TRIZOL reagent (Life Technologies), and 2-μg samples were reverse-transcribed into cDNA using the SuperScript First-Strand Synthesis System (Life Technologies), according to manufacturer’s instructions. These reactions were performed in a 20-μL reaction mixture with ABI 7500 real-time PCR system (ABI), including an initial incubation at 95ºC for 10 min, followed by 40 cycles of annealing/extension at 60ºC for 1 min, and denaturation at 95ºC for 15 s. The expression of E-cadherin, N-cadherin, Vimentin, Snail1, alpha-smooth muscle actin (α-SMA), Slug and VEGF was determined and normalized with human β-actin. All primers used in these experiments are described in Table 6.
Table 6: The primers used for real-time PCR
Name |
Primer |
Sequence(5’-3’) |
Gene ID |
|---|---|---|---|
E-cadherin |
Forward |
AACGAGGCTAACGTCGTAATCA |
NM_004360.3 |
Reverse |
CCCAGGGGACAAGGGTATGAA |
||
N-cadherin |
Forward |
GAGATCCTACTGGACGGTTCG |
NM_001792.3 |
Reverse |
TCTTGGCGAATGATCTTAGGA |
||
Vimentin |
Forward |
AAGGCGAGGAGAGCAGGATT |
NM_003380.3 |
Reverse |
GGTCATCGTGATGCTGAGAAG |
||
Snail1 |
Forward |
GCCTTCAACTGCAAATACTGC |
NM_005985.3 |
Reverse |
CTTCTTGACATCTGAGTGGGTC |
||
α-SMA |
Forward |
AAAAGACAGCTACGTGGGTGA |
NM_001141945.1 |
Reverse |
GCCATGTTCTATCGGGTACTTC |
||
Slug |
Forward |
GAGCATTTGCAGACAGGTCA |
NM_005985.3 |
Reverse |
CCTCATGTTTGTGCAGGAGA |
||
VEGF |
Forward |
TTATGCGGATCAAACCTCACC |
NM_001171630.1 |
Reverse |
GAAGCTCATCTCTCCTATGTGC |
||
β-actin |
Forward |
CATGTACGGTTGCTATCCAGGC |
NM_001101.3 |
Reverse |
CTCCTTAATGTCACGCACGAT |
Western blot analysis
Total proteins were extracted from cells grown in complete medium and the supernatants collected from 24-h serum-deprived cells [15]. Proteins were separated on a 12% SDS-PAGE, and transferred to nitrocellulose filter membranes, which were probed with the following antibodies overnight at 4°C: anti-E-cadherin (Santa Cruz Biotechnology, Dallas, TX, USA), anti-Snail1 (Cell Signaling Technology, Danvers, MA, USA), as well as anti-Flag, anti-Vimentin, IST-9, anti-FN, anti-Ki-67, and anti-β-actin (Abcam Ltd., Cambridge, MA, USA) antibodies. Immunocomplexes were detected with an enhanced chemiluminescence blotting kit (Applygen Technology Inc., Beijing, China).
Immunofluorescence and immunohistochemical (IHC) staining
Cells were fixed in 95% ethanol, blocked in 1% BSA in PBS, permeabilized in 0.5% Triton X-100 in PBS, and stained with anti-F-actin monoclonal antibody (1/500; Abcam Ltd., Cambridge, MA, USA) at 4°C overnight. F-actin was detected by using the indirect immunofluorescence, and fluorescence images were obtained using the DAPI excitation settings on the laser confocal microscope (Lsm 5 Exciter; Zeiss, Jena, Germany).
Xenograft tumor tissues were sectioned into 4-μm-thick slices and stained with IST-9, anti-EDA+FN, anti-Ki-67, anti-CD34, and anti-E-cadherin (Abcam Ltd., Cambridge, MA, USA) antibodies at 4°C overnight. They were subsequently incubated with the biotinylated secondary antibody (1:200) for 1 h. The immunocomplexes were visualized with diaminobenzidine (Zhongshan Golden Bridge Biological Technology CO., LTD, Beijing, China). Following the IHC staining for EDA+FN, Ki-67, and E-cadherin, the obtained results were semi-quantitatively analyzed by histological score (H-score) based on the positively stained cell number and staining intensity. The H-score was calculated using the following formula: HS=Σ Pi (1+i)/100, where Pi represents the percentage of stained cells at each intensity score (0-3) [15, 38]. The area of microvessels (μm2), identified by CD34 staining of vascular endothelial cells was assessed as previously described [29].
Statistical analysis
Data obtained in vitro was compared between the EDA knockout and untreated cells. All experiments were performed in triplicates. Quantitative data were expressed as mean ± standard deviation (SD) and analyzed using the Student’s t-test, for the differences between paired groups.
In vivo obtained results were compared between PBS, Cas9 plasmid, and EDA knockout groups. Each group contained six biological samples. H-scores obtained by IHC analyses, the area of microvessels, tumor volumes and the weights of tumor or animal were expressed as mean ± SD, and they were analyzed using one-way analysis of variance (ANOVA) for the difference between these groups. Statistical significance was set at P<0.05.
Abbreviations
EDA+FN: extra domain A positive fibronectin; CRISPR/Cas system: clustered regularly interspaced palindromic repeats-associated system; ECM: extracellular matrix; VEGF: vascular endothelial growth factor; EMT: epithelial-mesenchymal transition; SACC: salivary adenoid cystic carcinoma; α-SMA: alpha-smooth muscle actin.
Author contributions
Wan-Qi Lv and Hai-Cheng Wang conceived the study and designed the experiment. Jiu-Hui Jiang and Cui-Ying Li provided the experimental materials. Wan-Qi Lv, Jing Peng and Hai-Cheng Wang performed the experiment. Wan-Qi Lv, Hai-Cheng Wang, Yi-Xiang Wang, Jiu-Hui Jiang and Cui-Ying Li performed the data analysis. All authors contributed to the interpretation and discussion of the results and wrote the manuscript. All authors have approved the manuscript for submission.
ACKNOWLEDGMENTS
This work was supported by National Nature Science Foundation of China (No. 81072214), (No. 30371547), (No. 81600836), a National Key R&D Program of China (No. 2016YFC1102603) and a China Postdoctoral Science Foundation (No. 2016M591718).
CONFLICTS OF INTEREST
The authors declare no competing financial interests
REFERENCES
1. Bhang HE, Ruddy DA, Krishnamurthy Radhakrishna V, Caushi JX, Zhao R, Hims MM, Singh AP, Kao I, Rakiec D, Shaw P, Balak M, Raza A, Ackley E, et al. Studying clonal dynamics in response to cancer therapy using high-complexity barcoding. Nat Med. 2015; 21:440-448. doi: 10.1038/nm.3841.
2. Swanton C. Intratumor heterogeneity: evolution through space and time. Cancer research. 2012; 72:4875-4882. doi: 10.1158/0008-5472.CAN-12-2217.
3. DeBerardinis RJ, Lum JJ, Hatzivassiliou G, Thompson CB. The biology of cancer: metabolic reprogramming fuels cell growth and proliferation. Cell Metab. 2008; 7:11-20. doi: 10.1016/j.cmet.
4. Jones RG, Thompson CB. Tumor suppressors and cell metabolism: a recipe for cancer growth. Genes Dev. 2009; 23:537-548. doi: 10.1101/gad.1756509.
5. Tannock IF, Hickman JA. Limits to Personalized Cancer Medicine. N Engl J Med. 2016; 375:1289-1294. doi: 10.1056/NEJMsb1607705.
6. Prasad V. Perspective: The precision-oncology illusion. Nature. 2016; 537:S63. doi: 10.1038/537S63a.
7. D'Alfonso TM, Mosquera JM, MacDonald TY, Padilla J, Liu YF, Rubin MA, Shin SJ. MYB-NFIB gene fusion in adenoid cystic carcinoma of the breast with special focus paid to the solid variant with basaloid features. Hum Pathol. 2014; 45:2270-2280. doi: 10.1016/j.humpath.
8. Kumra H, Reinhardt DP. Fibronectin-targeted drug delivery in cancer. Advanced drug delivery reviews. 2016; 97:101-110. doi: 10.1016/j.addr.
9. McFadden JP, Baker BS, Powles AV, Fry L. Psoriasis and extra domain A fibronectin loops. Br J Dermatol. 2010; 163:5-11. doi: 10.1111/j.1365-2133.2010.09737.x.
10. Guyot M, Hilmi C, Ambrosetti D, Merlano M, Lo Nigro C, Durivault J, Grepin R, Pages G. Targeting the pro-angiogenic forms of VEGF or inhibiting their expression as anti-cancer strategies. Oncotarget. 2017; 8:9174-9188. doi: 10.18632/oncotarget.13942.
11. Kessenbrock K, Plaks V, Werb Z. Matrix metalloproteinases: regulators of the tumor microenvironment. Cell. 2010; 141:52-67. doi: 10.1016/j.cell.2010.03.015.
12. Wolf K, Te Lindert M, Krause M, Alexander S, Te Riet J, Willis AL, Hoffman RM, Figdor CG, Weiss SJ, Friedl P. Physical limits of cell migration: control by ECM space and nuclear deformation and tuning by proteolysis and traction force. The Journal of cell biology. 2013; 201:1069-1084. doi: 10.1083/jcb.201210152.
13. Marusyk A, Tabassum DP, Altrock PM, Almendro V, Michor F, Polyak K. Non-cell-autonomous driving of tumour growth supports sub-clonal heterogeneity. Nature. 2014; 514:54-58. doi: 10.1038/nature13556.
14. Enriquez-Navas PM, Kam Y, Das T, Hassan S, Silva A, Foroutan P, Ruiz E, Martinez G, Minton S, Gillies RJ, Gatenby RA. Exploiting evolutionary principles to prolong tumor control in preclinical models of breast cancer. Sci Transl Med. 2016; 8:327-324. doi: 10.1126/scitranslmed.aad7842.
15. Wang HC, Yang Y, Xu SY, Peng J, Jiang JH, Li CY. The CRISPR/Cas system inhibited the pro-oncogenic effects of alternatively spliced fibronectin extra domain A via editing the genome in salivary adenoid cystic carcinoma cells. Oral diseases. 2015; 21:608-618. doi: 10.1111/odi.12323.
16. Xue W, Chen S, Yin H, Tammela T, Papagiannakopoulos T, Joshi NS, Cai W, Yang G, Bronson R, Crowley DG, Zhang F, Anderson DG, Sharp PA, et al. CRISPR-mediated direct mutation of cancer genes in the mouse liver. Nature. 2014; 514:380-384. doi: 10.1038/nature13589.
17. Yin H, Xue W, Chen S, Bogorad RL, Benedetti E, Grompe M, Koteliansky V, Sharp PA, Jacks T, Anderson DG. Genome editing with Cas9 in adult mice corrects a disease mutation and phenotype. Nat Biotechnol. 2014; 32:551-553. doi: 10.1038/nbt.2884.
18. Ou J, Pan F, Geng P, Wei X, Xie G, Deng J, Pang X, Liang H. Silencing fibronectin extra domain A enhances radiosensitivity in nasopharyngeal carcinomas involving an FAK/Akt/JNK pathway. Int J Radiat Oncol Biol Phys. 2012; 82:e685-691. doi: 10.1016/j.ijrobp.2011.09.040.
19. Xiang L, Xie G, Ou J, Wei X, Pan F, Liang H. The extra domain A of fibronectin increases VEGF-C expression in colorectal carcinoma involving the PI3K/AKT signaling pathway. PloS one. 2012; 7:e35378. doi: 10.1371/journal.pone.0035378.
20. Albini A. Extracellular Matrix Invasion in Metastases and Angiogenesis: Commentary on the Matrigel "Chemoinvasion Assay". Cancer Res. 2016; 76:4595-4597. doi: 10.1158/0008-5472.CAN-16-1971.
21. Suzuki K, Tsunekawa Y, Hernandez-Benitez R, Wu J, Zhu J, Kim EJ, Hatanaka F, Yamamoto M, Araoka T, Li Z, Kurita M, Hishida T, Li M, et al. In vivo genome editing via CRISPR/Cas9 mediated homology-independent targeted integration. Nature. 2016. doi: 10.1038/nature 20565.
22. Orthwein A, Noordermeer SM, Wilson MD, Landry S, Enchev RI, Sherker A, Munro M, Pinder J, Salsman J, Dellaire G, Xia B, Peter M, Durocher D. A mechanism for the suppression of homologous recombination in G1 cells. Nature. 2015; 528:422-426. doi: 10.1038/nature16142.
23. Moskaluk CA. Adenoid cystic carcinoma: clinical and molecular features. Head and neck pathology. 2013; 7:17-22. doi: 10.1007/s12105-013-0426-3.
24. Torres CM, Biran A, Burney MJ, Patel H, Henser-Brownhill T, Cohen AS, Li Y, Ben-Hamo R, Nye E, Spencer-Dene B, Chakravarty P, Efroni S, Matthews N, et al. The linker histone H1.0 generates epigenetic and functional intratumor heterogeneity. Science. 2016; 353. doi: 10.1126/science.aaf1644.
25. Hanahan D, Weinberg RA. Hallmarks of cancer: the next generation. Cell. 2011; 144:646-674. doi: 10.1016/j.cell.2011.02.013.
26. Demicheli R, Retsky MW, Hrushesky WJ, Baum M, Gukas ID. The effects of surgery on tumor growth: a century of investigations. Ann Oncol. 2008; 19:1821-1828. doi: 10.1093/annonc/mdn 386.
27. Di Gregorio A, Bowling S, Rodriguez TA. Cell Competition and Its Role in the Regulation of Cell Fitness from Development to Cancer. Dev Cell. 2016; 38:621-634. doi: 10.1016/j.devcel.2016.08. 012.
28. Harper SJ, Bates DO. VEGF-A splicing: the key to anti-angiogenic therapeutics? Nature reviews Cancer. 2008; 8:880-887. doi: 10.1038/nrc2505.
29. Ajili F, Kacem M, Tounsi H, Darouiche A, Enayfer E, Chebi M, Manai M, Boubaker S. Prognostic impact of angiogenesis in nonmuscle invasive bladder cancer as defined by microvessel density after immunohistochemical staining for CD34. Ultrastruct Pathol. 2012; 36:336-342. doi: 10.3109/01913 123.2012.672847.
30. Maddalo D, Manchado E, Concepcion CP, Bonetti C, Vidigal JA, Han YC, Ogrodowski P, Crippa A, Rekhtman N, de Stanchina E, Lowe SW, Ventura A. In vivo engineering of oncogenic chromosomal rearrangements with the CRISPR/Cas9 system. Nature. 2014; 516:423-427. doi: 10.1038/nature13902.
31. Lipinski MM, Jacks T. The retinoblastoma gene family in differentiation and development. Oncogene. 1999; 18:7873-7882. doi: 10.1038/sj.onc.1203244.
32. Ghebranious N, Donehower LA. Mouse models in tumor suppression. Oncogene. 1998; 17:3385-3400.
33. Khan FA, Pandupuspitasari NS, Chun-Jie H, Ao Z, Jamal M, Zohaib A, Hakim MR, ShuJun Z. CRISPR/Cas9 therapeutics: a cure for cancer and other genetic diseases. Oncotarget. 2016; 7:52541-52552. doi: 10.18632/oncotarget.9646.
34. Liu T, Li Z, Zhang Q, De Amorim Bernstein K, Lozano-Calderon S, Choy E, Hornicek FJ, Duan Z. Targeting ABCB1 (MDR1) in multi-drug resistant osteosarcoma cells using the CRISPR-Cas9 system to reverse drug resistance. Oncotarget. 2016; 7: 83502-83513. doi: 10.18632/oncotarget.13148.
35. Cong L, Ran FA, Cox D, Lin S, Barretto R, Habib N, Hsu PD, Wu X, Jiang W, Marraffini LA, Zhang F. Multiplex genome engineering using CRISPR/Cas systems. Science. 2013; 339:819-823. doi: 10.1126/science.1231143.
36. Chen YW, Wang HC, Gao LH, Liu C, Jiang YX, Qu H, Li CY, Jiang JH. Osteoclastogenesis in Local Alveolar Bone in Early Decortication-Facilitated Orthodontic Tooth Movement. PloS one. 2016; 11:e0153937. doi: 10.1371/journal.pone.0153937.
37. Shidal C, Al-Rayyan N, Yaddanapudi K, Davis KR. Lunasin is a novel therapeutic agent for targeting melanoma cancer stem cells. Oncotarget. 2016; 7: 84128-84141. doi: 10.18632/oncotarget.11554.
38. Budwit-Novotny DA, McCarty KS, Cox EB, Soper JT, Mutch DG, Creasman WT, Flowers JL, McCarty KS Jr. Immunohistochemical analyses of estrogen receptor in endometrial adenocarcinoma using a monoclonal antibody. Cancer Res. 1986; 46:5419-5425.