
INTRODUCTION
Malignant pleural mesothelioma (MPM) is a highly aggressive and fatal cancer that is most commonly associated with asbestos exposure [1]. Due to differences in asbestos contact, MPM incidence varies not only between but also within countries [2]. Although it used to be a rare disease, its incidence has been increasing in recent years and it is expected to continue in the next decades. This is mainly due to an ongoing asbestos use in developing countries, as well as the long latency period between asbestos exposure and the development of disease [3]. MPM is characterized by a bad prognosis. Palliative platinum-antifolate chemotherapy has a significant but limited impact on patients’ outcome with a median overall survival of about one year [4, 5]. Based on this poor prognosis and the increasing incidence, novel therapeutic strategies for MPM are urgently required.
Preliminary clinical evidence suggests a critical role for the immune system in protection against MPM [6–8] and recent promising clinical results have been reported on inhibition of the immune checkpoints cytotoxic T-lymphocyte antigen-4 (CTLA-4) and programmed death-1 (PD-1) or its ligand PD-L1 in MPM [9–14]. It is postulated that blocking immune checkpoints reactivates silenced immune responses by preventing immune cell exhaustion and tolerance. Gaining more insight in the immunological aspect of the tumor microenvironment (TME) is of great interest in order to identify biomarkers and to unravel these silenced immune responses in order to identify possible new targets for MPM treatment. Therefore, we previously investigated the immune composition and the expression of immune checkpoints in human MPM tissue samples [15]. Now, we want to focus on pleural and peritoneal effusions. These effusions are often present in MPM patients [3] and are easily collected via thoracocentesis or paracentesis. Tumor cells and immune cells have been described to be present in pleural effusions [3, 16]. Extensive investigation of the cellular composition in relation to the expression of immune checkpoints could help to identify prognostic markers in the effusions. It could also provide useful information on immunomodulatory molecules that are expressed in the TME potentially dampening the antitumor immune responses, helping forward the development of novel targeted therapies.
The few studies on effusions of mesothelioma patients mainly report on the presence of a limited array of immune cells, being CD4+ and CD8+ T cells and macrophages [17–20]. One of those studies also describes the expression of PD-1 and PD-L1 [18], but to the best of our knowledge nothing has been described about the expression of T cell immunoglobulin mucin-3 (TIM-3) and lymphocyte activation gene-3 (LAG-3) in mesothelioma effusions. The latter two are upcoming immune checkpoints that are gaining more attention due to interesting preclinical results in different tumor types [21–25] and ongoing clinical trials testing specific blocking antibodies (NCT01968109; NCT02817633). LAG-3 is expressed on the surface of activated T cells. It also binds to MHCII molecules expressed on antigen presenting cells but in contrast to CD4, LAG-3 exerts a negative regulatory effect on the proliferation and activation of T lymphocytes [21, 22]. Expression of TIM-3 and its ligand galectin-9 has been described on several immune cells and galectin-9 can also be overexpressed by cancer cells [26, 27]. Interaction of TIM-3 with galectin-9 results in decreased immune cell functioning and even immune cell death. We have recently described the absence of LAG-3 and the presence of TIM-3 on tumor cells and stromal immune cells in mesothelioma tissue [15].
In this study, we characterized the cellular composition and TIM-3, LAG-3, PD-1 and PD-L1 immune checkpoint expression of pleural and ascites fluid samples collected from MPM patients at least one month after chemotherapy treatment. Relating to patients’ outcome and response to chemotherapy, we identified two effusion-related factors with clinical value.
RESULTS
Immune cell composition of MPM effusions is variable and patient-dependent
Flow cytometry was used to analyze the immune cell composition in five ascites fluids and six pleural fluids collected from MPM patients at least one month after chemotherapy treatment. All cell types analyzed could be detected in the fluids with a variable distribution (Table 1). Predominant cells were CD3+CD4+ T cells, CD64+ macrophages and CD11c+ or CD303+ dendritic cells (DCs) with percentages up to 51.7%, 38.8% and 43.4% of viable cells, respectively. CD3+CD8+ T cells, CD3-CD56+ natural killer (NK) cells and CD19+ B cells were less present, with maxima of 16.9%, 13.5% and 2.9% viable cells per sample. Based on the expression of podoplanin (PDPN), a marker for MPM tumor cells [28–31], ascites fluids contained slightly more PDPN+ tumor cells compared to pleural fluids (median 0.5% vs 0.1%). Higher percentages of immune cells were noted in the ascites fluids compared to the pleural fluid samples, with p-values ranging from 0.247 to 0.930 (Table 1).
Table 1: Immune composition of pleural and ascites fluid samples from MPM patients
CD4+ T CELLS (%) |
CD8+ T CELLS (%) |
NK CELLS (%) |
DCs (%) |
B CELLS (%) |
MACROPHAGES (%) |
TUMOR CELLS (%) |
|
|---|---|---|---|---|---|---|---|
Pleural fluid |
|||||||
Sample 1 (E) |
2.98 |
1.23 |
1.10 |
36.97 |
0.30 |
17.00 |
0.58 |
Sample 2 (S) |
2.99 |
0.80 |
0.04 |
0.59 |
1.21 |
0.46 |
0.02 |
Sample 3 (S) |
31.16 |
5.84 |
0.83 |
4.09 |
1.77 |
3.31 |
0.04 |
Sample 4 (E) |
4.45 |
0.91 |
0.09 |
0.67 |
0.40 |
0.46 |
0.02 |
Sample 5 (E) |
33.83 |
2.45 |
1.27 |
16.77 |
2.86 |
15.70 |
0.11 |
Sample 6 (E) |
29.41 |
7.71 |
2.41 |
27.33 |
1.72 |
26.03 |
0.26 |
MEDIAN |
16.93 |
1.84 |
0.96 |
10.43 |
1.47 |
9.50 |
0.08 |
SD |
15.41 |
2.92 |
0.88 |
15.28 |
0.96 |
10.62 |
0.22 |
RANGEMIN |
2.99 |
0.80 |
0.04 |
0.67 |
0.30 |
0.46 |
0.02 |
RANGEMAX |
33.83 |
7.71 |
2.41 |
36.97 |
2.86 |
26.03 |
0.60 |
Ascites fluid |
|||||||
|---|---|---|---|---|---|---|---|
Sample 1 (E) |
20.47 |
2.78 |
2.35 |
12.26 |
1.27 |
11.20 |
0.53 |
Sample 2 (E) |
4.15 |
1.95 |
0.35 |
43.43 |
0.43 |
38.80 |
12.86 |
Sample 3 (E) |
51.75 |
11.83 |
0.85 |
12.60 |
2.07 |
11.87 |
0.54 |
Sample 4 (E) |
18.12 |
16.88 |
13.48 |
28.17 |
0.78 |
24.57 |
0.86 |
Sample 5 (N) |
0.80 |
0.79 |
0.05 |
0.06 |
0.05 |
0.06 |
0.01 |
MEDIAN |
18.12 |
2.78 |
0.85 |
12.60 |
0.78 |
11.87 |
0.54 |
SD |
20.17 |
7.12 |
5.69 |
16.78 |
0.78 |
14.83 |
5.54 |
RANGEMIN |
0.80 |
0.79 |
0.35 |
0.06 |
0.05 |
0.06 |
0.01 |
RANGEMAX |
51.75 |
16.88 |
13.48 |
43.43 |
2.07 |
38.80 |
12.86 |
All percentages are calculated within the total population of viable cells. E, epitheloid; S, sarcomatoid; N, no data.
Inter and intra sample type variation of PD-1, TIM-3 and LAG-3 expression
The immune checkpoints PD-1, LAG-3 and TIM-3 were expressed on CD3+CD4+ T cells, CD3+CD8+ T cells and on NK cells in both fluid types. PD-1 expression was found in all samples on CD8+ T cells and in ten samples on CD4+ T cells and/or NK cells. Positivity of LAG-3 was seen in nine samples on CD4+ T cells, in seven samples on CD8+ T cells and in eight samples on NK cells. Expression of TIM-3 was observed in all samples on CD4+ T cells and NK cells and in nine samples on CD8+ T cells (Figure 1). Figure 1 and Table 2 depict the distributions and proportions of PD-1, LAG-3 and TIM-3 expression on CD3+CD4+ and CD3+CD8+ T cells and NK cells. All pleural samples were positive for PD-1 on all three cell types, whereas PD-1 was expressed on CD8+ T cells and NK cells in four of the five ascites samples. PD-1 positivity varied in each cell type, ranging from 9% to 61.9% for the CD4+ T cells, 11.4% to 66.4% for the CD8+ T cells and 3.28% to 64.3 % for the NK cells. LAG-3+ cells were detected in a higher proportion of pleural fluids compared to ascites fluids. LAG-3 expression on a per cell-base, is highest on NK cells in both fluid types. A wide range of LAG-3 expression per cell type was recorded, from 1.3–47.6% LAG-3+ CD4+ T cells, 1.1–49.5% LAG-3+ CD8+ T cells and 1.0–68.1% LAG-3+ NK cells (Table 2). TIM-3 was expressed on most of the NK cells while less CD3+CD4+ and CD3+CD8+ T cells were positive (Figure 1). Based on the difference in mean fluorescence intensity (ΔMFI) values, the highest expression per cell was seen on NK cells. Like PD-1 and LAG-3, the proportion of TIM-3+ positive cells varied strongly, illustrated by 5.7–51.6% TIM-3+CD4+ T cells, 5.9–59.7% TIM-3+CD8+ T cells and 13.3–83.6% TIM-3+ NK cells (Figure 1).
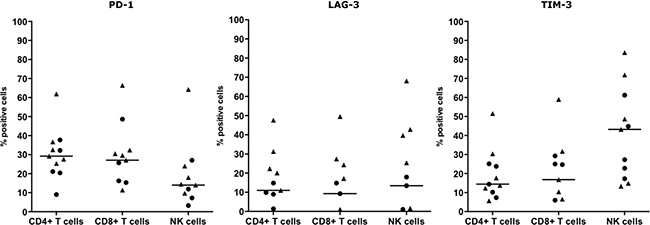
Figure 1: T cell and NK cell immune checkpoint surface expression in MPM pleural and ascites fluids. Surface expression of PD-1, LAG-3 and TIM-3 on CD3+CD4+ T cells, CD3+CD8+ T cells and CD3-CD56+ NK cells from five ascites (•) and six pleural (▲) fluids. Percentages of marker-positive cells were determined using the overton subtraction tool in the FlowJo software. The bar represents the median value within all samples.
Table 2: Immune checkpoint expression of MPM effusion-resident immune cells
CD4+ T CELLS |
CD8+ T CELLS |
NK CELLS |
||
|---|---|---|---|---|
Pleural fluids (n = 6) |
||||
PD-1 |
Positive samples (%) |
6/6 |
6/6 |
6/6 |
ΔMFI rangeMIN-MAX |
772–4902 |
1032–7066 |
763–3932 |
|
LAG-3 |
Positive samples (%) |
5/6 |
5/6 |
5/6 |
ΔMFI rangeMIN-MAX |
61–1221 |
60–7311 |
231–14819 |
|
TIM-3 |
Positive samples (%) |
6/6 |
5/6 |
6/6 |
ΔMFI rangeMIN-MAX |
91–1539 |
1225–5996 |
1297–12541 |
|
Ascites fluids (n = 5) |
||||
|---|---|---|---|---|
PD-1 |
Positive samples (%) |
5/5 |
4/5 |
4/5 |
ΔMFI rangeMIN-MAX |
689– 4981 |
783–6009 |
215–4708 |
|
LAG-3 |
Positive samples (%) |
3/5 |
2/5 |
3/5 |
ΔMFI rangeMIN-MAX |
154–867 |
208–230 |
36–1410 |
|
TIM-3 |
Positive samples (%) |
5/5 |
4/5 |
5/5 |
ΔMFI rangeMIN-MAX |
368–5194 |
338–6706 |
3036–9595 |
|
Variation in the intensity of expression is shown by the range of Δ MFI values. MFI, Mean Fluorescence Intensity.
PD-1 ligand-1 expression is highest on PDPN+ tumor cells
PD-1 ligand-1, PD-L1, expression was detected on DCs, B cells, macrophages and PDPN+ MPM tumor cells in all ascites samples, while in pleural samples PD-L1 expression varied per cell type (Figure 2, Table 3). Positivity of PD-L1 on DCs was found in all samples, while positivity of PD-L1 on B cells was found in nine samples and ten samples showed expression of PD-L1 on macrophages and PDPN+ tumor cells. Highest PD-L1 expression was found on the PDPN+ tumor cells in both fluid types, with a median expression of 19.4% PD-L1+ cells and a range of 20 up to 14524 on a per cell basis (Table 3). Similar to the immune checkpoints, there is a broad range of PD-L1 positivity between and within the fluid types. In ascites fluid samples, more PD-L1+ DCs (p = 0.052) and PD-L1+ macrophages (p = 0.052) were present compared to the pleural fluid samples.
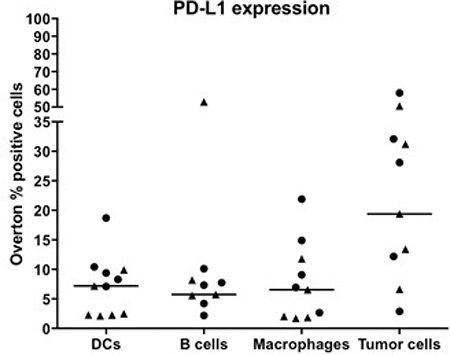
Figure 2: Expression of PD-L1 on immune cells and tumor cells in pleural and ascites fluids of MPM patients. Data of eleven different patient samples are shown: five ascites (•) and six pleural (▲) fluids. Percentages of marker-positive cells were determined using the overton subtraction tool in the FlowJo software. The bar represents the median value within all samples.
Table 3: Overview of PD-L1 expression on immune cells and MPM tumor cells in eleven different MPM fluid samples
DCs |
B CELLS |
MACROPHAGES |
TUMOR CELLS |
||
|---|---|---|---|---|---|
Pleural fluid |
|||||
PD-L1 |
Positive samples (%) |
6/6 |
4/6 |
5/6 |
5/6 |
ΔMFI rangeMIN-MAX |
305–749 |
9–1684 |
128–972 |
20–14524 |
|
Ascites fluid |
|||||
|---|---|---|---|---|---|
PD-L1 |
Positive samples (%) |
5/5 |
5/5 |
5/5 |
5/5 |
ΔMFI rangeMIN-MAX |
159–1296 |
10–477 |
331–1801 |
955–2679 |
|
Variation in the intensity of expression is shown by the range of ΔMFI values. MFI, Mean Fluorescence Intensity.
Expression of immune checkpoints is correlated with immune cell activation
We investigated correlations between immune cell types expressing immune checkpoints. Expression of PD-1, TIM-3 and LAG-3 on CD4+ T cells was correlated with their expression on CD8+ T cells [spearman correlation coefficient (ρs) = 0.74, p = 0.013; ρs = 0.87, p < 0.001; ρs = 0.89, p < 0.001, respectively; Figure 3]. TIM-3 and LAG-3 expression was also correlated with CD4+ T cells and NK cells (ρs = 0.66, p = 0.031; ρs = 0.81, p = 0.003, respectively). For LAG-3 but not TIM-3, expression on CD8+ T cells was also strongly correlated with its expression on NK cells (ρs = 0.94, p < 0.001). For the PD-1 ligand PD-L1, a positive correlation was found for its expression on DCs and macrophages (ρs = 0.77, p = 0.008, Figure 3). PD-1, LAG-3 and TIM-3 expression was also put in relation with an activated phenotype of CD3+CD4+, CD3+CD8+ T cells and CD3-CD56+ NK cells, assessed by CD69 expression. CD69 expression was significantly correlated with the expression of PD-1 and TIM-3 on CD3+CD8+ T cells (ρs = 0.65, p = 0.037; ρs = 0.77, p = 0.005; Figure 3).
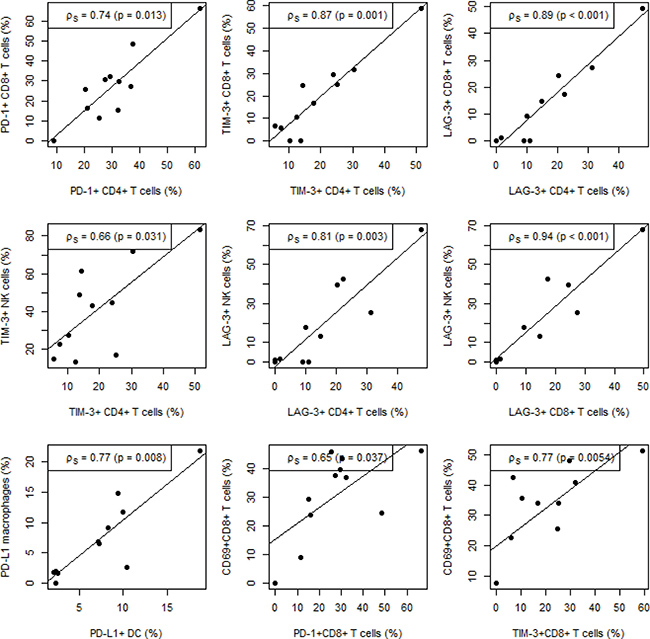
Figure 3: Correlation between immune checkpoint expression on different immune cells and immune cell activation. Significant correlations between immune checkpoint expression on different subsets of immune cells as well as immune cell activation are depicted on the scatter plots. Spearman correlation (ρs) coefficients and corresponding p-values are shown for each correlation. The lines represent linear regression fits.
Patient-matched MPM tissue and effusion samples show specific cell and immune checkpoint expression
Matched tissue and effusion samples from four patients allowed us to compare their immune cell composition and immune checkpoint expression. Immunohistochemistry on paraffin-embedded diagnostic tissue samples [15] and multi-parameter flow cytometry on pleural fluids (vide Materials and methods) was assessed for the presence of CD4+ and CD8+ T cells and macrophages and the expression of PD-L1 on tumor cells and PD-L1, LAG-3 and TIM-3 on lymphocytes. Patient-matched comparison indicates that the immune composition and immune checkpoint expression differs between the sample types (Supplementary Table 1). Higher percentages of macrophages and lymphocytes were noted in the tissue samples compared to the fluid samples. We also observed an inter sample type variation in immune checkpoint expression on lymphocytes and PD-L1 expression on tumor cells present in the fluid and tissue samples.
Two MPM effusion-related cellular parameters with clinical value
Searching for parameters with a potent clinical value, univariate analysis indicates that there is a significant correlation between CD3+CD4+ T cells in MPM effusions after chemotherapy [Mc Fadden’s pseudo coefficient of determination (R) = 0.63, p = 0.033]. More specifically, partial/complete response to cisplatin/pemetrexed-based chemotherapy was more often noted in patients with high percentages of CD4+ T cells [odds ratio (OR) = 1.13; Figure 4]. Small sample size and the use of discrete variables (0 or 1) made multivariate analysis not feasible. Relating with clinical outcome, PD-L1 expression on effusion-resident PDPN+ tumor cells has significant impact on the patient’s survival [risk ratio (RR) = 1.10, p = 0.011; Figure 5]. The likelihood ratio obtained after Cox regression analysis shows that a 1% increase of PD-L1+ PDPN+ tumor cells will increase the risk of dying with a factor of 1.10.
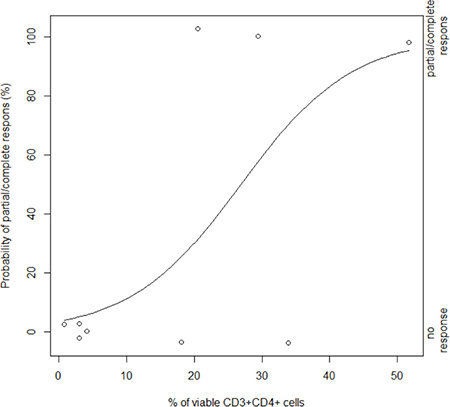
Figure 4: Dependency between chemotherapy response and the presence of CD3+CD4+ T cells after treatment. Plot of response on chemotherapy (y-axis) versus percentage of viable CD3+CD4+ cells in the fluids after treatment (x-axis). Observations within our cohort are represented by the empty dots (right y-axis). The curve depicts the estimated probability of partial/complete response based on a univariate logistic regression model (p = 0.033; left y-axis).
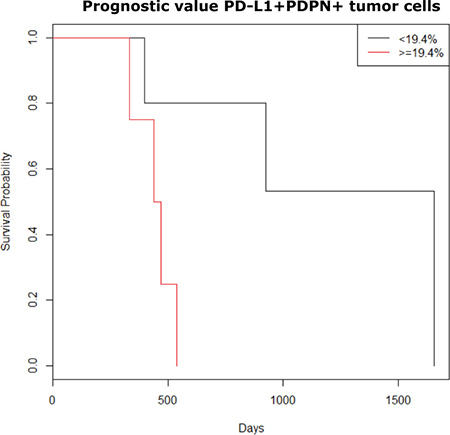
Figure 5: Kaplan Meier overall survival according to percentages of PD-L1+ tumor cells present in MPM fluid samples. The variable PD-L1+PDPN+ tumor cells (%) was divided into two groups based on the median value for the percentage of PD-L1+PDPN+ cells in our samples (median = 19.4%). Univariate analysis showed prognostic significance for PD-L1+PDPN+ tumor cells (p = 0.012). After multivariate adjustments, it remained an independent negative prognostic factor.
DISCUSSION
Our study shows different subsets of immune cells to be present in MPM pleural and ascites fluid samples. Although statistically not significant, we did observe differences regarding the immune constitution between both fluid types as well as within the same fluid type. This suggests that the immune constitution of MPM fluid samples depends on the patient rather than on the fluid type but more evidence is needed. The different subsets of immune cells showed distinct expression profiles for several immune checkpoints and PD-L1. Like the immune composition, also the expression profiles varied within the different samples as well as between the two different sample types.
Our results confirm the study from Khanna et al. [18] that describes the presence of PD-L1+ tumor cells and both PD-1+ and PD-L1+ infiltrating immune cells in effusions of mesothelioma patients. The fraction of T cells expressing PD-1 varied a lot in this study (12% to 83%) which is in line with the variation seen in our own samples with a range from 9% up to 67% PD-1+ T-cells. They also reported basal PD-L1 expression in all their mesothelioma effusion samples with a broad range for the PD-L1 ΔMFI values, which is again in concordance with our own data.
While PD-L1 expression in MPM tissue samples has already been reported to be associated with decreased overall survival [32, 33], as far as we know we are the first to report this for MPM fluid samples. Based on flow cytometric PDPN staining we found only few circulating PDPN+ tumor cells were present in ascites samples and even less were found in pleural fluids. Miyoshi et al. [34] made paraffin-embedded cell blocks from pleural fluids and used them for immunohistochemical staining. They found tumor cells in those cell blocks based on cytology, confirming our data about the presence of PDPN+ tumor cells in the fluid samples. Due to the tight organization of the tumor tissue as well as the surrounding mesothelial cells, tumor cells are expected not to float abundantly into patients’ effusions.
Our data show that expression of PD-L1 on PDPN+ tumor cells in our fluid samples is a poor prognostic factor. Our study is limited by its small sample size which is why we used non-parametric tests for statistical analyses. The fact that PD-L1 expression on PDPN+ tumor cells was found to be a significant factor in our small cohort supports the need for further research in a larger cohort. On top of that, the prognostic value that we found for PD-L1 expression on MPM tumor cells is also supported by other studies in mesothelioma tissue samples [33, 35, 36] as well as in other cancer types [37–39]. Since the tumor cells express PD-L1, they might induce the expression of PD-1 and PD-L1 on surrounding immune cells via activation of the PD-1/PD-L1 pathway [40]. The associated decreased survival can be explained by an overstimulation of the PD-1/PD-L1 pathway leading to immune cell exhaustion with an inefficient antitumor response as final result. It would be interesting to investigate in future studies if the expression of PD-1 and PD-L1 in effusions might be good predictive factors for response to anti PD-1/PD-L1 blocking therapy.
As tissue samples from MPM patients are not always available and most epithelioid mesothelioma patients develop effusions over time [1, 41], fluids might offer an alternative for a repeat biopsy for pharmacodiagnostic or prognostic purposes. Multi-parametric analysis of MPM fluids could then be used as an alternative for more elaborate immunohistochemistry on tissue samples for predictive (when the samples are obtained prior to treatment) and prognostic purposes.
In addition to PD-1 and PD-L1, also the immune checkpoints TIM-3 and LAG-3 can affect the antitumor response by inhibiting lymphocyte activity. Therefore, investigation of immune checkpoint expression as well as immune cell profiling of the TME might be of great value to select patients who are most likely to benefit from chemo- or immunotherapy and to provide additional information on patient’s outcome. To our knowledge, we are the first to describe the expression of TIM-3 and LAG-3 on CD4+ and CD8+ T cells and CD3-CD56+ NK cells in effusions of mesothelioma patients. Like PD-1 expression, we observed a considerable interpatient variation regarding the immune cell expression of TIM-3 and LAG-3. NK cells showed the highest expression of both markers, confirming previous MPM-unrelated reports [42–44]. Based on our results from MPM fluids not only TIM-3 could be an interesting target for MPM, but also LAG-3 might offer new opportunities. Clinical trials with TIM-3 and LAG-3 blockade in various solid tumor types are ongoing (NCT02817633; NCT02608268; NCT01968109; NCT03005782). Interestingly, our recent work [15] showed no expression of LAG-3 on tumor cells and immune cells in MPM tissue samples while our data in fluid samples showed its presence on T cells as well as NK cells. Since effusions most often occur in an inflammatory context which is known to influence the expression of immune checkpoints [45] it is quite possible that the fluid samples do not reflect the tumor microenvironment. Comparison of four patient-matched tissue and fluid samples demonstrates that the two milieus have a distinct immune composition and expression of immune checkpoints, which might be an explanation for the discrepancy observed between tissue and fluid samples. From our small sample size, it is suggested that MPM fluid samples do not have the same cellular characteristics as MPM tissue samples, which has also been suggested by Lievense et al. [46]. They compared the presence of T cells and macrophages in pleural effusions of 5 MPM patients with matched tissue samples and suggested that the immune cell composition of the effusions does not necessarily reflect the properties of the tumor tissue. Our results also confirm the presence of CD4+ T cells, CD8+ T cells and macrophages in pleural effusions of MPM patients [18–20]. Another explanation for the discrepancy between MPM tissue sample and effusion results for LAG-3 might be the use of different antibody clones for immunohistochemistry and flow cytometry. It might be that the expression levels are too low to be detected with immunohistochemistry, while the signal can be picked up by the flow cytometry antibody due to a higher sensitivity.
In general, PD-1, TIM-3 and LAG-3 were expressed on immune cells present in the majority of pleural and ascites samples. Our data showed that expression of an immune checkpoint on CD4+ T cells was positively correlated with its expression on CD8+ T cells and that the expression of TIM-3 or LAG-3 on CD4+ T cells was also correlated with their expression on NK cells. These correlations might be explained by the close interaction between these cell types in order to elicit an antitumor immune response. CD4+ T cells provide help to CD8+ T cells and NK cells by secreting immunostimulatory cytokines [47–49]. Since expression of PD-1, TIM-3 and LAG-3 has been reported on activated immune cells [26, 50, 51], stimulation of these cells will result in an increased expression on all three cell types. This idea is supported by the positive correlations that we found between CD69 and PD-1 expression and between CD69 and TIM-3 expression on CD8+ T cells. In the evaluated patient population of cisplatin/pemetrexed-treated patients who developed effusions over time, we observed that the percentage of CD3+CD4+ T cells is significantly correlated with the patients’ response to chemotherapy. Since cisplatin has been reported to promote the recruitment and proliferation of immune effector cells [52], this association could be explained by cisplatin-stimulated proliferation of these cells which ultimately could result in a more effective antitumor response.
MATERIALS AND METHODS
Patients and samples
The human biological material used in this publication was provided by Biobank@UZA (Antwerp, Belgium; ID: BE71030031000; Belgian Virtual Tumorbank funded by the National Cancer Plan). Five ascites fluid samples and six pleural fluid samples were collected from eleven different MPM patients who received first-line chemotherapy (cisplatin + pemetrexed) at least one month before sample collection. Patients’ clinicopathological parameters are detailed in Table 4. There were no significant differences between the parameters of patients with ascites fluids and the ones with pleural fluids. Matched tissue samples were available from four patients and were used for immunohistochemical analysis as described previously [15]. This study has been approved by the Ethics Committee of the Antwerp University Hospital/University of Antwerp (EC 14/39/397).
Table 4: Clinicopathological parameters of the MPM patient population
CHARACTERISTICS |
PLEURAL FLUIDS (n, %) |
ASCITES FLUIDS (n, %) |
P-VALUE |
|---|---|---|---|
Number of samples (N) |
|||
6 |
5 |
||
Age (years) |
0.170 |
||
Median |
66 |
61 |
|
Range |
60–73 |
41-67 |
|
Sex |
0.354 |
||
Male |
6 (100%) |
3 (60%) |
|
Female |
0 |
2 (40%) |
|
Histological subtype |
0.240 |
||
Epitheloid |
3 (50%) |
4 (80%) |
|
Sarcomatoid |
2 (33%) |
0 |
|
No data |
1 (17%) |
1 (20%) |
|
Smoker |
1.000 |
||
No |
4 (67%) |
1 (20%) |
|
Yes |
2 (33%) |
3 (60%) |
|
No data |
0 |
1 (20%) |
|
Professional asbestos exposure |
/ |
||
No |
0 |
0 |
|
Yes |
5 (83%) |
3 (60%) |
|
No data |
1 (17%) |
2 (40%) |
|
Survival |
0.097 |
||
Alive |
4 (67%) |
0 |
|
Dead |
2 (33%) |
5 (100%) |
|
Laterality |
1.000 |
||
Left |
2 (33%) |
2 (40%) |
|
Right |
4 (67%) |
3 (60%) |
|
Stage |
0.168 |
||
I–II |
3 (50%) |
0 |
|
III–IV |
2 (33%) |
5 (100%) |
|
No data |
1 (17%) |
0 |
|
Hemoglobin (g/dL) |
1.000 |
||
< 14.6 (low) |
4 (67%) |
4 (80%) |
|
≥ 14.6 (high) |
2 (33%) |
1 (20%) |
|
White blood cell count (×103 cells/ μL) |
/ |
||
< 15.5 (low) |
6 (100%) |
5 (100%) |
|
≥ 15.5 (high) |
0 |
0 |
|
Platelet count |
1.000 |
||
< 400 (low) |
4 (67%) |
4 (80%) |
|
≥ 400 (high) |
2 (33%) |
1 (20%) |
|
Neutrophil/lymphocyte ratio |
0.662 |
||
< median♦ |
3 (50%) |
2 (40%) |
|
≥ median♦ |
3 (50%) |
3 (60%) |
♦median of pleural fluids = 34.5; median of ascites fluids = 62.0.
Sample collection
Fluid samples, obtained from patients as a standard procedure for symptomatic relief, were collected via paracentesis (ascites) or thoracocentesis (pleura) in sterile tubes and filtered through a cell strainer before centrifugation. A Ficoll-Paque PlusTM (GE Healthcare Life Sciences, Belgium) density gradient centrifugation at 2100 rpm for 20 minutes was performed to collect the immune cells (peripheral blood mononuclear cells) and remove the red blood cells. After aspirating the upper layer, the layer with immune cells was transferred to a new sterile FACS tube diluted with phosphate buffered saline (PBS) and centrifuged at 1500 rpm for 5 minutes. Cell pellets were suspended in fetal bovine serum (FBS) supplemented with 10% dimethylsulfoxide (DMSO) and stored at liquid nitrogen until use.
Flow cytometry
Frozen samples were thawed in RPMI 1640 medium supplemented with 10% FBS and 0,5% sodiumpyruvate in a 37°C warm water bath. Cells were counted on an ABX Micros 60 automatic cell counter (Horiba Medical, California, USA). Samples were analyzed for the presence of CD3+CD4+ T cells, CD3+CD8+ T cells, CD3-CD56+ NK cells, CD19+ B cells, CD64+ macrophages, CD11c+CD33+ DCs and PDPN+ tumor cells and for PD-1, PD-L1, TIM-3 and LAG-3 immune checkpoint expression using multicolor flow cytometry. In a first panel, combinations of PD-1-PE (clone MIH4) / LAG-3-PE (clone T47530)/ TIM-3-PE (clone 7D3), CD3-BV510, CD4-APC-H7, CD8-PB, CD69-APC and CD56-FITC (clone B159) conjugated monoclonal antibodies (mAbs) were used. The live/deadÒ red fixable cell stain was added to assess cell viability (Supplementary Figure 1). In a second panel, combinations of PD-L1-PE (clone MIH1), CD19-BV421(clone HIB19), CD64-FITC (clone 10.1), CD11c-PeCy7 (clone B-ly6) and CD303-PeCy7 (clone 201A), CD64-FITC and podoplanin-APC (PDPN, clone NZ-1.3) conjugated mAbs were used. A live/dead aqua fixable cell stain was added to assess cell viability (Supplementary Figure 2). All the antibodies were purchased from Becton Dickinson (BD Biosciencesâ), except for the live/dead stains and the CD8 mAb (Life TechnologiesTM), the CD303 mAb (Biolegendâ, California, USA) and the PDPN mAb (eBioscienceâ, Vienna, Austria). Corresponding species- and isotype-matched antibodies were used as controls. In brief, surface staining with mAbs and live/dead stain was performed for 15 minutes at room temperature, cells were washed (5 min, 1500 rpm) and resuspended in FACS buffer (sheath + 0.1% bovine serum albumine + 0.05% sodiumazide). Samples were acquired with FACSDiva software on a FACSAria II Beckton Dickinson flow cytometer (BD Biosciencesâ). Data were analyzed using FlowJo software (TreeStar inc., Ashland, USA). Results are expressed as ΔMFI (calculated by subtracting MFI values of isotype controls from marker MFI values) and as percentages of marker-positive cells (determined by Overton subtraction of isotype control histograms from marker histograms).
Statistics
Spearman correlation coefficients were calculated to investigate the correlation between: (i) the expression of immune checkpoints and immune cell markers among the different fluid samples; (ii) the expression of immune checkpoints and immune cell markers in tissue samples and their corresponding fluid sample (n = 4); (iii) the expression of immune checkpoints and the activation marker CD69 on different subsets of effusion-resident immune cells. To investigate differences between ascites and pleural fluids, Wilcoxon-rank sum and Fisher exact tests were performed. Patients overall survival was assessed from the date of diagnosis to the date of sample analysis or the date of death. The influence of immunological and clinicopathological parameters on survival was assessed using Cox proportional hazards models. The proportional hazards assumption was tested and could not be rejected for any of the parameters under consideration. Response to chemotherapy was defined using the Response Evaluation Criteria in Solid Tumors (RECIST) [53]. The associations of the subsets of immune cells present in the fluid samples with response to chemotherapy were determined using logistic regression. Variable selection was performed by assessing significance on the 10% level in univariate analyses (p < 0.1). Backward model building was used in the multivariate models for which p-values < 0.05 were considered statistically significant.
CONCLUSIONS
With this study, we show a patient-dependent inter- and intraspecific variation for both the immune cell composition and immune checkpoint expression in pleural versus ascites MPM effusions. Nevertheless, PD-1, PD-L1, TIM-3 and LAG-3 are expressed in the majority of effusion samples, thereby identifying TIM-3 and LAG-3 as potential novel targets in MPM. Our data describe two MPM effusion-related factors with clinical value. The percentage of CD4+ T cells present in the effusions is significantly correlated with response to chemotherapy, while the percentage of PD-L1+ PDPN+ tumor cells can be translated as a significant prognostic factor for worse outcome. The results of this study provide more insight in the cellular composition of MPM effusions and support further elaborate research on MPM effusions for the identification of biomarkers and the development of immune checkpoint-targeted immunotherapy.
Abbreviations
CD: Cluster of differentiation; CTLA-4: Cytotoxic T lymphocyte antigen-4; DC: Dendritic cell; DMSO: Dimethylsulfoxide; FBS : Fetal bovine serum; FDA: Food and drug administration; LAG-3: Lymphocyte activation gene-3; mAb: Monoclonal antibody; MFI: Mean fluorescence intensity; MPM: Malignant pleural mesothelioma; NK: Natural killer; PBS: Phosphate buffered saline; PD-1: Programmed death-1; PD-L1: Programmed death-ligand 1; PDPN: Podoplanin; RECIST: Response evaluation criteria in solid tumors; TIM-3: T cell immunoglobulin mucin-3; TME: Tumor microenvironment.
Author contributions
EM designed and performed experiments, analyzed data and wrote the manuscript. ES designed experiments and revised manuscript. ES, PP and JvM supervised research and drafted paper. JVA and JDW assisted with experiments, contributed to the analysis and interpretation of data. EL, NH and ES contributed to the analysis and interpretation of data. All authors contributed to the final version of the manuscript.
ACKNOWLEDGMENTS
The authors would like to acknowledge the Tumor Biobank from the Department of Pathology at the Antwerp University Hospital for providing MPM patient samples. They also want to express their gratitude to Dr. Paul Van Schil from the Department of Thoracic and Vascular Surgery at the Antwerp University Hospital for collecting the patient samples.
CONFLICTS OF INTEREST
The authors have no conflicts of interest to declare.
FUNDING
This work was performed with the support of the Belgian Foundation Against Cancer (grant number: FA/2014/263), the Research Foundation Flanders (grant number: 1510215N), AstraZeneca and a Methusalem grant of the University of Antwerp and Hasselt awarded to Prof. Herman Goossens and Prof Geert Molenberghs. E. Marcq is a research fellow of Flanders Innovation & Entrepreneurship (fellowship number: 141433), J. De Waele and J. Van Audenaerde of the Research Foundation Flanders (fellowship numbers: 1121016N and 1S32316N).
REFERENCES
1. Robinson BW, Musk AW, Lake RA. Malignant mesothelioma. Lancet. 2005; 366:397–408. https://doi.org/10.1016/S0140-6736(05)67025-0.
2. Stayner L, Welch LS, Lemen R. The worldwide pandemic of asbestos-related diseases. Annu Rev Public Health. 2013; 34:205–16. https://doi.org/10.1146/annurev-publhealth-031811-124704.
3. Robinson BW, Lake RA. Advances in malignant mesothelioma. N Engl J Med. 2005; 353:1591–603. https://doi.org/10.1056/NEJMra050152.
4. van Meerbeeck JP, Gaafar R, Manegold C, Van Klaveren RJ, Van Marck EA, Vincent M, Legrand C, Bottomley A, Debruyne C, Giaccone G. Randomized phase III study of cisplatin with or without raltitrexed in patients with malignant pleural mesothelioma: an intergroup study of the European Organisation for Research and Treatment of Cancer Lung Cancer Group and the National Cancer Institute of Canada. J Clin Oncol. 2005; 23:6881–9. https://doi.org/10.1200/JCO.20005.14.589.
5. Vogelzang NJ, Rusthoven JJ, Symanowski J, Denham C, Kaukel E, Ruffie P, Gatzemeier U, Boyer M, Emri S, Manegold C, Niyikiza C, Paoletti P. Phase III study of pemetrexed in combination with cisplatin versus cisplatin alone in patients with malignant pleural mesothelioma. J Clin Oncol. 2003; 21:2636–44. https://doi.org/10.1200/JCO.2003.11.136.
6. Bagia M, Nowak AK. Novel targeted therapies and vaccination strategies for mesothelioma. Curr Treat Options Oncol. 2011; 12:149–62. https://doi.org/10.1007/s11864-011-0149-1.
7. Izzi V, Masuelli L, Tresoldi I, Foti C, Modesti A, Bei R. Immunity and malignant mesothelioma: from mesothelial cell damage to tumor development and immune response-based therapies. Cancer Lett. 2012; 322:18–34. https://doi.org/10.1016/j.canlet.2012.02.034.
8. Cornelissen R, Heuvers ME, Maat AP, Hendriks RW, Hoogsteden HC, Aerts JG, Hegmans JP. New roads open up for implementing immunotherapy in mesothelioma. Clin Dev Immunol. 2012; 2012:927240. https://doi.org/10.1155/2012/927240.
9. Alley EW, Lopez J, Santoro A, Morosky A, Saraf S, Piperdi B, van Brummelen E. Clinical safety and activity of pembrolizumab in patients with malignant pleural mesothelioma (KEYNOTE-028): preliminary results from a non-randomised, open-label, phase 1b trial. Lancet Oncol. 2017. https://doi.org/10.1016/S1470-2045(17)30169-9.
10. Calabro L, Morra A, Fonsatti E, Cutaia O, Amato G, Giannarelli D, Di Giacomo AM, Danielli R, Altomonte M, Mutti L, Maio M. Tremelimumab for patients with chemotherapy-resistant advanced malignant mesothelioma: an open-label, single-arm, phase 2 trial. Lancet Oncol. 2013; 14:1104–11. https://doi.org/10.1016/S1470-2045(13)70381-4.
11. Calabro L, Morra A, Fonsatti E, Cuataia O, Fazio C, Danielli R, Giannarelli D, Altomonte M, Di Giacomo AM, Maio M. A phase 2 single-arm study with tremelimumab at an optimized doseing schedule in second-line mesothelioma patients. J ClinOncol. 2014 32:5s.
12. Hassan R, Thomas A, Patel MR, Nemunaitis JJ, Bennouana J, Powderly JD, Taylor MH, Dowlati A, Chen F, Leach J, Vaishampayan UN, Verschraegen CF, Delord JP, et al. Avelumab (MSB0010718C; anti-PD-L1) in patients with advanced unresectable mesothelioma from the JAVELIN solid tumor phase Ib trial: Safety, clinical activity, and PD-L1 expression. J Clin Oncol. 2016; 34.
13. Janssen JQ, Zago G, Schouten R, Buikhuisen W, Monkhorst K, Thunissen E, Baas P. A phase II study of Nivolumab in malignant pleural mesothelioma (NIVOMES): with translational research (TR) biopsies. J Thor Oncol. 2017; 12:S292–293. http://dx.doi.org/10.1016/j.jtho.2016.11.300.
14. Maio M, Scherpereel A, Di Pietro A, Vasey P, Tsao AS, Calabrï L, Fu D, Robbins PB, Ibrahim RA, Kindler HL. Randomized, double-blind, placebo-controlled study of tremelimumab for second and third-line treatment of unresectable pleural or peritoneal mesothelioma. J Clin Oncol. 2014; 32;5s.
15. Marcq E, Siozopoulou V, De Waele J, van Audenaerde J, Zwaenepoel K, Santermans E, Hens N, Pauwels P, van Meerbeeck JP, Smits EL. Prognostic and predictive aspects of the tumor immune microenvironment and immune checkpoints in malignant pleural mesothelioma. Oncoimmunology. 2017; 6:e1261241. https://doi.org/10.1080/2162402X.2016.1261241.
16. Stathopoulos GT, Kalomenidis I. Malignant pleural effusion: tumor-host interactions unleashed. Am J Respir Crit Care Med. 2012; 186:487–92. https://doi.org/10.1164/rccm.201203-0465PP.
17. Chene AL, d’Almeida S, Blondy T, Tabiasco J, Deshayes S, Fonteneau JF, Cellerin L, Delneste Y, Gregoire M, Blanquart C. Pleural Effusions from Patients with Mesothelioma Induce Recruitment of Monocytes and Their Differentiation into M2 Macrophages. J Thorac Oncol. 2016; 11:1765–73. https://doi.org/10.1016/j.jtho.2016.06.022.
18. Khanna S, Thomas A, Abate-Daga D, Zhang J, Morrow B, Steinberg SM, Orlandi A, Ferroni P, Schlom J, Guadagni F, Hassan R. Malignant Mesothelioma Effusions Are Infiltrated by CD3+ T Cells Highly Expressing PD-L1 and the PD-L1+ Tumor Cells within These Effusions Are Susceptible to ADCC by the Anti-PD-L1 Antibody Avelumab. J Thorac Oncol. 2016; 11:1993–2005. https://doi.org/10.1016/j.jtho.2016.07.033.
19. Lievense LA, Cornelissen R, Bezemer K, Kaijen-Lambers ME, Hegmans JP, Aerts JG. Pleural Effusion of Patients with Malignant Mesothelioma Induces Macrophage-Mediated T Cell Suppression. J Thorac Oncol. 2016; 11:1755–64. https://doi.org/10.1016/j.jtho.2016.06.021.
20. Scherpereel A, Grigoriu BD, Noppen M, Gey T, Chahine B, Baldacci S, Trauet J, Copin MC, Dessaint JP, Porte H, Labalette M. Defect in recruiting effector memory CD8+ T-cells in malignant pleural effusions compared to normal pleural fluid. BMC Cancer. 2013; 13:324. https://doi.org/10.1186/1471-2407-13-324.
21. Goldberg MV, Drake CG. LAG-3 in Cancer Immunotherapy. Curr Top Microbiol Immunol. 2011; 344:269–78. https://doi.org/10.1007/82_2010_114.
22. Macon-Lemaitre L, Triebel F. The negative regulatory function of the lymphocyte-activation gene-3 co-receptor (CD223) on human T cells. Immunology. 2005; 115:170–8. https://doi.org/10.1111/j.1365-2567.2005.02145.x.
23. Workman CJ, Vignali DA. Negative regulation of T cell homeostasis by lymphocyte activation gene-3 (CD223). J Immunol. 2005; 174:688–95. https://doi.org/10.4049/jimmunol.174.2.688.
24. Ngiow SF, von Scheidt B, Akiba H, Yagita H, Teng MW, Smyth MJ. Anti-TIM3 antibody promotes T cell IFN-gamma-mediated antitumor immunity and suppresses established tumors. Cancer Res. 2011; 71:3540–51. https://doi.org/10.1158/0008-5472.CAN-11-0096.
25. Fourcade J, Kudela P, Andrade Filho PA, Janjic B, Land SR, Sander C, Krieg A, Donnenberg A, Shen H, Kirkwood JM, Zarour HM. Immunization with analog peptide in combination with CpG and montanide expands tumor antigen-specific CD8+ T cells in melanoma patients. J Immunother. 2008; 31:781–91. https://doi.org/10.1097/CJI.0b013e318183af0b.
26. Monney L, Sabatos CA, Gaglia JL, Ryu A, Waldner H, Chernova T, Manning S, Greenfield EA, Coyle AJ, Sobel RA, Freeman GJ, Kuchroo VK. Th1-specific cell surface protein Tim-3 regulates macrophage activation and severity of an autoimmune disease. Nature. 2002; 415:536–41. https://doi.org/10.1038/415536a.
27. Anderson AC, Anderson DE, Bregoli L, Hastings WD, Kassam N, Lei C, Chandwaskar R, Karman J, Su EW, Hirashima M, Bruce JN, Kane LP, Kuchroo VK, et al. Promotion of tissue inflammation by the immune receptor Tim-3 expressed on innate immune cells. Science. 2007; 318:1141–3. https://doi.org/10.1126/science.1148536.
28. Hanna A, Pang Y, Bedrossian CW, Dejmek A, Michael CW. Podoplanin is a useful marker for identifying mesothelioma in malignant effusions. Diagn Cytopathol. 2010; 38:264–9.
29. Kimura N, Kimura I. Podoplanin as a marker for mesothelioma. Pathol Int. 2005; 55:83–6.
30. Yamaki E, Yajima T, Kosaka T, Mogi A, Tanaka S, Kuwano H. Podoplanin overexpression in human mesothelioma cell lines enhances the tumorigenic phenotype. Oncol Rep. 2013; 29:932–40
31. Takeuchi S, Fukuda K, Yamada T, Arai S, Takagi S, Ishii G, Ochiai A, Iwakiri S, Itoi K, Uehara H, Nishihara H, Fujita N, Yano S. Podoplanin promotes progression of malignant pleural mesothelioma by regulating motility and focus formation. Cancer Sci. 2017; 108:696–703.
32. Mansfield AS, Roden AC, Peikert T, Sheinin YM, Harrington SM, Krco CJ, Dong H, Kwon ED. B7-H1 expression in malignant pleural mesothelioma is associated with sarcomatoid histology and poor prognosis. J Thorac Oncol. 2014; 9:1036–40. https://doi.org/10.1097/JTO.0000000000000177.
33. Cedres S, Ponce-Aix S, Zugazagoitia J, Sansano I, Enguita A, Navarro-Mendivil A, Martinez-Marti A, Martinez P, Felip E. Analysis of expression of programmed cell death 1 ligand 1 (PD-L1) in malignant pleural mesothelioma (MPM). PLoS One. 2015; 10: e0121071. https://doi.org/10.1371/journal.pone.0121071.
34. Miyoshi S, Sasada S, Izumo T, Matsumoto Y, Tsuchida T. Diagnostic Utility of Pleural Fluid Cell Block versus Pleural Biopsy Collected by Flex-Rigid Pleuroscopy for Malignant Pleural Disease: A Single Center Retrospective Analysis. PLoS One. 2016; 11: e0167186. https://doi.org/10.1371/journal.pone.0167186.
35. Currie AJ, Prosser A, McDonnell A, Cleaver AL, Robinson BW, Freeman GJ, van der Most RG. Dual control of antitumor CD8 T cells through the programmed death-1/programmed death-ligand 1 pathway and immunosuppressive CD4 T cells: regulation and counterregulation. J Immunol. 2009; 183:7898–908. https://doi.org/10.4049/jimmunol.0901060.
36. Yamada N, Oizumi S, Kikuchi E, Shinagawa N, Konishi-Sakakibara J, Ishimine A, Aoe K, Gemba K, Kishimoto T, Torigoe T, Nishimura M. CD8+ tumor-infiltrating lymphocytes predict favorable prognosis in malignant pleural mesothelioma after resection. Cancer Immunol Immunother. 2010; 59:1543–9. https://doi.org/10.1007/s00262-010-0881-6.
37. Hino R, Kabashima K, Kato Y, Yagi H, Nakamura M, Honjo T, Okazaki T, Tokura Y. Tumor cell expression of programmed cell death-1 ligand 1 is a prognostic factor for malignant melanoma. Cancer. 2010; 116:1757–66. https://doi.org/10.1002/cncr.24899.
38. Hamanishi J, Mandai M, Iwasaki M, Okazaki T, Tanaka Y, Yamaguchi K, Higuchi T, Yagi H, Takakura K, Minato N, Honjo T, Fujii S. Programmed cell death 1 ligand 1 and tumor-infiltrating CD8+ T lymphocytes are prognostic factors of human ovarian cancer. Proc Natl Acad Sci USA. 2007; 104:3360–5. https://doi.org/10.1073/pnas.0611533104.
39. Thompson RH, Kuntz SM, Leibovich BC, Dong H, Lohse CM, Webster WS, Sengupta S, Frank I, Parker AS, Zincke H, Blute ML, Sebo TJ, Cheville JC, et al. Tumor B7-H1 is associated with poor prognosis in renal cell carcinoma patients with long-term follow-up. Cancer Res. 2006; 66:3381–5.
40. Marcq E, Pauwels P, van Meerbeeck JP, Smits EL. Targeting immune checkpoints: New opportunity for mesothelioma treatment? Cancer Treat Rev. 2015; 41:914–24. https://doi.org/10.1016/j.ctrv.2015.09.006.
41. Vogelzang NJ, Schultz SM, Iannucci AM, Kennedy BJ. Malignant mesothelioma. The University of Minnesota experience. Cancer. 1984; 53:377–83.
42. Baixeras E, Huard B, Miossec C, Jitsukawa S, Martin M, Hercend T, Auffray C, Triebel F, Piatier-Tonneau D. Characterization of the lymphocyte activation gene 3-encoded protein. A new ligand for human leukocyte antigen class II antigens. J Exp Med. 1992; 176:327–37. https://doi.org/10.1084/jem.176.2.327.
43. Workman CJ, Vignali DA. The CD4-related molecule, LAG-3 (CD223), regulates the expansion of activated T cells. Eur J Immunol. 2003; 33:970–9. https://doi.org/10.1002/eji.200323382.
44. Gleason MK, Lenvik TR, McCullar V, Felices M, O’Brien MS, Cooley SA, Verneris MR, Cichocki F, Holman CJ, Panoskaltsis-Mortari A, Niki T, Hirashima M, Blazar BR, et al. Tim-3 is an inducible human natural killer cell receptor that enhances interferon gamma production in response to galectin-9. Blood. 2012; 119:3064–72. https://doi.org/10.1182/blood-2011-06-360321.
45. Psallidas I, Kalomenidis I, Porcel JM, Robinson BW, Stathopoulos GT. Malignant pleural effusion: from bench to bedside. Eur Respir Rev. 2016; 25:189–98. https://doi.org/10.1183/16000617.0019-2016.
46. Lievense LA, Bezemer K, Cornelissen R, Kaijen-Lambers ME, Hegmans JP, Aerts JG. Precision immunotherapy; dynamics in the cellular profile of pleural effusions in malignant mesothelioma patients. Lung Cancer. 2017; 107:36–40. https://doi.org/10.1016/j.lungcan.2016.04.015.
47. Zhu J, Paul WE. CD4 T cells: fates, functions, and faults. Blood. 2008; 112:1557–69. https://doi.org/10.1182/blood-2008-05-078154.
48. Neurath MF, Finotto S. The emerging role of T cell cytokines in non-small cell lung cancer. Cytokine Growth Factor Rev. 2012; 23:315–22. https://doi.org/10.1016/j.cytogfr.2012.08.009.
49. Friedman KM, Prieto PA, Devillier LE, Gross CA, Yang JC, Wunderlich JR, Rosenberg SA, Dudley ME. Tumor-specific CD4+ melanoma tumor-infiltrating lymphocytes. J Immunother. 2012; 35:400–8. https://doi.org/10.1097/CJI.0b013e31825898c5.
50. Francisco LM, Sage PT, Sharpe AH. The PD-1 pathway in tolerance and autoimmunity. Immunol Rev. 2010; 236: 219–42. https://doi.org/10.1111/j.1600-065X.2010.00923.x.
51. Hemon P, Jean-Louis F, Ramgolam K, Brignone C, Viguier M, Bachelez H, Triebel F, Charron D, Aoudjit F, Al-Daccak R, Michel L. MHC class II engagement by its ligand LAG-3 (CD223) contributes to melanoma resistance to apoptosis. J Immunol. 2011; 186:5173–83. https://doi.org/10.4049/jimmunol.1002050.
52. de Biasi AR, Villena-Vargas J, Adusumilli PS. Cisplatin-induced antitumor immunomodulation: a review of preclinical and clinical evidence. Clin Cancer Res. 2014; 20:5384–91. https://doi.org/10.1158/1078-0432.CCR-14-1298.
53. Hoos A, Eggermont AM, Janetzki S, Hodi FS, Ibrahim R, Anderson A, Humphrey R, Blumenstein B, Old L, Wolchok J. Improved endpoints for cancer immunotherapy trials. J Natl Cancer Inst. 2010; 102:1388–97. https://doi.org/10.1093/jnci/djq310.