
INTRODUCTION
Hepatocellular carcinoma (HCC) is currently the sixth most frequent type of cancer with a high mortality and an increasing occurrence worldwide [1]. A huge variation in the incidence of HCC was observed across different geographic regions, with the highest rates in Southeast Asia and Sub-Saharan Africa [2]. Although a majority of HCC (approximately 70–90%) occurs in patients with underlying chronic liver diseases [3], hepatocarcinogenesis is a complex process that is attributed to multiple risk parameters, including but not limited to exposure of aflatoxin B, chronic infection with hepatitis B virus (HBV) or hepatitis C virus (HCV), excessive consumption of alcohol and tobacco, iron overload, and diabetes [4, 5]. Currently, mounting evidence has demonstrated that single-nucleotide polymorphisms (SNPs) are correlated with the development and progression of liver cancer separately or in combination with well-documented risk factors in defined ethnic groups [6–8]. These data pinpoint a key role for genetic polymorphisms that affect oxidative stress, DNA repair, iron metabolism, cell signaling, inflammatory and immune responses in the susceptibility to liver neoplasms and partly account for the global heterogeneous incidence of HCC.
Melatonin (N-acetyl-5-methoxytrypamine), originally isolated as a neurohormone of the pineal grand [9], is synthesized in a myriad of tissue types, including the liver [10]. In the pineal gland, its production is regulated by light and dark cycle, whereby light suppresses and darkness enhances its synthesis. Melatonin controls various biological activities, among which regulation of the phasing of circadian rhythms and sleep promotion are most widely recognized [11]. In addition, this multitasking hormone is known to function as not only a substantial immunomodulatory compound [12] but also a potent free radical scavenger [13]. By virtue of these multiple actions, numerous lines of evidence have linked the perturbation of melatonin signaling to a large number of physiological and pathological conditions including aging, metabolic syndrome, diabetes, immune diseases, hypertension, several mood and cognitive disorders, and cancer [14, 15]. Under both in vitro and in vivo circumstances, melatonin, employing multiple and interrelated mechanisms, exhibits many oncostatic properties in a variety of tumors during different stages of cancer progression [16–19]. As such, the use of melatonin has emerged as another appealing option for anti-cancer treatment [20].
The broad spectrum of melatonin’s actions are in part mediated by G protein-coupled membrane receptors, melatonin receptor 1A (MT1, encoded by MTNR1A) and 1B (MT2, MTNR1B), expressed in both the central nervous system and in numerous peripheral tissues [11]. Genetic associations of MTNR1A and MTNR1B with several conditions have been documented. Polymorphisms within the MTNR1B gene confer a genetic predisposition to type 2 diabetes [21–23], gestational diabetes [24] and adolescent idiopathic scoliosis [25]. Another study has implicated MTNR1A gene variations as a risk component in polycystic ovary syndrome [26]. However, little is known regarding the melatonin receptor gene polymorphisms on the susceptibility to HCC. Here, we performed a hypothesis-driven case-control study to evaluate the impact of gene variations of MTNR1A and MTNR1B on the risk and progression of HCC and observed an association of melatonin receptor gene polymorphisms with the risk of HCC, liver cancer metastasis, and augmented liver damage.
RESULTS
Characteristics of study participants
Since age, gender, alcohol consumption, and tobacco use were identified as risk factors for occurrence of liver cancer [27, 28], the demographic parameters between 335 patients with HCC and 1196 normal controls were compared (Table 1). The ratio of males to females in the control group was compatible (p = 0.577) with that of HCC patients. The average age of patients at onset of HCC in this study is 62.8 ± 11.7. No significant difference in the distribution of smoking (p = 0.740) was achieved between healthy control subjects and HCC patients; however, infections with HBV or HCV and alcohol consumption were found to leverage the risk of developing HCC.
Table 1: The distributions of demographical characteristics in 1196 controls and 335 patients with HCC
Variable |
Controls (N = 1196) |
Patients (N = 335) |
p value |
|---|---|---|---|
Age (yrs) |
Mean ± S.D. |
Mean ± S.D. |
|
59.42 ± 7.08 |
62.76 ± 11.68 |
p < 0.001* |
|
Gender |
|||
No |
358 (29.9%) |
95 (28.4%) |
p = 0.577 |
Yes |
838 (70.1%) |
240 (71.6%) |
|
Cigarette smoking |
|||
No |
726 (60.7%) |
200 (59.7%) |
p = 0.740 |
Yes |
470 (39.3%) |
135 (40.3%) |
|
Alcohol drinking |
|||
No |
1027 (85.9%) |
211 (63.0%) |
p < 0.001* |
Yes |
169 (14.1%) |
124 (37.0%) |
|
HBsAg |
|||
Negative |
1050 (87.8%) |
195 (58.2%) |
p < 0.001* |
Positive |
146 (12.2%) |
140 (41.8%) |
|
Anti-HCV |
|||
Negative |
1143 (95.6%) |
181 (54.0%) |
p < 0.001* |
Positive |
53 (4.4%) |
154 (46.0%) |
|
Stage |
|||
I+II |
223 (66.6%) |
||
III+IV |
112 (33.4%) |
||
Tumor T status |
|||
T1+T2 |
225 (67.2%) |
||
T3+T4 |
110 (32.8%) |
||
Lymph node status |
|||
N0 |
326 (97.3%) |
||
N1+N2+N3 |
9 (2.7%) |
||
Metastasis |
|||
M0 |
319 (95.2%) |
||
M1 |
16 (4.8%) |
||
Child-Pugh grade |
|||
0 or A |
260 77.6%) |
||
B or C |
75 (22.4%) |
||
Liver cirrhosis |
|||
Negative |
61 (18.2%) |
||
Positive |
274 (81.8%) |
Mann-Whitney U test or Fisher’s exact test was used between healthy controls and patients with oral cancer. *p value < 0.05 as statistically significant.
Child-Pugh grade: 0 or A: scores < 7; B: scores = 7–9; C: scores > 9.
Association of melatonin receptor gene polymorphisms with HCC
Many oncostatic properties of melatonin have been demonstrated in different stages of cancer development [17, 18, 29], yet a correlation of melatonin receptor gene polymorphisms with the risk and progression of liver cancer remains undefined. To address this, five MTNR1A SNPs (rs13140012, rs6553010, rs2119882, rs13113549, and rs2375801) as well as five MTNR1B SNPs (rs1387153, rs1562444, rs4611171, rs10765576, and rs10830963) were evaluated in this investigation. Genotype frequencies of these gene polymorphisms and their association with the susceptibility to liver cancer are shown in Table 2. No deviation (p > 0.05) from Hardy-Weinberg equilibrium in either study group was achieved for all SNPs. To lower the potential interference of other confounders, AOR (with 95 % CI), which was assessed by multiple logistic regression models after adjustment for age and alcohol use, was used together with OR (with 95 % CI) in each comparison. Among the gene polymorphisms tested, homozygotes (GG) for the minor allele of MTNR1A rs6553010 were marginally more prone to develop HCC with the OR being 1.445 (95% CI, 0.980–2.132; p = 0.063). While adjusted for age and alcohol use, a significant association of the homozygous phenotype (GG) for the minor allele of rs6553010 with the predisposition to HCC (AOR, 1.587; 95% CI, 1.053–2.389; p = 0.027) was detected. Nevertheless, no difference in genotype frequencies for the other variants of MTNR1A-MTNR1B gene individually between the two cohorts was observed.
Table 2: Genotyping and allele frequency of MTNR1A-MTNR1B single nucleotide polymorphism (SNP) in HCC and normal controls
Variable |
Controls N = 1196 (%) |
Patients N = 335 (%) |
OR (95% CI) |
AOR (95% CI) |
|---|---|---|---|---|
rs13140012 |
||||
AA |
490 (41.0%) |
130 (38.8%) |
1.000 (reference) |
1.000 (reference) |
AT |
557 (46.6%) |
164 (49.0%) |
1.110 (0.856–1.440) |
1.099 (0.837–1.444) |
TT |
149 (12.4%) |
41 (12.2%) |
1.037 (0.698–1.541) |
1.087 (0.719–1.645) |
rs6553010 |
||||
AA |
553 (46.2%) |
140 (41.8%) |
1.000 (reference) |
1.000 (reference) |
AG |
520 (43.5%) |
150 (44.8%) |
1.139 (0.879–1.477) |
1.191 (0.907–1.564) |
GG |
123 (10.3%) |
45 (13.4%) |
1.445 (0.980–2.132) |
1.587 (1.053–2.389)* |
rs2119882 |
||||
TT |
482 (40.3%) |
138 (41.2%) |
1.000 (reference) |
1.000 (reference) |
TC |
570 (47.7%) |
158 (47.2%) |
0.968 (0.748–1.254) |
0.960 (0.732–1.260) |
CC |
144 (12.0%) |
39 (11.6%) |
0.946 (0.633–1.413) |
1.070 (0.704–1.626) |
rs13113549 |
||||
GG |
475 (39.7%) |
133 (39.7%) |
1.000 (reference) |
1.000 (reference) |
GA |
566 (47.3%) |
162 (48.4%) |
1.022 (0.788–1.325) |
1.014 (0.772–1.331) |
AA |
155 (13.0%) |
40 (11.9%) |
0.922 (0.620–1.371) |
0.961 (0.634–1.455) |
rs2375801 |
||||
AA |
401 (33.5%) |
110 (32.8%) |
1.000 (reference) |
1.000 (reference) |
AG |
603 (50.4%) |
171 (51.0%) |
1.034 (0.788–1.355) |
1.057 (0.795–1.404) |
GG |
192 (16.1%) |
54 (16.2%) |
1.025 (0.709–1.482) |
1.111 (0.755–1.636) |
rs1387153 |
||||
CC |
342 (28.6%) |
98 (29.3%) |
1.000 (reference) |
1.000 (reference) |
CT |
601 (50.3%) |
160 (47.8%) |
0.929 (0.699–1.235) |
0.877 (0.650–1.182) |
TT |
253 (21.1%) |
77 (22.9%) |
1.062 (0.756–1.492) |
1.034 (0.724–1.476) |
rs1562444 |
||||
AA |
570 (47.7%) |
156 (46.6%) |
1.000 (reference) |
1.000 (reference) |
AG |
512 (42.8%) |
146 (43.6%) |
1.042 (0.807–1.345) |
1.046 (0.800–1.367) |
GG |
114 (9.5%) |
33 (9.8%) |
1.058 (0.691–1.620) |
1.078 (0.691–1.681) |
rs4611171 |
||||
GG |
578 (48.3%) |
160 (47.8%) |
1.000 (reference) |
1.000 (reference) |
GT |
501 (41.9%) |
146 (43.3%) |
1.046 (0.811–1.349) |
1.049 (0.803–1.371) |
TT |
117 (9.8%) |
30 (8.9%) |
0.926 (0.598–1.435) |
0.935 (0.592–1.475) |
rs10765576 |
||||
GG |
579 (48.4%) |
166 (49.6%) |
1.000 (reference) |
1.000 (reference) |
GA |
511 (42.7%) |
136 (40.6%) |
0.928 (0.719–1.199) |
0.934 (0.714–1.222) |
AA |
106 (8.9%) |
33 (9.8%) |
1.086 (0.708–1.664) |
1.081 (0.692–1.690) |
rs10830963 |
||||
CC |
360 (30.1%) |
103 (30.8%) |
1.000 (reference) |
1.000 (reference) |
CG |
611 (51.1%) |
162 (48.4%) |
0.927 (0.701–1.225) |
0.838 (0.625–1.123) |
GG |
225 (18.8%) |
70 (20.8%) |
1.087 (0.769–1.537) |
1.045 (0.727–1.502) |
The adjusted odds ratios (AORs) with their 95% confidence intervals (CIs) were estimated by multiple logistic regression models after controlling for age and alcohol drinking. *p < 0.05 was considered statistically significant.
Correlation between polymorphic genotypes of MTNR1A-MTNR1B and clinical status of HCC
Since rs6553010 is associated with the risk of HCC, the correlations of the melatonin receptor gene polymorphisms with clinicopathologic characteristics of HCC patients were further explored. We found that instead of rs6553010, patients who carry at least one polymorphic allele (heterozygote or homozygote for the minor allele) of MTNR1A rs2119882 (Table 3) or rs2375801 (Table 4) were more inclined to develop distant metastasis (OR, 5.202; 95% CI, 1.163–23.270; p = 0.031, and OR, 7.782; 95% CI, 1.015–59.663; p = 0.048, for rs2119882 and rs2375801, respectively). However, none of MTNR1B SNPs examined was found to be individually associated with clinical stage, tumor size, lymph node metastasis, distant metastasis, vascular invasion, Child-Pugh classification, prevalence of hepatitis B virus (HBV) and hepatitis C virus (HCV) infections, and cirrhosis.
Table 3: Odds ratio (OR) and 95% confidence interval (CI) of clinical status and MTNR1A rs2119882 genotypic frequencies in 335 HCC patients
Variable |
Genotypic frequencies |
|||
|---|---|---|---|---|
TT (N = 138) |
TC+CC (N = 197) |
OR (95% CI) |
p value |
|
Clinical Stage |
||||
Stage I/II |
88 (63.8%) |
135 (68.5%) |
1.00 |
p = 0.364 |
Stage III/IV |
50 (36.2%) |
62 (31.5%) |
0.808 (0.511–1.279) |
|
Tumor size |
||||
≤ T2 |
89 (67.7%) |
136 (69.0%) |
1.00 |
p = 0.384 |
> T2 |
49 (32.3%) |
61 (31.0%) |
0.815 (0.514–1.292) |
|
Lymph node metastasis |
||||
No |
137 (99.3%) |
189 (95.9%) |
1.00 |
p = 0.099 |
Yes |
1 (0.7%) |
8 (4.1%) |
5.799 (0.717–46.902) |
|
Distant metastasis |
||||
No |
136 (98.6%) |
183 (92.9%) |
1.00 |
p = 0.031* |
Yes |
2 (1.4%) |
14 (7.1%) |
5.202 (1.163–23.270) |
|
Vascular invasion |
||||
No |
110 (79.7%) |
167 (84.8%) |
1.00 |
p = 0.230 |
Yes |
28 (20.3%) |
30 (15.2%) |
0.706 (0.400–1.246) |
|
Child-Pugh grade |
||||
A |
103 (74.6%) |
157 (79.7%) |
1.00 |
p = 0.275 |
B or C |
35 (25.4%) |
40 (20.3%) |
0.750 (0.447–1.258) |
|
HBsAg |
||||
Negative |
83 (60.1%) |
112 (56.9%) |
1.00 |
p = 0.548 |
Positive |
55 (39.9%) |
85 (43.2%) |
1.145 (0.736–1.782) |
|
Anti-HCV |
||||
Negative |
78 (56.5%) |
103 (52.3%) |
1.00 |
p = 0.444 |
Positive |
60 (43.5%) |
94 (47.7%) |
1.186 (0. 766–1.838) |
|
Liver cirrhosis |
||||
Negative |
29 (21.0%) |
32 (16.2%) |
1.00 |
p = 0.267 |
Positive |
109 (79.0%) |
165 (83.8%) |
1.372 (0.785–2.396) |
|
The ORs with analyzed by their 95% CIs were estimated by logistic regression models.
> T2: multiple tumor more than 5 cm or tumor involving a major branch of the portal or hepatic vein(s).
*p value < 0.05 as statistically significant.
Table 4: Odds ratio (OR) and 95% confidence interval (CI) of clinical status and MTNR1A rs2375801 genotypic frequencies in 335 HCC patients
Variable |
Genotypic frequencies |
|||
|---|---|---|---|---|
AA (N = 110) |
AG+GG (N = 225) |
OR (95% CI) |
p value |
|
Clinical Stage |
||||
Stage I/II |
68 (61.8%) |
155 (68.9%) |
1.00 |
p = 0.198 |
Stage III/IV |
42 (38.2%) |
70 (31.1%) |
0.731 (0.454-1.178) |
|
Tumor size |
||||
≤ T2 |
68 (61.8%) |
157 (69.8%) |
1.00 |
p = 0.146 |
> T2 |
42 (38.2%) |
68 (30.2%) |
0.701 (0. 435-1.131) |
|
Lymph node metastasis |
||||
No |
109 (99.1%) |
217 (96.4%) |
1.00 |
p = 0.192 |
Yes |
1 (0.9%) |
8 (3.6%) |
4.018 (0.496-32.539) |
|
Distant metastasis |
||||
No |
109 (99.1%) |
210 (93.3%) |
1.00 |
p = 0.048* |
Yes |
1 (0.9%) |
15 (6.7%) |
7.782 (1.015-59.663) |
|
Vascular invasion |
||||
No |
87 (79.1%) |
190 (84.4%) |
1.00 |
p = 0.225 |
Yes |
23 (20.9%) |
35 (15.6%) |
0.697 (0.389-1.249) |
|
Child-Pugh grade |
||||
A |
85 (77.3%) |
175 (77.8%) |
1.00 |
p = 0.917 |
B or C |
25 (22.7%) |
50 (22.2%) |
0.971 (0.563-1.676) |
|
HBsAg |
||||
Negative |
69 (62.7%) |
126 (56.0%) |
1.00 |
p = 0.242 |
Positive |
41 (37.3%) |
99 (44.0%) |
1.322 (0.828-2.111) |
|
Anti-HCV |
||||
Negative |
61 (55.5%) |
120 (53.3%) |
1.00 |
p = 0.715 |
Positive |
49 (44.5%) |
105 (46.7%) |
1.089 (0.689-1.722) |
|
Liver cirrhosis |
||||
Negative |
27 (24.6%) |
34 (15.1%) |
1.00 |
p = 0.037* |
Positive |
83 (75.4%) |
191 (84.9%) |
1.827 (1.036-3.222) |
|
The ORs with analyzed by their 95% CIs were estimated by logistic regression models.
> T2: multiple tumor more than 5 cm or tumor involving a major branch of the portal or hepatic vein(s).
*p value < 0.05 as statistically significant.
We also investigated the possible association between the melatonin receptor gene polymorphisms and the levels of serological markers of HCC, including α-fetoprotein (AFP), alanine transaminase (ALT), and aspartate transaminase (AST). As a consequence, we found that the serum levels of AST in HCC patients who possess at least one polymorphic allele of MTNR1A rs6553010 were elevated as compared with that from those who are homozygous for the reference allele (Table 5). In addition, the levels of AFP in patients who are positive for the minor allele of MTNR1B rs10830963 (heterozygotes or homozygotes) were higher than that of HCC cases negative for this variant (Table 5).
Table 5: Association of MTNR1A-MTNR1B genotypic frequencies with the HCC laboratory findings
Characteristic |
α-Fetoproteina (ng/mL) |
AST (IU/L) |
ALT (IU/L) |
AST/ALT ratio |
|---|---|---|---|---|
rs13140012 |
||||
AA |
429.0 ± 163.0 |
45.58 ± 4.02 |
44.04 ± 3.38 |
1.19 ± 0.03 |
AT+TT |
722.3 ± 262.0 |
50.39 ± 5.21 |
45.63 ± 4.17 |
1.21 ± 0.03 |
p value |
0.342 |
0.465 |
0.767 |
0.561 |
rs6553010 |
||||
AA |
546.6 ± 239.7 |
41.19 ± 3.13 |
39.77 ± 2.53 |
1.18 ± 0.02 |
AG+GG |
650.6 ± 237.5 |
54.44 ± 5.84 |
49.30 ± 4.73 |
1.22 ± 0.03 |
p value |
0.758 |
0.046* |
0.076 |
0.333 |
rs2119882 |
||||
TT |
288.0 ± 102.7 |
44.23 ± 3.87 |
42.12 ± 3.26 |
1.21 ± 0.03 |
TC+CC |
818.3 ± 275.6 |
51.31 ± 5.26 |
46.94 ± 4.22 |
1.20 ± 0.03 |
p value |
0.072 |
0.279 |
0.366 |
0.769 |
rs13113549 |
||||
GG |
411.1 ± 164.5 |
45.87 ± 4.11 |
43.83 ± 3.46 |
1.21 ± 0.03 |
GA+AA |
730.3 ± 259.0 |
50.14 ± 5.14 |
45.75 ± 4.12 |
1.20 ± 0.03 |
p value |
0.298 |
0.517 |
0.721 |
0.892 |
rs2375801 |
||||
AA |
334.3 ± 124.8 |
43.26 ± 4.03 |
40.25 ± 3.02 |
1.20 ± 0.03 |
AG+GG |
738.4 ± 246.2 |
51.04 ± 4.85 |
47.36 ± 3.98 |
1.20 ± 0.03 |
p value |
0.144 |
0.217 |
0.155 |
0.862 |
rs1387153 |
||||
CC |
480.1 ± 224.0 |
54.69 ± 9.43 |
49.66 ± 6.41 |
1.19 ± 0.04 |
CT+TT |
653.3 ± 219.8 |
45.93 ± 3.11 |
43.10 ± 3.02 |
1.21 ± 0.02 |
p value |
0.581 |
0.378 |
0.355 |
0.683 |
rs1562444 |
||||
AA |
513.6 ± 198.6 |
43.66 ± 2.86 |
40.14 ± 2.61 |
1.23 ± 0.04 |
AG+GG |
684.6 ± 267.6 |
52.76 ± 6.13 |
49.36 ± 4.85 |
1.18 ± 0.02 |
p value |
0.608 |
0.179 |
0.094 |
0.254 |
rs4611171 |
||||
GG |
512.3 ± 195.5 |
43.59 ± 2.83 |
39.83 ± 2.57 |
1.23 ± 0.03 |
GT+TT |
688.4 ± 271.6 |
52.96 ± 6.22 |
49.79 ± 4.92 |
1.18 ± 0.02 |
p value |
0.599 |
0.171 |
0.073 |
0.159 |
rs10765576 |
||||
GG |
504.8 ± 193.6 |
48.33 ± 4.54 |
41.94 ± 2.87 |
1.24 ± 0.04 |
GA+ AA |
697.1 ± 274.0 |
48.55 ± 5.29 |
47.88 ± 4.80 |
1.17 ± 0.02 |
p value |
0.567 |
0.975 |
0.289 |
0.102 |
rs10830963 |
||||
CC |
233.6 ± 89.5 |
55.41 ± 9.24 |
47.05 ± 5.97 |
1.22 ± 0.04 |
CG+GG |
763.9 ± 239.4 |
45.42 ± 3.02 |
44.09 ± 3.13 |
1.19 ± 0.02 |
p value |
0.038* |
0.304 |
0.661 |
0.539 |
Mann-Whitney U test was used between two groups.
a Mean ± S.E.
*p value < 0.05 as statistically significant.
Association of MTNR1A and MTNR1B haplotypes with HCC
The relationship of melatonin receptor gene haplotypes with the risk of developing HCC was also assessed. Two haplotype blocks containing sets of SNPs within the MTNR1A (Figure 1) and MTNR1B gene (Figure 2) were defined by the use of pairwise disequilibrium for SNPs evaluated in this study [30]. The distributions of haplotype frequencies are shown in Tables 6 and 7, with the most frequent haplotype in the controls (GAT for MTNR1A and GGAG for MTNR1B) being chosen as the reference. While adjusted for age and alcohol use, we found that a specific haplotype of MTNR1B (GCGT) was significantly associated with increased susceptibility to HCC (AOR, 2.132; 95% CI, 1.106–4.111; p = 0.024), further suggesting a genetic predisposition of MTNR1B to liver cancer.
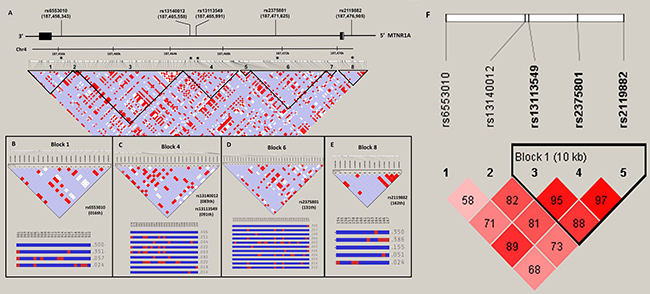
Figure 1: MTNR1A gene structure and linkage disequilibrium map constructed from 167 selected SNP tags. (A) In the LD map, SNP-pairwise correlation coefficients and Hedrick’s multi-allelic D’) in the East Asian population (HCB+JPT, 1000 genome project) are shown in black squares when D’= 1.0 and white squares when D’ = 0. The “Four Gamete” conventional grey scale is used to display the LDs shown in black through grey (the colour intensity decreases with the decrease in the D’ value) generated by Haploviewversion 4.2. SNPs located within and around the MTNR1Agene were plotted against the chromosomal positions Chr.4: 187,454,000 to 187,478,000 (GRCh37.p13, genome assembly). Total 2 exons in this gene (NM_005958.3), the five selected SNPs, rs6553010, rs13140012, rs13113549, rs2375801 and rs2119882. Codon exons, introns and untranslated regions are indicated with filled boxes, thin lines and unfilled boxes from the 3′-to 5′-end of this gene (reverse strain), respectively. The black stars indicate the selected genotyping of the MTNR1ASNP polymorphisms. The five selected SNPs as an alleles of that region with recombination rate plotted and haplotypes display, (B) rs6553010(016th), (C) rs13140012(083th) and rs13113549 (091th) (D) rs2375801 (131th) and (E) rs2119882 (162th), locate on LD map of haplotype block 1, 4, 6 and 8, respectively. (F) Linkage disequilibrium (LD) map for single nucleotide polymorphisms in the MTNR1A gene in this study. Block is pairwise D’ plots and haplotype blocks obtained from HAPLOVIEW.
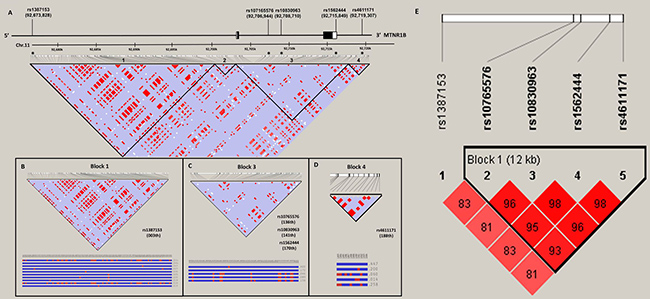
Figure 2: MTNR1B gene structure and linkage disequilibrium map constructed from 194 selected SNP tags. (A) In the LD map, SNP-pairwise correlation coefficients and Hedrick’s multi-allelic D’) in the East Asian population (HCB+JPT, 1000 genome project) are shown in black squares when D’ = 1.0 and white squares when D’ = 0. The “Four Gamete” conventional grey scale is used to display the LDs shown in black through grey (the colour intensity decreases with the decrease in the D’ value) generated by Haploviewversion 4.2. SNPs located within and around the MTNR1Bgene were plotted against the chromosomal positions Chr.11: 92,673,000 to 92,720,000 (GRCh37.p13, genome assembly). Total 2 exons in this gene (NM_005959.3), the five selected SNPs, rs1387153, rs10765576, rs10830963, rs1562444 and rs4611171. Codon exons, introns and untranslated regions are indicated with filled boxes, thin lines and unfilled boxes from the 5′-to 3′-end of this gene, respectively. The black stars indicate the selected genotyping of the MTNR1BSNP polymorphisms. The five selected SNPs as an alleles of that region with recombination rate plotted and haplotypes display, (B) rs1387153 (003th), (C) rs10765576 (136th), rs10830963 (141th) and rs1562444 (170th) and (D) rs4611171 (188th), located on LD map of haplotype block 1, 3 and 4, respectively. (E) Linkage disequilibrium (LD) map for single nucleotide polymorphisms in the MTNR1B gene in this study. Block is pairwise D’ plots and haplotype blocks obtained from HAPLOVIEW.
Table 6: Frequencies of MTNR1A haplotypes in HCC patients and control subjects
Haplotype block |
Controls |
Patients |
AOR (95% CI)a |
||
|---|---|---|---|---|---|
rs13113549 G/A |
rs2375801 A/G |
rs2119882 T/C |
|||
G |
A |
T |
1378 (57.6%) |
384 (57.3%) |
1.000 (reference) |
A |
G |
C |
795 (33.1%) |
214 (31.9%) |
1.000 (0.821–1.218) |
G |
G |
T |
81 (3.4%) |
22 (3.3%) |
1.084 (0.652–1.803) |
A |
G |
T |
59 (2.5%) |
23 (3.4%) |
1.259 (0.741–2.137) |
G |
G |
C |
52 (2.2%) |
20 (3.0%) |
1.543 (0.887–2.683) |
A |
A |
T |
16 (0.7%) |
5 (0.8%) |
1.153 (0.396–3.362) |
G |
A |
C |
5 (0.2%) |
2 (0.3%) |
1.617 (0.282–9.258) |
A |
A |
C |
6 (0.3%) |
0 (0.0%) |
− |
aAdjusting for the effects of age and alcohol drinking.
Table 7: Frequencies of MTNR1B haplotypes in HCC patients and control subjects
Haplotype block |
Controls |
Patients |
AOR (95% CI) a |
|||
|---|---|---|---|---|---|---|
rs10765576 G/A |
rs10830963 C/G |
rs1562444 A/G |
rs4611171 G/T |
|||
G |
G |
A |
G |
1050 (43.9%) |
293 (43.7%) |
1.000 (reference) |
A |
C |
G |
T |
697 (29.1%) |
181 (27.0%) |
0.950 (0.763–1.181) |
G |
C |
A |
G |
577 (24.1%) |
152 (22.7%) |
0.979 (0.777–1.234) |
G |
C |
G |
T |
28 (1.2%) |
17 (2.5%) |
2.132 (1.106–4.111) c |
A |
C |
A |
G |
11 (0.5%) |
5 (0.8%) |
1.674 (0.533–5.257) |
A |
C |
G |
G |
10 (0.4%) |
7 (1.0%) |
2.355 (0.861–6.440) |
A |
G |
A |
G |
5 (0.2%) |
5 (0.8%) |
2.722 (0.697–10.629) |
Othersb |
14 (0.6%) |
10 (1.5%) |
2.283 (0.974–5.349) |
aAdjusting for the effects of age and alcohol drinking.
bOthers: GCGG (7), GGAT (5), GCAT (5), GGGT (3), ACAT (2), and AGGT (2).
cp = 0.024.
Functional analysis of the MTNR1A rs2119882 locus
As a preliminary assessment of the putative functional role of these SNPs, we investigated the possible function of MTNR1A rs2119882. As shown in Figure 3A, rs2119882 is located within the promoter region of MTNR1A gene, which is enriched with the putative binding site of many transcription factors (Figures 3B–3D). Among these transcription factors, levels of GATA2, a GATA-binding protein whose expression has been relevant to the invasion and migration of HCC cells [31], were found to be correlated with MT1 expression in the publicly available microarray datasets and TCGA dataset (Figure 3E–3H). Moreover, as shown in Figure 3I, the results from the TCGA dataset of hepatocellular carcinoma patients indicated that low GATA2 expression was associated with a poor overall survival. These data suggest that MTNR1A variants may alter melatonin receptor 1A expression likely through perturbing the binding of transcription factors to its promoter and subsequently contribute to promotion of not only tumor cell growth but also invasion.
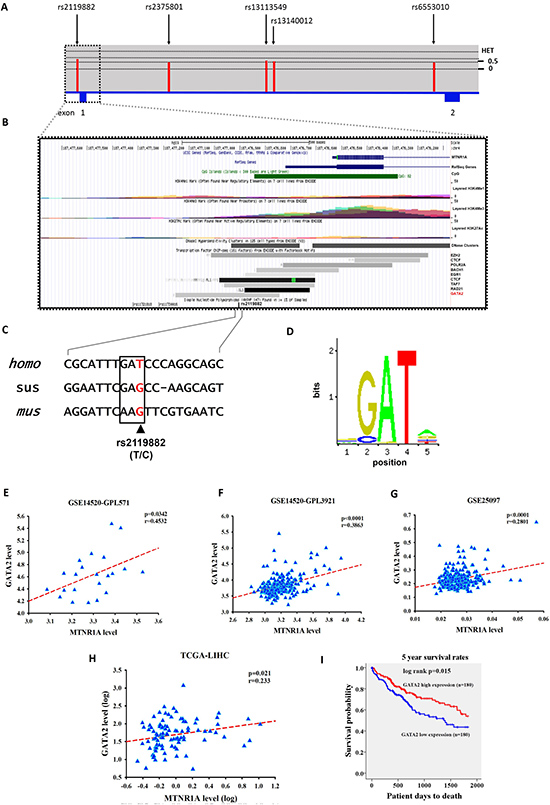
Figure 3: Gene features and SNPs (rs2119882) analyzed of human MTNR1A (NM_005958.4). (A) Exons are revealed by the filled blue and are numbered 1 and 2 from chromosome positions chr4: 187,454, 809 to 187, 476, 537 (GRCh37.p13). The above panel shows population-specific heterozygosity frequencies of the polymorphism in the East Asian population. SNPs were indicated by black arrows and labelled with the SNP ID numbers. (B) Expanded view of ENCODE database for the promoter region containing rs2119882 using UCSC genome browser. The CpG, H3K4Me1, H3K4Me3, and H3K27Ac tracks which are predictive chromatin signatures in the human genome, as determined by the ChIP-seq assays. DNase cluster tracks show DNase hypersensitivity areas. Transcription factors tracks shown the region of transcription factor binding sites derived from a large collection of ChIP-seq experiments performed by ENDCODE project. (C) Upstream sequence in the MTNR1A transcripts of human (homo, NM_005958.4), pig (sus, XM_013985006.1), and mouse (mus, NM_008639.2) sequences shown in this alignment. Consensus residues of GATA2 transcription factor binding sites are above this alignment in box and rs2119882 SNP revealed in color red. (D) DNA motif logo of the GATA2 (MA0036.1) consensus sequence from the JASPAR CORE database. (E) The correlation between GATA2 and MTNR1A expression in the hepatocellular carcinoma specimens in publicly available microarray datasets from the GSE14520-GPL571 project. Pearson’s correlation coefficient = 0.4532; p = 0.0342. (F) The correlation between GATA2 and MTNR1A expression in the hepatocellular carcinoma specimens in publicly available microarray datasets from the GSE14520-GPL3921 project. Pearson’s correlation coefficient = 0.3863; p < 0.0001. (G) The correlation between GATA2 and MTNR1A expression in the hepatocellular carcinoma specimens in publicly available microarray datasets from the GSE25097 project. Pearson’s correlation coefficient = 0.2801; p < 0.0001. (H) The correlation between GATA2 and MTNR1A expression in the hepatocellular carcinoma specimens from The Cancer Genome Atlas (TCGA) Data. Pearson’s correlation coefficient = 0.233; p = 0.021. (I) An overall survival curve was produced for patients with high (red lines) and low (blue lines) GATA2 mRNA expression levels using the Kaplan--Meier method. The p values were determined using a log-rank test.
DISCUSSION
The development of hepatocarcinogenesis is a complex process that is modulated by both environmental and genetic factors. In the present study, we showed that melatonin receptor gene polymorphisms were associated with the increased incidence, metastasis, and hepatocellular damage in HCC, revealing for the first time a genetic predisposition of melatonin receptors to liver cancer.
Manipulation of melatonin signaling has been linked to the regulation of different hallmarks of cancer mainly through activation of MT1 and MT2 [17–19, 29, 32, 33]. Multiple mechanisms have been suggested for the inhibitory effects of melatonin on cancer development and progression. One notable example is its actions on energy metabolism. Melatonin appears to signal via its high-affinity receptors to modulate glucose homeostasis by alterations in insulin release and leptin production [34, 35]. It has been demonstrated that MTNR1B gene polymorphisms are associated with features of metabolic syndrome, including diabetes [21–24]. Some cancer types tend to develop more frequently in patients with diabetes, as the relative risks imparted by diabetes are greatest (about two-fold or higher) for tumors of the liver [36]. In addition, diabetes-related factors including steatosis, nonalcoholic fatty liver disease (NAFLD), and cirrhosis may also enhance susceptibility to liver cancer. In our investigation, we found that a specific haplotype of MTNR1B was significantly associated with increased susceptibility to HCC (Table 7) and that HCC patients who carry the variant allele of MTNR1B SNP (rs10830963) exhibited higher levels of AFP than did cases negative for this variant (Table 5). Other than pancreatic cells, melatonin also modulates energy balance via its direct effects on adipocytes through activation of MT1 [37]. Altered functions of adipose tissue are central to metabolic syndrome and NAFLD as well [38]. A significant association of MTNR1A gene polymorphism (rs2119882) with another comorbidity of metabolic syndrome, polycystic ovary syndrome has been reported [26]. Here, we observed that HCC patients positive for at least one polymorphic allele of MTNR1A rs2119882 (Table 3) or of its linked SNP rs2375801 (Table 4) were more prone to develop distant metastasis. Additionally, a relationship between MTNR1A SNP rs6553010 and increased occurrence of HCC was revealed in the present study (Table 2).
In addition to energy metabolism, two mechanisms implicated in the oncostatic properties of MT1 and MT2 are modulation of cancer cell proliferation/induction of apoptosis and activation of the immune system [33]. The anti-proliferative effects of melatonin on cancer are largely mediated by the activation of MT1 [39–42], but an action of MT2 cannot be excluded [43]. In term of serving as a regulator of the immune system in tumor prevention, both MT1 and MT2 are expressed in a wide variety of immune cells and contribute to inhibition of the formation of virus-induced tumors by eliminating viral infections (HCC is commonly associated with HBV and HCV infection) and identification and destruction of tumor cells that express tumor-specific antigens [44–47]. Specifically, engagement of melatonin with MT1 or MT2 allows induction of cytokine secretion, modulation of lymphocyte functions, restoration of impaired activity of T-helper cells in immune-depressed conditions, promotion of T-lymphocyte proliferation, inhibition of precursor B-cell apoptosis in the bone marrow, and protection of CD4+ T cells from apoptosis. These findings, together with our data suggest that variants of melatonin receptors may alter cancer cell growth and activation of immune responses, elevating the risk for hepatic tumors.
We observed here in a correlation of MTNR1A gene polymorphisms (rs2119882 and rs2375801) with increased risk of distant metastasis in HCC patients (Tables 3 and 4). Cancer metastasis, which accounts for most deaths due to malignancies, is a multistage process that requires cancer cells to escape from the primary site, survive in the circulation, and develop in distant tissues [48]. A broad range of melatonin’s actions on counteracting metastases has been documented [18, 19]. In melanoma and breast cancer, it is demonstrated that the level and function of MT1 were correlated with cancer cell invasion and metastasis [49, 50]. Intriguingly, rs2119882 is located on the putative binding site of many transcription factors within the promoter region of MTNR1A gene. Among these transcription factors, GATA2 expression levels were correlated with MT1 expression in the TCGA dataset. Furthermore, attenuated expression of GATA2 promotes migration and invasion of HCC cells in vitro and be associated with poor prognosis of liver cancer [31]. Peters et al. [51] also reported that GATA2 is involved in clear cell renal cell carcinoma tumor development and aggressiveness. These results suggest that rs2119882 polymorphism may alter the binding affinity of transcription factors to the promoter of MTNR1A gene, leading to changes in MT1 levels and subsequent impacts on tumor metastasis.
Our data identify an impact of MTNR1A/MTNR1B gene variations on the risk and progression of HCC; however, additional work is needed to address several limitations of the present study. One is that the high level of heterogeneity, in term of the severity and subtype of liver cancer or the diversity of HCC-related clinical manifestations, such as diabetes, NAFLD, HBV, and HCV infection, within the case cohort may validly give rise to different conclusions regarding the relationships between melatonin receptor gene polymorphisms and development of HCC. Another weakness is that the effects of acquired risks on the susceptibility of liver cancer may be underestimtated due to a lack of population stratification based on the amount or duration of alcohol use. In addition, the genetic association observed in this study might be restricted to particular ethnic groups unless replication studies are carried out.
Taken together, our results show that SNP rs6553010 of MTNR1A and a particular haplotype of MTNR1B causally contribute to an increased risk of HCC. In addition, an association of MTNR1A gene polymorphisms (rs2119882 and rs2375801) was detected with the occurrence of distant metastasis in HCC. These findings highlight a novel genetic predisposition to liver tumorigenesis.
MATERIALS AND METHODS
Subjects
This study included 335 patients with HCC and 1196 cancer-free controls; it was approved by the institutional review board of Chung Shan Medical University Hospital in Taichung, Taiwan. For the control group, we selected 1196 healthy individuals with no self-reported history of cancer at any site from Taiwan Biobank. The diagnoses of HCC were verified histologically in all cases. HCC patients were staged clinically at the time of diagnosis according to the TNM staging system of the American Joint Committee on Cancer (AJCC) [52]. Liver cirrhosis was diagnosed by liver biopsy, abdominal sonography, or biochemical evidence of liver parenchymal damage with endoscopic esophageal or gastric varices. Clinicopathological parameters, including clinical staging, tumor size, lymph node metastasis, distant metastasis, presence of HBV surface antigen (HBsAg), reactivity with antibody against HCV (anti-HCV), liver cirrhosis, the levels of α-fetoprotein (AFP), aspartate aminotransferase (AST) and alanine aminotransferase (ALT), were obtained from chart reviews. During the same study period, 1196 ethnically matched individuals who have neither diagnosed with HCC nor self-reported history of cancer of any sites were enrolled as controls.
Demographic data
Information regarding age, gender, alcohol consumption, and tobacco use was obtained from each participant. Alcohol consumption is defined as having up to an average of more than 2 drinks per day. Tobacco use is defined as current smoking of at least one cigarette per day during the latest three months.
Genotyping
Genomic DNA was extracted using QIAamp DNA blood mini kits (Qiagen, Valencia, CA, USA). Allelic discriminations of five MTNR1A SNPs [ rs13140012 (Assay ID: C_31861431_10), rs6553010 (Assay ID: C_11782809_10), rs2119882 (Assay ID: C_16100974_10), rs13113549 (Assay ID: C_11791559_10), and rs2375801 (Assay ID: C_15785462_10)] and five MTNR1B SNPs [rs1387153 (Assay ID: C_1932612_10), rs1562444 (Assay ID: C_8369474_10), rs4611171 (Assay ID: C_3256853_20), rs10765576 (Assay ID: C_30851514_10), and rs10830963 (Assay ID: C_3256858_10)] were assessed by using the TaqMan assay with an ABI StepOne™ Real-Time PCR System (Applied Biosystems, Foster City, CA, USA), and analyzed with SDS version 3.0 software (Applied Biosystems, Foster City, CA, USA).
Bioinformatics analysis
We proposed several standard protocol bioinformatics tools for assessing where polymorphic rs2119882 genetic variants were associated with a putative function that might influence patient outcomes. The predictive chromatin signatures in the human genome, as determined by the ChIP-seq assays from the Encyclopedia of DNA Elements (ENCODE) project [53]. UCSC Cancer Genomics Browser [54] for hepatocellular adenocarcinomas were used for analyzing MTNR1A expression, DNA methylation, molecular features, and clinical outcomes. The potential consensus GATA2 cis-regulatory DNA elements through JASPAR [55] CORE collection (http://jaspar.genereg.net).
Statistical analysis
The Hardy-Weinberg equilibrium was assessed by using a goodness-of-fit v2 test for biallelic markers. Mann–Whitney U test and Fisher’s exact test were used to compare the differences in demographic characteristics between healthy controls and HCC patients. The adjusted odds ratios (AORs) with their 95% confidence intervals (CIs) for the association between genotype frequencies and the risk of HCC plus clinicopathological characteristics were estimated by multiple logistic regression models after controlling for other covariates. The haplotype-based analysis was conducted using the Phase program [56]. A p value < 0.05 was considered significant. The data were analyzed using SAS statistical software (Version 9.1, 2005; SAS Institute Inc., Cary, NC).
Author contributions
SCS, MJH and SFY conceived and designed the experiments; MJH, CHC and CMY performed the experiments; HLL and SFY collected the samples; YFL and WHC analyzed the data; SCS, YCH, RJR and SFY wrote and revised the paper.
CONFLICTS OF INTEREST
The authors declared no conflicts of interest.
FUNDING
This study was supported by the grant from Chang Shan Medical University Hospital (CSH-2017-E-001-Y2).
REFERENCES
1. Siegel R, Naishadham D, Jemal A. Cancer statistics, 2012. CA Cancer J Clin. 2012; 62:10–29. https://doi.org/10.3322/caac.20138.
2. Blechacz B, Mishra L. Hepatocellular carcinoma biology. Recent Results Cancer Res. 2013; 190:1–20. https://doi.org/10.1007/978-3-642-16037-0_1.
3. Sherman M. Hepatocellular carcinoma: epidemiology, surveillance, and diagnosis. Semin Liver Dis. 2010; 30:3–16. https://doi.org/10.1055/s-0030-1247128.
4. Forner A, Llovet JM, Bruix J. Hepatocellular carcinoma. Lancet. 2012; 379:1245–55. https://doi.org/10.1016/S0140-6736(11)61347-0.
5. Gao J, Xie L, Yang WS, Zhang W, Gao S, Wang J, Xiang YB. Risk factors of hepatocellular carcinoma—current status and perspectives. Asian Pac J Cancer Prev. 2012; 13:743–52.
6. Miki D, Ochi H, Hayes CN, Aikata H, Chayama K. Hepatocellular carcinoma: towards personalized medicine. Cancer Sci. 2012; 103:846–50. https://doi.org/10.1111/j.1349-7006.2012.02242.x.
7. Nahon P, Zucman-Rossi J. Single nucleotide polymorphisms and risk of hepatocellular carcinoma in cirrhosis. J Hepatol. 2012; 57:663–74. https://doi.org/10.1016/j.jhep.2012.02.035.
8. Jin F, Xiong WJ, Jing JC, Feng Z, Qu LS, Shen XZ. Evaluation of the association studies of single nucleotide polymorphisms and hepatocellular carcinoma: a systematic review. J Cancer Res Clin Oncol. 2011; 137:1095–104. https://doi.org/10.1007/s00432-010-0970-0.
9. Lerner AB, Case JD, Takahashi Y. Isolation of melatonin and 5-methoxyindole-3-acetic acid from bovine pineal glands. J Biol Chem. 1960; 235:1992–7.
10. Acuna-Castroviejo D, Escames G, Venegas C, Diaz-Casado ME, Lima-Cabello E, Lopez LC, Rosales-Corral S, Tan DX, Reiter RJ. Extrapineal melatonin: sources, regulation, and potential functions. Cell Mol Life Sci. 2014; 71:2997–3025. https://doi.org/10.1007/s00018-014-1579-2.
11. Reiter RJ, Tan DX, Fuentes-Broto L. Melatonin: a multitasking molecule. Prog Brain Res. 2010; 181:127–51. https://doi.org/10.1016/S0079-6123(08)81008-4.
12. Srinivasan V, Spence DW, Trakht I, Pandi-Perumal SR, Cardinali DP, Maestroni GJ. Immunomodulation by melatonin: its significance for seasonally occurring diseases. Neuroimmunomodulation. 2008; 15:93–101. https://doi.org/10.1159/000148191.
13. Reiter RJ, Mayo JC, Tan DX, Sainz RM, Alatorre-Jimenez M, Qin L. Melatonin as an antioxidant: under promises but over delivers. J Pineal Res. 2016; 61:253–78. https://doi.org/10.1111/jpi.12360.
14. Hardeland R, Madrid JA, Tan DX, Reiter RJ. Melatonin, the circadian multioscillator system and health: the need for detailed analyses of peripheral melatonin signaling. J Pineal Res. 2012; 52:139–66. https://doi.org/10.1111/j.1600-079X.2011.00934.x.
15. Singh M, Jadhav HR. Melatonin: functions and ligands. Drug Discov Today. 2014; 19:1410–8. https://doi.org/10.1016/j.drudis.2014.04.014.
16. Quintana C, Cabrera J, Perdomo J, Estevez F, Loro JF, Reiter RJ, Quintana J. Melatonin enhances hyperthermia-induced apoptotic cell death in human leukemia cells. J Pineal Res. 2016; 61:381–95. https://doi.org/10.1111/jpi.12356.
17. Bizzarri M, Proietti S, Cucina A, Reiter RJ. Molecular mechanisms of the pro-apoptotic actions of melatonin in cancer: a review. Expert Opin Ther Targets. 2013; 17:1483–96. https://doi.org/10.1517/14728222.2013.834890.
18. Su SC, Hsieh MJ, Yang WE, Chung WH, Reiter RJ, Yang SF. Cancer metastasis: Mechanisms of inhibition by melatonin. J Pineal Res. 2017; 62. https://doi.org/10.1111/jpi.12370.
19. Reiter RJ, Rosales-Corral SA, Tan DX, Acuna-Castroviejo D, Qin L, Yang SF, Xu K. Melatonin, a full service anti-cancer agent: inhibition of initiation, progression and metastasis. Int J Mol Sci. 2017; 18. https://doi.org/10.3390/ijms18040843.
20. Mills E, Wu P, Seely D, Guyatt G. Melatonin in the treatment of cancer: a systematic review of randomized controlled trials and meta-analysis. J Pineal Res. 2005; 39:360–6. https://doi.org/10.1111/j.1600-079X.2005.00258.x.
21. Bouatia-Naji N, Bonnefond A, Cavalcanti-Proenca C, Sparso T, Holmkvist J, Marchand M, Delplanque J, Lobbens S, Rocheleau G, Durand E, De Graeve F, Chevre JC, Borch-Johnsen K, et al. A variant near MTNR1B is associated with increased fasting plasma glucose levels and type 2 diabetes risk. Nat Genet. 2009; 41:89–94. https://doi.org/10.1038/ng.277.
22. Lyssenko V, Nagorny CL, Erdos MR, Wierup N, Jonsson A, Spegel P, Bugliani M, Saxena R, Fex M, Pulizzi N, Isomaa B, Tuomi T, Nilsson P, et al. Common variant in MTNR1B associated with increased risk of type 2 diabetes and impaired early insulin secretion. Nat Genet. 2009; 41:82–8. https://doi.org/10.1038/ng.288.
23. Prokopenko I, Langenberg C, Florez JC, Saxena R, Soranzo N, Thorleifsson G, Loos RJ, Manning AK, Jackson AU, Aulchenko Y, Potter SC, Erdos MR, Sanna S, et al. Variants in MTNR1B influence fasting glucose levels. Nat Genet. 2009; 41:77–81. https://doi.org/10.1038/ng.290.
24. Tarnowski M, Malinowski D, Safranow K, Dziedziejko V, Pawlik A. MTNR1A and MTNR1B gene polymorphisms in women with gestational diabetes. Gynecol Endocrinol. 2017; 33:395–8. https://doi.org/10.1080/09513590.2016.1276556.
25. Yang P, Liu H, Lin J, Yang H. The association of rs4753426 polymorphism in the melatonin receptor 1B (MTNR1B) gene and susceptibility to adolescent idiopathic scoliosis: a systematic review and meta-analysis. Pain Physician. 2015; 18:419–31.
26. Li C, Shi Y, You L, Wang L, Chen ZJ. Melatonin receptor 1A gene polymorphism associated with polycystic ovary syndrome. Gynecol Obstet Invest. 2011; 72:130–4. https://doi.org/10.1159/000323542.
27. Venook AP, Papandreou C, Furuse J, de Guevara LL. The incidence and epidemiology of hepatocellular carcinoma: a global and regional perspective. Oncologist. 2010; 15:5–13. https://doi.org/10.1634/theoncologist.2010-S4-05.
28. Bruno S, Savojardo D, Almasio PL, Mondelli MU. Critical reappraisal of risk factors for occurrence of hepatocellular carcinoma in patients with hepatitis C virus. Hepat Med. 2011; 3:21–8. https://doi.org/10.2147/HMER.S16991.
29. Cutando A, López-Valverde A, Arias-Santiago S, DE Vicente J, DE Diego RG. Role of melatonin in cancer treatment. Anticancer Res. 2012; 32:2747–53.
30. Gabriel SB, Schaffner SF, Nguyen H, Moore JM, Roy J, Blumenstiel B, Higgins J, DeFelice M, Lochner A, Faggart M, Liu-Cordero SN, Rotimi C, Adeyemo A, et al. The structure of haplotype blocks in the human genome. Science. 2002; 296:2225–9. https://doi.org/10.1126/science.1069424.
31. Li YW, Wang JX, Yin X, Qiu SJ, Wu H, Liao R, Yi Y, Xiao YS, Zhou J, Zhang BH, Fan J. Decreased expression of GATA2 promoted proliferation, migration and invasion of HepG2 in vitro and correlated with poor prognosis of hepatocellular carcinoma. PLoS One. 2014; 9:e87505. https://doi.org/10.1371/journal.pone.0087505.
32. Jung B, Ahmad N. Melatonin in cancer management: progress and promise. Cancer Res. 2006; 66:9789–93. https://doi.org/10.1158/0008-5472.CAN-06-1776.
33. Mediavilla MD, Sanchez-Barcelo EJ, Tan DX, Manchester L, Reiter RJ. Basic mechanisms involved in the anti-cancer effects of melatonin. Curr Med Chem. 2010; 17:4462–81.
34. Peschke E, Fauteck JD, Musshoff U, Schmidt F, Beckmann A, Peschke D. Evidence for a melatonin receptor within pancreatic islets of neonate rats: functional, autoradiographic, and molecular investigations. J Pineal Res. 2000; 28:156–64.
35. Peschke E, Muhlbauer E, Musshoff U, Csernus VJ, Chankiewitz E, Peschke D. Receptor (MT(1)) mediated influence of melatonin on cAMP concentration and insulin secretion of rat insulinoma cells INS-1. J Pineal Res. 2002; 33:63–71.
36. Vigneri P, Frasca F, Sciacca L, Pandini G, Vigneri R. Diabetes and cancer. Endocr Relat Cancer. 2009; 16:1103–23. https://doi.org/10.1677/ERC-09-0087.
37. Alonso-Vale MI, Andreotti S, Peres SB, Anhe GF, das Neves Borges-Silva C, Neto JC, Lima FB. Melatonin enhances leptin expression by rat adipocytes in the presence of insulin. Am J Physiol Endocrinol Metab. 2005; 288:E805-12. https://doi.org/10.1152/ajpendo.00478.2004.
38. Qureshi K, Abrams GA. Metabolic liver disease of obesity and role of adipose tissue in the pathogenesis of nonalcoholic fatty liver disease. World J Gastroenterol. 2007; 13:3540–53.
39. Hill SM, Belancio VP, Dauchy RT, Xiang S, Brimer S, Mao L, Hauch A, Lundberg PW, Summers W, Yuan L, Frasch T, Blask DE. Melatonin: an inhibitor of breast cancer. Endocr Relat Cancer. 2015; 22:R183–204. https://doi.org/10.1530/ERC-15-0030.
40. Xi SC, Tam PC, Brown GM, Pang SF, Shiu SY. Potential involvement of mt1 receptor and attenuated sex steroid-induced calcium influx in the direct anti-proliferative action of melatonin on androgen-responsive LNCaP human prostate cancer cells. J Pineal Res. 2000; 29:172–83.
41. Danielczyk K, Dziegiel P. [MT1 melatonin receptors and their role in the oncostatic action of melatonin]. Postepy Hig Med Dosw (Online). 2009; 63:425–34.
42. Ram PT, Dai J, Yuan L, Dong C, Kiefer TL, Lai L, Hill SM. Involvement of the mt1 melatonin receptor in human breast cancer. Cancer Lett. 2002; 179:141–50.
43. Shiu SY, Li L, Xu JN, Pang CS, Wong JT, Pang SF. Melatonin-induced inhibition of proliferation and G1/S cell cycle transition delay of human choriocarcinoma JAr cells: possible involvement of MT2 (MEL1B) receptor. J Pineal Res. 1999; 27:183–92.
44. Carrillo-Vico A, Lardone PJ, Alvarez-Sanchez N, Rodriguez-Rodriguez A, Guerrero JM. Melatonin: buffering the immune system. Int J Mol Sci. 2013; 14:8638–83. https://doi.org/10.3390/ijms14048638.
45. Guerrero JM, Reiter RJ. Melatonin-immune system relationships. Curr Top Med Chem. 2002; 2:167–79.
46. Szczepanik M. Melatonin and its influence on immune system. J Physiol Pharmacol. 2007; 58:115–24.
47. Vinther AG, Claesson MH. [The influence of melatonin on the immune system and cancer]. [Article in Danish]. Ugeskr Laeger. 2015; 177:V10140568.
48. Coghlin C, Murray GI. Current and emerging concepts in tumour metastasis. J Pathol. 2010; 222:1–15. https://doi.org/10.1002/path.2727.
49. Danielczyk K, Dziegiel P. The expression of MT1 melatonin receptor and Ki-67 antigen in melanoma malignum. Anticancer Res. 2009; 29:3887–95.
50. Mao L, Yuan L, Slakey LM, Jones FE, Burow ME, Hill SM. Inhibition of breast cancer cell invasion by melatonin is mediated through regulation of the p38 mitogen-activated protein kinase signaling pathway. Breast Cancer Res. 2010; 12:R107. https://doi.org/10.1186/bcr2794.
51. Peters I, Dubrowinskaja N, Tezval H, Kramer MW, von Klot CA, Hennenlotter J, Stenzl A, Scherer R, Kuczyk MA, Serth J. Decreased mRNA expression of GATA1 and GATA2 is associated with tumor aggressiveness and poor outcome in clear cell renal cell carcinoma. Target Oncol. 2015; 10:267–75. https://doi.org/10.1007/s11523-014-0335-8.
52. Vauthey JN, Lauwers GY, Esnaola NF, Do KA, Belghiti J, Mirza N, Curley SA, Ellis LM, Regimbeau JM, Rashid A, Cleary KR, Nagorney DM. Simplified staging for hepatocellular carcinoma. J Clin Oncol. 2002; 20:1527–36. https://doi.org/10.1200/jco.2002.20.6.1527.
53. Thurman RE, Rynes E, Humbert R, Vierstra J, Maurano MT, Haugen E, Sheffield NC, Stergachis AB, Wang H, Vernot B, Garg K, John S, Sandstrom R, et al. The accessible chromatin landscape of the human genome. Nature. 2012; 489:75–82. https://doi.org/10.1038/nature11232.
54. Haeussler M, Raney BJ, Hinrichs AS, Clawson H, Zweig AS, Karolchik D, Casper J, Speir ML, Haussler D, Kent WJ. Navigating protected genomics data with UCSC Genome Browser in a Box. Bioinformatics. 2015; 31:764–6. https://doi.org/10.1093/bioinformatics/btu712.
55. Mathelier A, Fornes O, Arenillas DJ, Chen CY, Denay G, Lee J, Shi W, Shyr C, Tan G, Worsley-Hunt R, Zhang AW, Parcy F, Lenhard B, et al. JASPAR 2016: a major expansion and update of the open-access database of transcription factor binding profiles. Nucleic Acids Res. 2016; 44:D110–5. https://doi.org/10.1093/nar/gkv1176.
56. Stephens M, Scheet P. Accounting for decay of linkage disequilibrium in haplotype inference and missing-data imputation. Am J Hum Genet. 2005; 76:449–62. https://doi.org/10.1086/428594.