
INTRODUCTION
Nicotine dependence is one of the commonest behavioral disorders. It involves psychological and physical dependences on nicotine and loss of control of in spite of frequent undesirable complications [1]. Smoking is considered to be one of the independent causes of a series of severe illnesses such as stroke, pulmonary disease, cardiac-cerebral vascular disease, and cancer. In recent years, some studies implicate genetic factors in the susceptibility to smoking addiction [2, 3]. A number of candidate genes in the reinforcement and reward system may play vital roles in drug abuse, including that of nicotine dependence [4].
A significant neurotransmitter system relevant to nicotine-induced reward is the endogenous opioid system. Nicotine consumption can lead to increased endogenous opioids, especially β-endorphin. The binding of β-endorphin to μ-opioid receptors (genetic locus OPRM1) might reinforce nicotine dependence by increasing dopamine actions in reward centers [5, 6]. As suspected in the case of alcohol, genetic variations of OPRM1 might impact the risk of developing nicotine dependence. The exon 1 A118G (rs1799971) is in the OPRM1 coding area, leading to an Asn40Asp substitution of amino acids. Present studies of the possible association of nicotine dependence and OPRM1-A118G polymorphism evince mixed findings. Present studies are of small sample size, and we therefore performed a meta-analysis of the available case-controlled trials.
RESULTS
Search results and study features
Figure 1 outlines the literature search process. Based on the inclusion criteria set in Table 1, a total of seven articles involving 3313 patients were finally included [5, 7–11], among which four studies [5, 7, 10] involved predominantly white patients in the USA, Norway, and Spain (1596 cases in total). Three involved predominantly Asian patients [8, 9, 11] in mainland China [9, 11] and Taiwan [8] (1717 cases in total). All studies were reported in English. Nicotine dependence was defined by nicotine consumption and smoking history. In all included studies, distributions of the OPRM1-A118G polymorphism (A>G) in the controls were consistent with Hardy-Weinberg equilibrium. A variety of genotyping methods were applied including PCR-RFLP [8, 10], iPLEX/MALDI-TOF mass spectrometry [9], and TaqMan assay method [5, 7, 10, 11]. Genes were read from blood samples in all included studies. Controls were mainly matched in terms of age, and they were population-based in four studies [5, 7, 9, 10], hospital-based in two [10], and not so-specified in two [8, 11]. Literature methodological quality assessment scoring standard is shown in Table 2), and the explanations of some key statistical concepts are shown in Table 3. Study characteristics and quality assessment results are shown in Table 4.
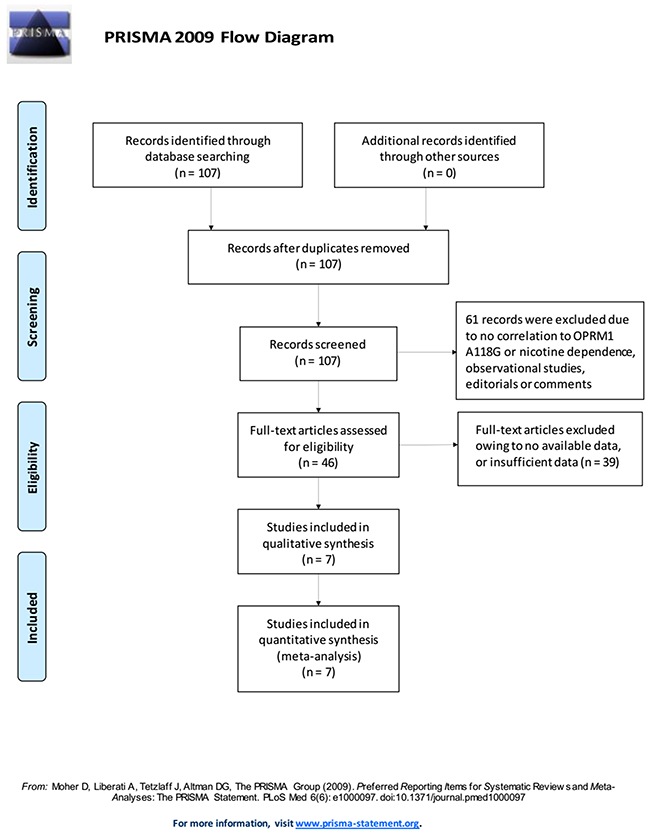
Figure 1: Literature search and selection of articles.
Table 1: Inclusion criteria for study selection in this meta-analysis
Number |
Inclusion criteria |
1 |
Case-control studies. |
2 |
The studies evaluated the associations between OPRM1 A118G polymorphism and nicotine dependence. |
3 |
The studies included detailed genotyping data (total number of cases and controls, number of cases and controls with A/A, A/G, and G/G genotypes). |
4 |
Studies focusing on human being. |
Number |
Exclusion criteria |
1 |
The design of the experiments was not case-control. |
2 |
The source of cases and controls, and other essential information were not provided. |
3 |
The genotype distribution of the control population was not in accordance with the Hardy–Weinberg equilibrium (HWE). |
4 |
Reviews and duplicated publications. |
Table 2: Scale for methodological quality assessment
Criteria |
Score |
|---|---|
1. Representativeness of cases |
|
RA diagnosed according to acknowledged criteria. |
2 |
Mentioned the diagnosed criteria but not specifically described. |
1 |
Not Mentioned. |
0 |
2. Source of controls |
|
Population or community based |
3 |
Hospital-based RA-free controls |
2 |
Healthy volunteers without total description |
1 |
RA-free controls with related diseases |
0.5 |
Not described |
0 |
3. Sample size |
|
>300 |
2 |
200-300 |
1 |
<200 |
0 |
4. Quality control of genotyping methods |
|
Repetition of partial/total tested samples with a different method |
2 |
Repetition of partial/total tested samples with the same method |
1 |
Not described |
0 |
5. Hardy-Weinberg equilibrium (HWE) |
|
Hardy-Weinberg equilibrium in control subjects |
1 |
Hardy-Weinberg disequilibrium in control subjects |
0 |
Table 3: Statistical methods used in this meta-analysis and their explanations
Statistic means |
Goals and usages |
Explanation |
|---|---|---|
Labbe plot |
To evaluate heterogeneity between the included studies |
In Labbe figure, if the points basically present as a linear distribution, it can be taken as an evidence of homogeneity. |
Cochran’s Q test |
To evaluate heterogeneity between the included studies |
Cochran's Q test is an extension to the McNemar test for related samples that provides a method for testing for differences between three or more matched sets of frequencies or proportions. Heterogeneity was also considered significant if P < 0.05 using the Cochran's Q test. |
I2 index test |
To evaluate heterogeneity between the included studies |
The I2 index measures the extent of true heterogeneity dividing the difference between the result of the Q test and its degrees of freedom (k – 1) by the Q value itself, and multiplied by 100. I2 values of 25%, 50% and 75% were used as evidence of low, moderate and high heterogeneity, respectively. |
Sensitivity analysis |
To examine the stability of the pooled results |
A sensitivity analysis was performed using the one-at-a-time method, which involved omitting one study at a time and repeating the meta-analysis. If the omission of one study significantly changed the result, it implied that the result was sensitive to the studies included. |
Funnel plot |
Publication bias test |
In the absence of publication bias, it assumes that studies with high precision will be plotted near the average, and studies with low precision will be spread evenly on both sides of the average, creating a roughly funnel-shaped distribution. Deviation from this shape can indicate publication bias. |
Table 4: Characteristics of studies included in the meta-analysis
Author |
Year |
Country |
Ethnicity |
Disease type |
Genotyping |
Source of controls |
Nicotine-dependence (n) |
Controls (n) |
P for HWE |
Quality |
||||||
|---|---|---|---|---|---|---|---|---|---|---|---|---|---|---|---|---|
Total |
AA |
AG |
GG |
Total |
AA |
AG |
GG |
|||||||||
Schinka |
2002 |
USA |
Caucasian |
Nicotine -dependence |
PCR-RFLP |
Population-based |
134 |
114 |
20 |
0 |
297 |
220 |
73 |
4 |
0.0000 |
8 |
Zhang |
2006 |
China |
Asian |
Nicotine -dependence |
Taqman |
NA |
443 |
343 |
90 |
10 |
238 |
187 |
46 |
5 |
0.313 |
8 |
Chen |
2013 |
Taiwan, China |
Asian |
Nicotine -dependence |
PCR-RFLP |
NA |
366 |
151 |
170 |
45 |
387 |
180 |
159 |
48 |
0.1678 |
6 |
Fang |
2014 |
China |
Asian |
Nicotine -dependence |
iPLEX/MALDI-TOF mass spectrometry |
Population-based |
137 |
64 |
62 |
11 |
146 |
72 |
58 |
16 |
0.4116 |
7 |
Hasvik |
2014 |
Norway |
Caucasian |
Nicotine -dependence |
Taqman |
Population-based |
43 |
34 |
9 |
0 |
75 |
61 |
13 |
1 |
0.7484 |
6 |
Frances |
2015 |
Spain |
Caucasian |
Nicotine -dependence |
Taqman |
Population-based |
175 |
118 |
54 |
3 |
588 |
408 |
166 |
14 |
0.549 |
8 |
Hirasawa |
2015 |
USA |
Caucasian |
Nicotine -dependence |
Taqman |
Hospital-based |
196 |
157 |
29 |
10 |
88 |
63 |
25 |
0 |
0.1204 |
7 |
Meta-analysis results
The main results including heterogeneity tests, effect models adopted accordingly, and the pooled OR with 95% CI and P value of this meta-analysis were shown in Table 5. The Labbe plots for allele model, heterozygote model and dominant model were shown in Figure 2A, 2B, 2C. In the overall level, the statistically correlation between OPRM1-A118G polymorphism and increased nicotine-dependence risks was not found in any of the five models (allele model: OR 1.000, 95% CI 0.906, 1.104; p = 0.999; Figure 3A; homozygote model: OR 1.032, 95% CI 0.771, 1.381; p = 0.834; Figure 3B; heterozygote model: OR 0.963, 95% CI 0.799, 1.162; p = 0.696; Figure 3-C; dominant model: OR 1.006, 95% CI 0.916, 1.104; p = 0.907; Figure 3D; recessive model: OR 0.967, 95% CI 0.715, 1.309; p = 0.830; Figure 3E).
Table 5: Results of meta-analysis for various genotype models
Genetic model |
Heterogeneity test |
Test of Association |
Egger’s test |
||||||||||||||
|---|---|---|---|---|---|---|---|---|---|---|---|---|---|---|---|---|---|
Name |
Explanation |
Ethnicity |
Q value |
d.f. |
I-squared |
Tau-squared |
P Value |
Heterogeneity |
Effect model |
Pooled OR |
95% CI |
Z value |
P value |
Statistical significance |
P Value |
95% CI |
Publication bias |
|
Allele model |
G vs. A |
Caucasian |
5.70 |
3 |
47.3% |
NA |
0.127 |
No |
Fixed |
0.876 |
[0.719, 1.067] |
1.32 |
0.187 |
No |
- |
- |
- |
Asian |
0.31 |
2 |
0.0% |
NA |
0.857 |
No |
Fixed |
1.056 |
[0.943, 1.183] |
0.94 |
0.346 |
No |
- |
- |
- |
||
Total |
8.02 |
6 |
25.2% |
NA |
0.236 |
No |
Fixed |
1.000 |
[0.906, 1.104] |
0.00 |
0.999 |
No |
0.174 |
[-4.45, 1.05] |
No |
||
|
Homozygote model |
GG vs. AA |
Caucasian |
3.54 |
3 |
15.3% |
NA |
0.315 |
No |
Fixed |
1.062 |
[0.439, 2.566] |
0.13 |
0.895 |
No |
- |
- |
- |
Asian |
0.57 |
2 |
0.0% |
NA |
0.751 |
No |
Fixed |
1.027 |
[0.756, 1.395] |
0.17 |
0.867 |
No |
- |
- |
- |
||
Total |
4.07 |
6 |
0.0% |
NA |
0.667 |
No |
Fixed |
1.032 |
[0.771, 1.381] |
0.21 |
0.834 |
No |
0.768 |
[-1.69, 1.32] |
No |
||
|
Heterozygote model |
AG vs. AA |
Caucasian |
9.92 |
3 |
69.8% |
0.1140 |
0.019 |
Yes |
Random |
0.797 |
[0.530, 1.197] |
1.10 |
0.273 |
No |
- |
- |
- |
Asian |
0.16 |
2 |
0.0% |
0.0000 |
0.923 |
No |
Fixed |
1.112 |
[0.984, 1.256] |
1.70 |
0.089 |
No |
- |
- |
- |
||
Total |
14.66 |
6 |
59.1% |
0.0332 |
0.023 |
Yes |
Random |
0.963 |
[0.799, 1.162] |
0.39 |
0.696 |
No |
0.228 |
[-7.24, 2.20] |
No |
||
|
Dominant model |
AG+GG vs. AA |
Caucasian |
7.30 |
3 |
58.9% |
NA |
0.063 |
No |
Fixed |
0.862 |
[0.715, 1.039] |
1.55 |
0.120 |
No |
- |
- |
- |
Asian |
0.15 |
2 |
0.0% |
NA |
0.928 |
No |
Fixed |
1.080 |
[0.971, 1.200] |
1.42 |
0.157 |
No |
- |
- |
- |
||
Total |
11.02 |
6 |
45.5% |
NA |
0.088 |
No |
Fixed |
1.006 |
[0.916, 1.104] |
0.12 |
0.907 |
No |
0.195 |
[-6.22, 1.65] |
No |
||
|
Recessive model |
GG vs. AA+AG |
Caucasian |
3.92 |
3 |
23.5% |
NA |
0.270 |
No |
Fixed |
1.133 |
[0.473, 2.711] |
0.28 |
0.779 |
No |
- |
- |
- |
Asian |
0.58 |
2 |
0.0% |
NA |
0.748 |
No |
Fixed |
0.941 |
[0.682, 1.297] |
0.37 |
0.710 |
No |
- |
- |
- |
||
Total |
4.29 |
6 |
0.0% |
NA |
0.638 |
No |
Fixed |
0.967 |
[0.715, 1.309] |
0.21 |
0.830 |
No |
0.984 |
[-1.53, 1.51] |
No |
||
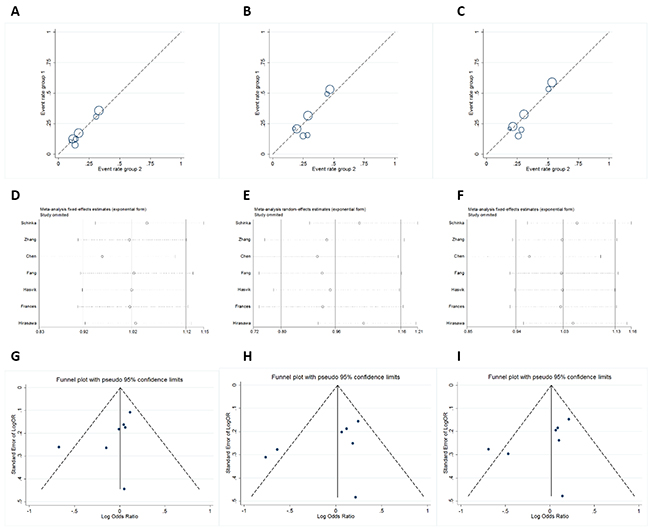
Figure 2: Labbe plots, sensitivity analysis plots and contour-enhanced funnel plots of the included studies focusing on the association between OPRM1-A118G Polymorphism and nicotine-dependence risk. Labbe plots in allele model (A), heterozygote model (B), and dominant model (C). Sensitivity analysis in allele model (D), heterozygote model (E), and dominant model (F). Funnel plots in allele model (G), heterozygote model (H), and dominant model (I).
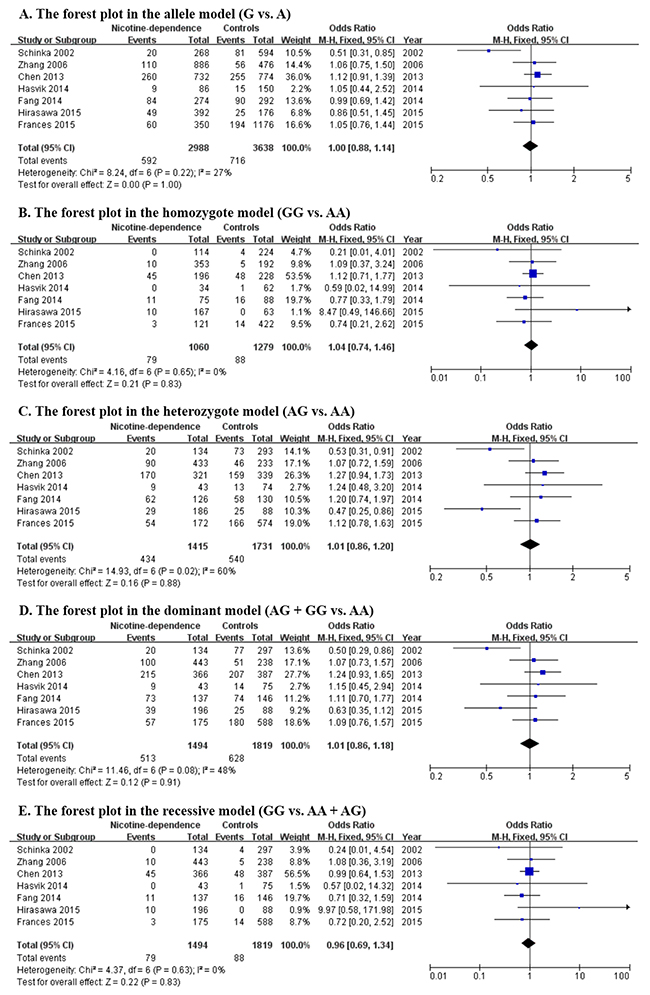
Figure 3: Forest plots (individual and pooled effects with 95% CI) regarding the association between OPRM1-A118G polymorphism and nicotine-dependence in allele model (A), homozygote model (B), heterozygote model (C), dominant model (D) and recessive model (E).
Since ethnicity may have effect on this association, ethnicity-specific subgroup analysis was also performed. All ethnicities involved in these 7 articles can be divided into Caucasian group and Asian group. The subgroup results of heterogeneity tests and meta-analysis were also shown in Table 5 and Figure 3, from which, neither in Caucasian group nor in Asian group, the OPRM1-A118G polymorphism has correlation to nicotine-dependence. So at least for now, we cannot provide the evidence for the correlation based on the current circumstance.
Sensitivity-analyses and publication-bias
The sensitivity-analyses suggested that the final OR was not influenced by removing each single literature (Figure 2D-2F). Funnel plots showed the overall symmetric distributions of the studies (Figure 2G-2I), indicating less likelihood of publication-bias. Meanwhile, according to Egger’s test results, no significant publication bias was suggested for these included studies (p > 0.05, Table 5).
DISCUSSION
In consideration of the significance of μ-opioid receptor systems in physiological mechanisms about the reward center, biologically, it is plausible that OPRM1 polymorphisms can modulate the risks of nicotine-dependence. Previously published reports demonstrated that OPRM1 A118A mRNAs were 1.5 to 2.5 folds more abundant than 118G mRNAs in cerebral homogenate, and 118G could lead to a 10 folds reduction at OPRM1-protein levels [12]. This indicated that the OPRM1-A118G was a functional allelic variant with damaging effect on both mRNA and protein production.
In the recent years, big data has established very close associations between OPRM1-A118G polymorphism and nicotine, alcohol, and opioid-dependence. Kapur et al. and Tan et al. found a positive correlation between the OPRM1-A118G polymorphism and heroin-dependences [13, 14]. Altered modulations of kinase A are considered to be responsible for the correlations [15]. Recently, Frances et al. found that OPRM1-A118G polymorphism (A>G) is closely related to alcohol/tobacco-dependence in Spanish people, and this association was affected by some environmental and genetic factors [5]. In females, Ray et al. found that there might be significant associations between nicotine reinforcements and the OPRM1-A118G haplotype [16]. Zhang and colleagues thought that it was some other markers combined within A1118G that were significantly associated with smoking initiation, instead of single OPRM1-A118G variant [11]. They found that another allele near the A118G locus serves as the actual risk factor [11]. Genome-wide association researches also showed that the OPRM1 gene is closely related to nicotine dependence [17].
A single study cannot confirm the correlation between OPRM1-A118G polymorphism and nicotine-dependence risks convincingly. This is particularly true for researches with relatively small sample-sizes. Given this, we pooled several databases to analyze the associations between nicotine-dependence and the OPRM1-A118G polymorphism. In our study, the statistically correlation between OPRM1-A118G polymorphism and increased nicotine-dependence risks was not detected in any of the five genetic models (OR 1.261, 95% CI 1.008, 1.578; p = 0.042). Also, different ethnicities might contribute to variable association findings. Thus, we also performed an ethnicity-based subgroup analysis. Similarly, no matter for Caucasian population or Asian population, the OPRM1-A118G polymorphism has no correlation to nicotine-dependence in all there five genetic models. Regarding the testing statistic, the integrated ORs were calculated. Generally, relative risk (RR) and OR are usually comparable in magnitude if the studied diseases are rare, like this case. However, using RR can sometimes magnify or overestimate risks, especially if the diseases are with higher incidence. We carefully reviewed our manuscript and related articles and we are happy to say in our meta-analysis, OR for study outcomes are comparable as RRs and these additional data is adding value to estimate a more accurate effect. In our meta-analysis, no publication bias was suggested according to the funnel-plot. We also conducted the Egger’s test [18]. All p values were more than 0.05, indicating there was no significant publication bias.
There may be some limitations in our meta-analysis. Firstly, the number of the included literatures and the sample-size for each ethnicity were limited. Hence, type-II error couldn’t be dismissed. Secondly, the effect of gene-environment interactions and gene-gene interactions was not emphasized because not all researches had this information, or even when they did, adjusted factors were reported differently. Thirdly, more accurate ORs should be adjusted by patient factors such as gender, age, living styles, medication consumption and other exposure factors. Fourth, only published articles were included, the unpublished and ongoing studies could convert our result.
MATRIALS AND METHODS
Publication search and selection criteria
Two authors searched Chinese National Knowledge Infrastructure (CNKI), Web of Science, PubMed, Embase and Google Scholar independently (cut-off date: 30 October 2016) to include case control researches about the correlation between the polymorphism of OPRM1-A118G (rs1799971) and nicotine-dependence risks. Search terms include “nicotine or tobacco or smoking” and “rs1799971 or A118G or OPRM1”. Relevant references were also searched to identify other potentially available researches. The inclusion-criteria and the exclusion-criteria are shown as Table 1.
Data extraction
According to the inclusion criteria set in Table 1, two independent authors reviewed and extracted the needed data and information from the included articles. We collected the following information: author names, publication years, countries, ethnicities (Asian, Caucasian or others), genotyping ways, total numbers of respondents, numbers of controls and cases with OPRM1-A118G polymorphism, numbers of controls and cases with G/G, A/G and A/A genotype, control source (hospital-based or population-based), and P-value regarding Hardy-Weinberg equilibrium (HWE).
Quality assessment
In accord with the methodological quality-assessment scale (see Table 2), that was adjusted from a previous publication, 2 authors estimated the qualities of the included literatures independently. Disagreement would be solved by discussion. In this methodological quality assessment scale, five items, including quality controls of genotyping ways, source of controls, sample sizes, cases representativeness and HWE were prudently checked. The quality scores range from 0 to 10, and high scores indicate good quality.
Statistical analyses
This meta-analysis was in accordance with the PRISMA guidelines and checklists [19]. HWE in each study was firstly assessed, followed by the calculation of ORs with 95% CIs reflecting the correlation strength between OPRM1-A118G polymorphisms and the risks of nicotine-dependence. The integrated ORs were calculated and used for comparisons respectively in allele model (G vs. A), homozygote model (GG vs. AA), heterozygote model (AG vs. AA), dominant model (AG + GG vs. AA), and recessive model (GG vs. AA + AG). Ethnicity-specific subgroup (Caucasian and Asian) meta-analysis was also performed. The Labbe plot, I2 test and Cochran's Q-test (Table 3) were done for accessing the heterogeneities [20]. If no evidences of heterogeneities were suggested, the fixed-effects model would be chosen [21]. Otherwise, we chose the random-effects model. To access the stability, sensitivity-analyses are also necessary (explanation in Table 3) [22]. Using funnel plots and Egger linear regression tests (Table 3), potential publication biases were calculated. P < 0.05 indicates statistical significance.
CONCLUSIONS
Opioid Receptor mu 1 (OPRM1) A118G Polymorphism (rs1799971) is not associated with nicotine dependence in white or Asian populations.
Abbreviations
OPRM1 = Opioid Receptor mu 1, CNKI = Chinese National Science Infrastructure, OR = odds ratio, CI = confidence interval, PCR-RFLP = Polymerase chain reaction restriction fragment length polymorphism, RR = relative risk.
Author contributions
Xiangyi Kong, Hao Deng, Theodore Alston, Yanguo Kong, and Jingping Wang put forward the idea, collected the data, analyzed the data, and drafted the article.
CONFLICTS OF INTEREST
The author declares no conflicts of interest.
FUNDING
This study was supported by Peking Union Medical College Youth Research Funds (2016) (Project No. 3332016010; Grant recipient: Xiangyi Kong). The funder had no role in study design, data collection and analysis, decision to publish, or preparation of the manuscript.
REFERENCES
1. Allenby CE, Boylan KA, Lerman C, Falcone M. Precision medicine for tobacco dependence: development and validation of the nicotine metabolite ratio. J Neuroimmune Pharmacol. 2016; 11:471-483.
2. Bidwell LC, Palmer RH, Brick L, McGeary JE, Knopik VS. Genome-wide single nucleotide polymorphism heritability of nicotine dependence as a multidimensional phenotype. Psychol Med. 2016; 46:2059-2069.
3. Falcone M, Lee B, Lerman C, Blendy JA. Translational research on nicotine dependence. Curr Top Behav Neurosci. 2016; 28:121-150.
4. Gueye AB, Pryslawsky Y, Trigo JM, Poulia N, Delis F, Antoniou K, Loureiro M, Laviolette SR, Vemuri K, Makriyannis A, Le Foll B. The CB1 neutral antagonist AM4113 retains the therapeutic efficacy of the inverse agonist rimonabant for nicotine dependence and weight loss with better psychiatric tolerability. Int J Neuropsychopharmacol. 2016; 19.
5. Frances F, Portoles O, Castello A, Costa JA, Verdu F. Association between opioid receptor mu 1 (OPRM1) gene polymorphisms and tobacco and alcohol consumption in a spanish population. Bosn J Basic Med Sci. 2015; 15:31-36.
6. Kleinjan M, Poelen EA, Engels RC, Verhagen M. Dual growth of adolescent smoking and drinking: evidence for an interaction between the mu-opioid receptor (OPRM1) A118G polymorphism and sex. Addict Biol. 2013; 18:1003-1012.
7. Hasvik E, Iordanova Schistad E, Grovle L, Julsrud Haugen A, Roe C, Gjerstad J. Subjective health complaints in patients with lumbar radicular pain and disc herniation are associated with a sex - OPRM1 A118G polymorphism interaction: a prospective 1-year observational study. BMC Musculoskelet Disord. 2014; 15:161.
8. Chen YT, Tsou HH, Kuo HW, Fang CP, Wang SC, Ho IK, Chang YS, Chen CH, Hsiao CF, Wu HY, Lin KM, Chen A, Tsai-Wu JJ, et al. OPRM1 genetic polymorphisms are associated with the plasma nicotine metabolite cotinine concentration in methadone maintenance patients: a cross sectional study. J Hum Genet. 2013; 58:84-90.
9. Fang J, Wang X, He B. Association between common genetic variants in the opioid pathway and smoking behaviors in chinese men. Behav Brain Funct. 2014; 10:2.
10. Hirasawa-Fujita M, Bly MJ, Ellingrod VL, Dalack GW, Domino EF. Genetic variation of the Mu opioid receptor (OPRM1) and dopamine D2 receptor (DRD2) is related to smoking differences in patients with schizophrenia but not bipolar disorder. Clin Schizophr Relat Psychoses. 2014:1-27.
11. Zhang L, Kendler KS, Chen X. The mu-opioid receptor gene and smoking initiation and nicotine dependence. Behav Brain Funct. 2006; 2:28.
12. Mura E, Govoni S, Racchi M, Carossa V, Ranzani GN, Allegri M, van Schaik RH. Consequences of the 118A>G polymorphism in the OPRM1 gene: translation from bench to bedside? J Pain Res. 2013; 6:331-353.
13. Tan EC, Tan CH, Karupathivan U, Yap EP. Mu opioid receptor gene polymorphisms and heroin dependence in Asian populations. Neuroreport. 2003; 14:569-572.
14. Kapur S, Sharad S, Singh RA, Gupta AK. A118g polymorphism in mu opioid receptor gene (oprm1): association with opiate addiction in subjects of Indian origin. J Integr Neurosci. 2007; 6:511-522.
15. Deb I, Chakraborty J, Gangopadhyay PK, Choudhury SR, Das S. Single-nucleotide polymorphism (A118G) in exon 1 of OPRM1 gene causes alteration in downstream signaling by mu-opioid receptor and may contribute to the genetic risk for addiction. J Neurochem. 2010; 112:486-496.
16. Ray R, Jepson C, Patterson F, Strasser A, Rukstalis M, Perkins K, Lynch KG, O'Malley S, Berrettini WH, Lerman C. Association of OPRM1 A118G variant with the relative reinforcing value of nicotine. Psychopharmacology (Berl). 2006; 188:355-363.
17. Vink JM, Smit AB, de Geus EJ, Sullivan P, Willemsen G, Hottenga JJ, Smit JH, Hoogendijk WJ, Zitman FG, Peltonen L, Kaprio J, Pedersen NL, Magnusson PK, et al. Genome-wide association study of smoking initiation and current smoking. Am J Hum Genet. 2009; 84:367-379.
18. Peters JL, Sutton AJ, Jones DR, Abrams KR, Rushton L. Contour-enhanced meta-analysis funnel plots help distinguish publication bias from other causes of asymmetry. J Clin Epidemiol. 2008; 61:991-996.
19. Panic N, Leoncini E, de Belvis G, Ricciardi W, Boccia S. Evaluation of the endorsement of the preferred reporting items for systematic reviews and meta-analysis (PRISMA) statement on the quality of published systematic review and meta-analyses. PLoS One. 2013; 8:e83138.
20. Higgins JP, Thompson SG. Quantifying heterogeneity in a meta-analysis. Stat Med. 2002; 21:1539-1558.
21. DerSimonian R, Laird N. Meta-analysis in clinical trials revisited. Contemp Clin Trials. 2015; 45:139-145.
22. Copas J, Shi JQ. Meta-analysis, funnel plots and sensitivity analysis. Biostatistics. 2000; 1:247-262.