
INTRODUCTION
Prostate cancer has become the most common malignancy in males in several developed countries and the second most common one worldwide after lung cancer [1]. The precise etiology of prostate cancer is still virtually unknown and the only well-established risk factors are those that are inherited and uncontrollable, including age, race, and family history of prostate cancer [2]. Emerging evidence indicates that environmental factors may also play an important role in the carcinogenesis and progression of prostate cancer. A high incidence of prostate cancer in the USA and European countries suggests that prostate cancer may be related to the ‘‘Western’’ lifestyle pattern [3].
To date, a large number of well-designed prospective cohort studies have been performed to evaluate the potential relationship between body mass index (BMI) and prostate cancer risk with positive, negative, or null results. Several studies indicated that body adiposity may have a dual effect on two subtypes of prostate cancer (localized/non-aggressive and advanced/aggressive cancer) [4, 5]. Therefore, a recent meta-analysis published in 2012 reviewed all eligible cohort studies investigating this topic and assessed the potential association separately by tumor characteristics. As a result, a high BMI appeared to increase the risk of advanced prostate cancer while reducing the risk of localized disease. Thus, these results support the hypothesis of a dual effect of BMI on prostate cancer carcinogenesis [6]. Since then, more high-quality cohort studies [7–12] have been performed on this topic separately by tumor grade. However, the results are still controversial.
In this study, we performed an updated random-effects dose-response meta-analysis of all available cohort studies up to now in order to comprehensively evaluate the association between BMI and incidence of prostate cancer separately by tumor characteristics.
RESULTS
Literature search and study characteristics
The detailed process of literature search is shown in Figure 1. 21 eligible studies [4, 5, 7–25] were finally included in the present meta-analysis. These studies were published between 1994 and 2017 with cohort size ranging from 1,050 to 336,159. The studies were completed in the following geographical regions: Europe (n = 8), North America (n = 11), Asia (n = 1), and Oceania (n = 1). Study quality assessment yielded an average score of 6.67. Additional information on the included studies is available in Table 1.
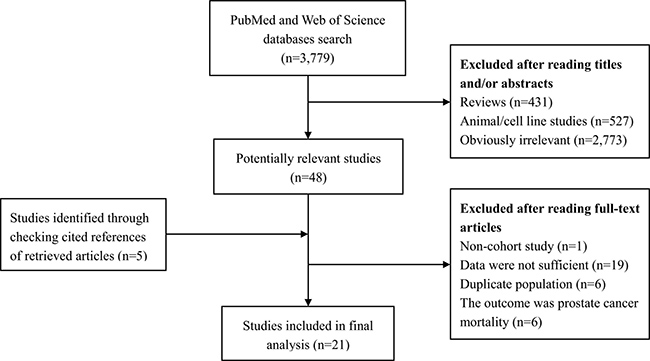
Figure 1: Literature search and study selection. PubMed and Web of Science databases were searched from their inception to March 22, 2017. 21 eligible studies were finally included in the present meta-analysis.
Table 1: Main characteristics of studies included in this meta-analysis
Author, year |
Country |
No. of cases |
No. of cohort |
Age |
Study name or source |
Duration of follow-up |
Quality score |
Adjustment factors |
|---|---|---|---|---|---|---|---|---|
Kelly et al., 2017 [7] |
USA |
7,822 |
69,873 |
62 |
PLCO Cancer Screening Trial |
13 y |
7 |
Age, trial arm, screening center, race, education, married or cohabiting, diabetes, smoking, PSA history, family history of prostate cancer, and myocardial infarction |
Bonn et al., 2016 [8] |
Sweden |
735 |
15,827 |
65.2 |
STHLM-2 cohort |
3.5 y |
6 |
Age, physical activity, education, smoking, stress, family history of prostate cancer |
Grotta et al., 2015 [10] |
Sweden |
904 |
13,109 |
55.1 |
Swedish National March Cohort |
13 y |
7 |
Age, physical activity, education, smoking, alcohol, and diabetes |
Møller et al., 2015 [9] |
Denmark |
1,813 |
26,877 |
50-64 |
Diet, Cancer and Health Study |
15.5 y |
7 |
Age |
Rundle et al., 2013 [11] |
USA |
494 |
6,692 |
65.85 |
Henry Ford Health System |
1990–2007 |
7 |
Age, race, follow-up duration, biopsy versus TURP, date of procedure, PSA levels, family history of PCa, the number of PSA tests and DRE |
Bassett et al., 2012 [12] |
Australia |
1,374 |
16,514 |
68 |
Melbourne Collaborative Cohort Study |
15 y |
8 |
Age, country of birth, and education |
Discacciati et al., 2011 [14] |
Sweden |
2,084 |
36,959 |
45-79 |
Central Sweden |
1998–2008 |
7 |
Age, energy intake, physical activity, education, smoking, family history of PCa, personal history of diabetes, and BMI at age 30 years |
Stocks et al., 2010 [23] |
Sweden |
10,002 |
336,159 |
34.7 ± 13.1 |
Swedish Construction Workers cohort |
22.2 y |
6 |
Age, birth year, smoking, and blood pressure |
Wallström et al., 2009 [24] |
Sweden |
817 |
10,564 |
45-73 |
Malmo Diet and Cancer Study |
11 y |
7 |
Age, height, co-habitation status, socioeconomic status, alcohol, smoking, prevalent diabetes, physical activity, birth country, and total intake of EPA, DHA, red meat, and calcium |
Pischon et al., 2008 [20] |
Eight European countries |
2,446 |
129,502 |
52.8 |
European Prospective Investigation into Cancer and Nutrition |
8.5 y |
8 |
Age, study center, education, smoking, alcohol, physical activity, and height |
Littman et al., 2007 [19] |
USA |
832 |
34,754 |
50-76 |
Vitamins and Lifestyle Study |
2000–2004 |
6 |
Age, family history of PCa, race, and PSA screening in the 2 years before baseline |
Rodriguez et al., 2007 [4] |
USA |
5,252 |
69,991 |
50-74 |
Cancer Prevention Study II |
1992–2003 |
8 |
Age, race, education, family history of PCa, total calorie intake, smoking, history of PSA testing, history of diabetes, and physical activity |
Wright et al., 2007 [25] |
USA |
9,986 |
287,760 |
50–71 |
NIH-AARP Diet and Health Study |
5 y |
6 |
Age, race, smoking, education, personal history of diabetes, and family history of PCa |
Gong et al., 2006 [5] |
USA |
1,936 |
10,258 |
≥ 55 |
Prostate Cancer Prevention Trial |
7 y |
7 |
Age, race, treatment, diabetes, and family history of PCa |
Kurahashi et al., 2006 [17] |
Japan |
311 |
49,850 |
40-69 |
Japan Public Health Centre-based Prospective Study |
1990–2003 |
7 |
Age, area, smoking, family history of PCa, and marital status |
Habel et al., 2000 [16] |
USA |
2,079 |
70,712 |
18-84 |
Kaiser Permanente |
19.5 y |
7 |
Age, race, and birth year |
Putnam et al., 2000 [21] |
USA |
101 |
1,572 |
68.1 |
A Cohort |
1986–1995 |
6 |
Age, total energy, carbohydrates, linoleic acid, lycopene, retinol, red meat, and family history of PCa |
Schuurman et al., 2000 [22] |
Netherland |
681 |
58,279 |
55-69 |
Netherlands |
6.3 y |
6 |
Age, family history of PCa, and socioeconomic status |
Cerhan et al., 1997 [13] |
USA |
71 |
1,050 |
65-101 |
Iowa 65+ |
1982–1993 |
5 |
Age, smoking, and physical activity |
Giovannucci et al., 1997 [15] |
USA |
1,369 |
47,781 |
40-75 |
Health Professionals Follow-Up Study |
1986–1994 |
5 |
Age, height, and BMI at age 21 |
Le Marchand et al., 1994 [18] |
USA |
198 |
20,316 |
≥ 18 |
Hawaii |
1975–1989 |
7 |
Age, ethnicity, and income |
BMI, body mass index; No., number; y, years; PCa, prostate cancer; NA, not available; PLCO, Prostate, Lung, Colorectal and Ovarian.
Linear dose-response analysis
Figure 2 presents the pooled linear dose-response relationship between BMI and incidence of nonaggressive/aggressive prostate cancer. The pooled RRs for 5 kg/m2 increment of BMI were 0.96 (95% CI 0.92–1.00) and 1.07 (95% CI 1.03–1.12) for nonaggressive and aggressive prostate cancer, respectively. Statistically significant heterogeneity was detected for nonaggressive prostate cancer (P = 0.020, I2 = 46.1%) but not for aggressive prostate cancer (P = 0.174, I2 = 22.4%).
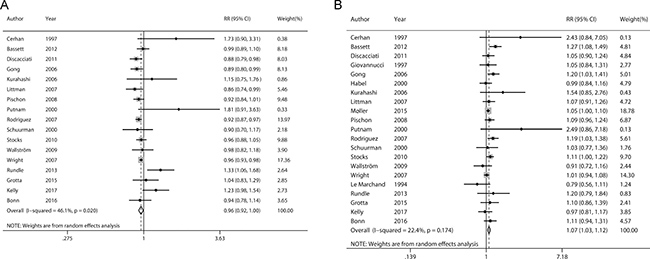
Figure 2: Forrest plots showing RRs of nonaggressive (A) and aggressive prostate cancer (B) associated with each 5 kg/m2 increase in body mass index. The size of each square is proportional to the study’s weight (inverse of variance). Weights are from random effects analysis. Abbreviations: RR, relative risk; CI, confidence interval.
Galbraith plot analysis
Galbraith plot was used to detect the studies that contributed to the heterogeneity. As a result, two studies by Kelly et al. and Rundle et al. [7, 11] led to the heterogeneity among those contributing for nonaggressive prostate cancer (Figure 3A). After removing these two studies, the heterogeneity became small (P = 0.285, I2 = 15.0%) and the direction of the combined RR did not change (RR = 0.94, 95% CI 0.91–0.97) (Figure 3B).
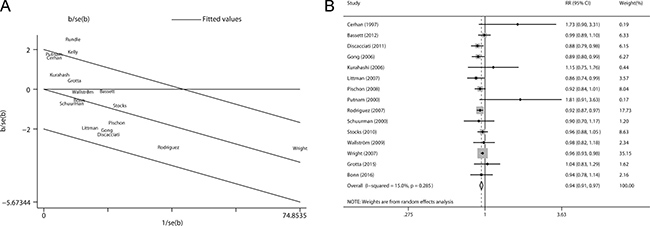
Figure 3: Evaluation of heterogeneity. (A) Galbraith plot was introduced to explore the potential sources of heterogeneity. As a result, two studies led to the heterogeneity. (B) Pooled risk estimate with its 95% CI for the association between BMI and non-aggressive prostate cancer risk after removing the studies that led to heterogeneity.
Sensitivity analysis
In the sensitivity analysis, we removed each included study at a time and repeated the meta-analysis. The combined RRs for non-aggressive prostate cancer were not robust and steady (Figure 4A). In contrast, the pooled risk estimates for aggressive prostate cancer were not influenced greatly by any individual study (Figure 4B).
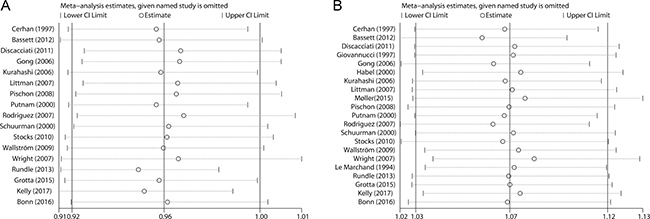
Figure 4: Sensitivity analyses were performed whereby each study was omitted in turn and the pooled risk estimates were recalculated to determine the influence of each study. (A) nonaggressive prostate cancer; (B) aggressive prostate cancer.
Publication bias
Potential publication bias was detected for non-aggressive prostate cancer (Figure 5A and 5B, Egger’s test: P = 0.003; Begg’s test: P = 0.044). The application of trim and fill analysis did not virtually change the pooled risk estimate for non-aggressive prostate cancer (Figure 5C, RR = 0.95, 95% CI 0.90–0.99). No significant evidence of publication bias was observed for aggressive prostate cancer in Egger’s test (Figure 5D, P = 0.339) or Begg’s test (Figure 5E, P = 0.608).
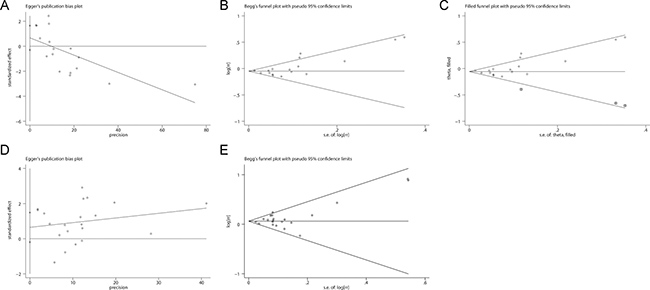
Figure 5: Evaluation of publication bias. Potential publication bias was detected for non-aggressive prostate cancer. No significant evidence of publication bias was observed for aggressive prostate cancer. (A) Begg’s test for non-aggressive prostate cancer; (B) Egger’s test for non-aggressive prostate cancer; (C) Trim-and-fill analysis for non-aggressive prostate cancer; (D) Begg’s test for aggressive prostate cancer; (E) Egger’s test for aggressive prostate cancer.
Nonlinear dose-response analysis
Figure 6 shows the results of non-linear dose-response meta-analysis for aggressive prostate cancer. There was no evidence of a nonlinear relationship between BMI level and aggressive prostate cancer (P = 0.181 for nonlinearity).
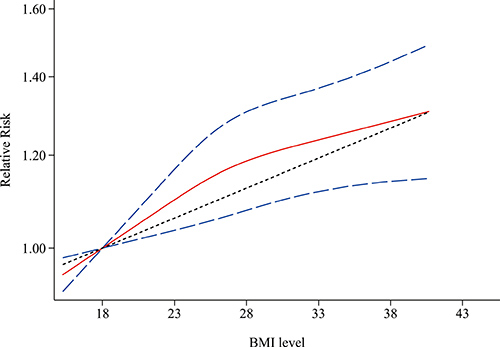
Figure 6: Non-linear dose-response associations between body mass index and relative risk for aggressive prostate cancer. Red solid line and blue dash lines represent point estimates and 95% confidence intervals for non-linear analysis; Grey dash line represents point estimates for linear analysis. Abbreviations: BMI, body mass index.
DISCUSSION
This updated dose-response meta-analysis summarized all available cohort studies that explored the relationship between BMI level and incidence of prostate cancer separately by tumor characteristics. As a result, high BMI may be related with an increased risk of aggressive prostate cancer. On the other hand, a borderline inverse relationship between high BMI and nonaggressive prostate cancer was observed, but sensitivity analysis indicated that this result was not robust and steady.
A previous meta-analysis also examined two prostate cancer subtypes (localized and advanced) separately based on 12 and 13 cohort studies, respectively. They observed an inverse linear relationship for localized prostate cancer (RR = 0.94, 95% CI 0.91–0.97 for every 5 kg/m2 increase) but a linear positive relationship for advanced prostate cancer (RR = 1.09, 95% CI 1.02–1.16 for every 5 kg/m2 increase) [6]. In contrast, although we also found a linear dose-response relationship for aggressive prostate cancer, the evidence that supported the inverse relationship between BMI and nonaggressive prostate cancer was weak.
Several potential mechanisms might mediate the positive association between BMI and risk of aggressive prostate cancer. Obesity leads to high circulating concentrations of insulin, leptin and insulin-like growth factor-I (IGF-I) and low levels of adiponectin, which have been described to promote prostate cancer growth and progression, thus increasing the risk of advanced prostate cancer [26]. In addition, obese men might have a lower concentration of serum testosterone [27]. Although testosterone could stimulate the growth and development of prostate cancer, testosterone could also help maintain the normal differentiated state of the prostate [28]. Hence reduced testosterone may be associated with a higher risk of less differentiated and more aggressive prostate cancer [29].
This meta-analysis has several limitations that should be acknowledged. Firstly, exposure assessment was based on information collected at the baseline. Participants may have changed their BMI over the long follow-up period, which may have led to some bias in risk estimation. Secondly, a meta-analysis is not able to avoid the problems of confounders that could be inherent in the included studies, which may result in either an overestimation or an underestimation of an effect measure. Thirdly, the criteria used to definite nonaggressive and aggressive prostate cancer varied between different cohorts and involved Gleason score, World Health Organization grading system, TNM (tumor-node-metastasis), and so on, which may lead to a misclassification bias. Fourthly, obvious heterogeneity was observed for nonaggressive prostate cancer, which would throw some doubts on the reliability of the pooled estimates. Fifthly, as lack of individual participant data, we are not able to determine the independent effect of individual variables on study outcomes. Sixthly, like all meta-analyses, this study also has the limitation of being a retrospective analysis. Lastly, potential publication bias was detected by Begg’s and Egger’s tests, which may be due to the fact that small studies with null findings tend not to be published.
This present meta-analysis also has some strengths. Linear and non-linear dose-response analyses were adopted to explore the potential relationship between BMI level and prostate cancer risk. Sensitivity analyses and Galbraith plot analysis were performed to assess the robustness and stability of the pooled risk estimates. All included studies were cohort studies and came from several countries. The risk estimates were extracted from the models adjusting for most established risk factors in each study.
In conclusion, this systematic review and dose-response meta-analysis indicates that BMI level is associated with aggressive prostate cancer risk. Further large prospective cohort studies are warranted to confirm the findings from our study.
MATERIALS AND METHODS
Literature search
Two investigators (BX and XX) independently searched PubMed and Web of Science databases from their inception to March 22, 2017 with the following keywords: (“body mass index” OR “BMI” OR “body size” OR “overweight” OR “obesity” OR “adiposity”) AND (“prostate cancer” OR “prostate neoplasm”). No language or date restrictions were applied. The reference lists of retrieved studies and related reviews were also checked for additional eligible articles.
Selection criteria
Studies included in this meta-analysis had to meet all of the following criteria: i) cohort or nested case-control studies; ii) the exposure was BMI; iii) the outcome of interest was incidence rate of prostate cancer; iv) risk estimates with 95% CIs were provided.
Data extraction and quality assessment
Data were extracted independently with a standardized data collection form by two reviewers (BX and XX). The following information were recorded: first author’s surname, publication date, country, cohort name, sample size, the number of cases, follow-up duration, adjusted variables, BMI exposure levels, and corresponding risk estimates with 95% CIs. Quality assessment of each included study was performed with the Newcastle-Ottawa scale (NOS) (http://www.ohri.ca/programs/clinical_epidemiology/oxford.asp). Any discrepancies were resolved by discussing with a third reviewer.
Statistical methods
RR with its corresponding 95% CI was used to evaluate the relationship between the BMI and incidence of prostate cancer. A random-effects model was adopted to account for both within- and between-study heterogeneity. For dose-response meta-analysis, we assigned the reported median or mean BMI level of each category to the corresponding RR. If medians or means were not available, the midpoint of the lower and upper bounds of that category was adopted. When the highest category was open-ended, the width of the category was assumed to be the same as the closest adjacent category [6]. The method proposed by Greenland and Longnecker [30] was used to estimate the dose-response trend for each study. These dose-response trends were then pooled with a random-effects meta-analysis. Finally, a potential non-linear dose-response relationship was also explored by using restricted cubic regression splines with three knots at the 25th, 50th, and 75th percentiles of the distribution [31].
Publication bias was evaluated by Begg’s test [32], Egger’s test [33] and a trim-fill analysis. Heterogeneity was assessed by Cochran’s Q (significance level was set to P < 0.10) and I2 [34]. Galbraith plot was used to identify the studies that contributed to the heterogeneity. Sensitivity analyses were performed by removing one study at a time and recalculating the pooled risk estimate for the remaining studies. Statistical analyses were completed with Stata version 10 (StataCorp, College Station, TX).
Author contributions
All authors contributed significantly to this work. B.X. and X.X. designed the research study; B.X., X.X., X.W. performed the research study and collected the data; B.X., X.X., X.W. analyzed the data; B.X. and X.W. wrote the first draft of the manuscript; All authors reviewed, edited and approved the manuscript.
ACKNOWLEDGMENTS
This study was supported by grants from the National Natural Science Foundation of China (8172500).
CONFLICTS OF INTEREST
None.
FINANCIAL INTEREST
The authors declare no competing financial interests.
REFERENCES
1. Torre LA, Bray F, Siegel RL, Ferlay J, Lortet-Tieulent J, Jemal A. Global cancer statistics, 2012. CA Cancer J Clin. 2015; 65:87–108. https://doi.org/10.3322/caac.21262.
2. Discacciati A, Wolk A. Lifestyle and dietary factors in prostate cancer prevention. Recent Results Cancer Res. 2014; 202:27–37. https://doi.org/10.1007/978-3-642-45195-9_3.
3. Mistry T, Digby JE, Desai KM, Randeva HS. Obesity and prostate cancer: a role for adipokines. Eur Urol. 2007; 52:46–53. https://doi.org/10.1016/j.eururo.2007.03.054.
4. Rodriguez C, Freedland SJ, Deka A, Jacobs EJ, McCullough ML, Patel AV, Thun MJ, Calle EE. Body mass index, weight change, and risk of prostate cancer in the Cancer Prevention Study II Nutrition Cohort. Cancer Epidemiol Biomarkers Prev. 2007; 16:63–9. https://doi.org/10.1158/1055-9965.EPI-06-0754.
5. Gong Z, Neuhouser ML, Goodman PJ, Albanes D, Chi C, Hsing AW, Lippman SM, Platz EA, Pollak MN, Thompson IM, Kristal AR. Obesity, diabetes, and risk of prostate cancer: results from the prostate cancer prevention trial. Cancer Epidemiol Biomarkers Prev. 2006; 15:1977–83. https://doi.org/10.1158/1055-9965.epi-06-0477.
6. Discacciati A, Orsini N, Wolk A. Body mass index and incidence of localized and advanced prostate cancer--a dose-response meta-analysis of prospective studies. Ann Oncol. 2012; 23:1665–71. https://doi.org/10.1093/annonc/mdr603.
7. Kelly SP, Graubard BI, Andreotti G, Younes N, Cleary SD, Cook MB. Prediagnostic Body Mass Index Trajectories in Relation to Prostate Cancer Incidence and Mortality in the PLCO Cancer Screening Trial. J Natl Cancer Inst. 2017; 109:1–9. https://doi.org/10.1093/jnci/djw225.
8. Bonn SE, Sjolander A, Tillander A, Wiklund F, Gronberg H, Balter K. Body mass index in relation to serum prostate-specific antigen levels and prostate cancer risk. Int J Cancer. 2016; 139:50–7. https://doi.org/10.1002/ijc.30052.
9. Moller H, Roswall N, Van Hemelrijck M, Larsen SB, Cuzick J, Holmberg L, Overvad K, Tjonneland A. Prostate cancer incidence, clinical stage and survival in relation to obesity: a prospective cohort study in Denmark. Int J Cancer. 2015; 136:1940–7. https://doi.org/10.1002/ijc.29238.
10. Grotta A, Bottai M, Adami HO, Adams SA, Akre O, Blair SN, Mariosa D, Nyren O, Ye W, Stattin P, Bellocco R, Trolle Lagerros Y. Physical activity and body mass index as predictors of prostate cancer risk. World J Urol. 2015; 33:1495–502. https://doi.org/10.1007/s00345-014-1464-5.
11. Rundle A, Jankowski M, Kryvenko ON, Tang D, Rybicki BA. Obesity and future prostate cancer risk among men after an initial benign biopsy of the prostate. Cancer Epidemiol Biomarkers Prev. 2013; 22:898–904. https://doi.org/10.1158/1055-9965.EPI-12-0965.
12. Bassett JK, Severi G, Baglietto L, MacInnis RJ, Hoang HN, Hopper JL, English DR, Giles GG. Weight change and prostate cancer incidence and mortality. Int J Cancer. 2012; 131:1711–9. https://doi.org/10.1002/ijc.27414.
13. Cerhan JR, Torner JC, Lynch CF, Rubenstein LM, Lemke JH, Cohen MB, Lubaroff DM, Wallace RB. Association of smoking, body mass, and physical activity with risk of prostate cancer in the Iowa 65+ Rural Health Study (United States). Cancer Causes Control. 1997; 8:229–38.
14. Discacciati A, Orsini N, Andersson SO, Andren O, Johansson JE, Wolk A. Body mass index in early and middle-late adulthood and risk of localised, advanced and fatal prostate cancer: a population-based prospective study. Br J Cancer. 2011; 105:1061–8. https://doi.org/10.1038/bjc.2011.319.
15. Giovannucci E, Rimm EB, Stampfer MJ, Colditz GA, Willett WC. Height, body weight, and risk of prostate cancer. Cancer Epidemiol Biomarkers Prev. 1997; 6:557-63.
16. Habel LA, Van Den Eeden SK, Friedman GD. Body size, age at shaving initiation, and prostate cancer in a large, multiracial cohort. Prostate. 2000; 43:136–43.
17. Kurahashi N, Iwasaki M, Sasazuki S, Otani T, Inoue M, Tsugane S. Association of body mass index and height with risk of prostate cancer among middle-aged Japanese men. Br J Cancer. 2006; 94:740–2. https://doi.org/10.1038/sj.bjc.6602983.
18. Le Marchand L, Kolonel LN, Wilkens LR, Myers BC, Hirohata T. Animal fat consumption and prostate cancer: a prospective study in Hawaii. Epidemiology. 1994; 5:276–82.
19. Littman AJ, White E, Kristal AR. Anthropometrics and prostate cancer risk. Am J Epidemiol. 2007; 165:1271–9. https://doi.org/10.1093/aje/kwm013.
20. Pischon T, Boeing H, Weikert S, Allen N, Key T, Johnsen NF, Tjonneland A, Severinsen MT, Overvad K, Rohrmann S, Kaaks R, Trichopoulou A, Zoi G, et al. Body size and risk of prostate cancer in the European prospective investigation into cancer and nutrition. Cancer Epidemiol Biomarkers Prev. 2008; 17:3252–61. https://doi.org/10.1158/1055-9965.EPI-08-0609.
21. Putnam SD, Cerhan JR, Parker AS, Bianchi GD, Wallace RB, Cantor KP, Lynch CF. Lifestyle and anthropometric risk factors for prostate cancer in a cohort of Iowa men. Ann Epidemiol. 2000; 10:361–9.
22. Schuurman AG, Goldbohm RA, Dorant E, van den Brandt PA. Anthropometry in relation to prostate cancer risk in the Netherlands Cohort Study. Am J Epidemiol. 2000; 151:541–9.
23. Stocks T, Hergens MP, Englund A, Ye W, Stattin P. Blood pressure, body size and prostate cancer risk in the Swedish Construction Workers cohort. Int J Cancer. 2010; 127:1660–8. https://doi.org/10.1002/ijc.25171.
24. Wallstrom P, Bjartell A, Gullberg B, Olsson H, Wirfalt E. A prospective Swedish study on body size, body composition, diabetes, and prostate cancer risk. Br J Cancer. 2009; 100:1799–805. https://doi.org/10.1038/sj.bjc.6605077.
25. Wright ME, Chang SC, Schatzkin A, Albanes D, Kipnis V, Mouw T, Hurwitz P, Hollenbeck A, Leitzmann MF. Prospective study of adiposity and weight change in relation to prostate cancer incidence and mortality. Cancer. 2007; 109:675–84. https://doi.org/10.1002/cncr.22443.
26. Presti JC Jr. Obesity and prostate cancer. Curr Opin Urol. 2005; 15:13–6.
27. Hammoud AO, Meikle AW, Reis LO, Gibson M, Peterson CM, Carrell DT. Obesity and male infertility: a practical approach. Semin Reprod Med. 2012; 30:486–95. https://doi.org/10.1055/s-0032-1328877.
28. Cunha GR, Hayward SW, Wang YZ, Ricke WA. Role of the stromal microenvironment in carcinogenesis of the prostate. Int J Cancer. 2003; 107:1–10. https://doi.org/10.1002/ijc.11335.
29. Severi G, Morris HA, MacInnis RJ, English DR, Tilley W, Hopper JL, Boyle P, Giles GG. Circulating steroid hormones and the risk of prostate cancer. Cancer Epidemiol Biomarkers Prev. 2006; 15:86–91. https://doi.org/10.1158/1055-9965.epi-05-0633.
30. Greenland S, Longnecker MP. Methods for trend estimation from summarized dose-response data, with applications to meta-analysis. Am J Epidemiol. 1992; 135:1301–9.
31. Orsini N, Li R, Wolk A, Khudyakov P, Spiegelman D. Meta-Analysis for Linear and Nonlinear Dose-Response Relations: Examples, an Evaluation of Approximations, and Software. Am J Epidemiol. 2011.
32. Begg CB, Mazumdar M. Operating characteristics of a rank correlation test for publication bias. Biometrics. 1994; 50:1088–101.
33. Egger M, Davey Smith G, Schneider M, Minder C. Bias in meta-analysis detected by a simple, graphical test. BMJ. 1997; 315:629–34.
34. Higgins JP, Thompson SG. Quantifying heterogeneity in a meta-analysis. Stat Med. 2002; 21:1539–58. https://doi.org/10.1002/sim.1186.