
INTRODUCTION
Cancer has generally been regarded as a general term to describe a group of diseases associated with abnormal cell growth with invasive and metastatic characteristics [1-3]. Based on statistics from the WHO, every year, more than 8.2 million people die from cancer, accounting for approximately 13% of deaths worldwide, indicating that cancer is one of the most threatening diseases in the world [4, 5]. According to a prediction of the WHO, in the next two decades, the incidence of cancer may be elevated by more than 70% [5]. Therefore, it is urgent to study the biological foundations of cancer and modify clinical treatment strategies [6]. However, more than 100 types of cancer have been identified, each of which need to be diagnosed and treated specifically [5]. Considering the complexity of cancer diagnosis and treatment, it is quite important to establish a convenient and effective method for the early detection and identification of various cancer subtypes.
Traditionally, detection and identification of cancers relied on three basic groups of testing methods: lab tests, imaging procedures and biopsies [7, 8]. Lab tests mainly pay attention to specific substances in the body and generally involve the detection of body fluids, including blood, urine, cerebrospinal fluid (CSF), and so on [9-11]. However, lab tests reflect the overall conditions of the body with the use of only a few markers for tumor screening, such as carcino-embryonic antigen, CEA and alpha fetoprotein, AFP [10]. Doctors cannot diagnose cancer only based on lab tests. For further detection, imaging procedures, including CT scan, nuclear scan, ultrasound, MRI and X-rays, are used [12-14]. With the help of such medical apparatuses, doctors can see deeper into the body, which may simplify the diagnosis of cancer. However, most screening is expensive and has potential pathogenic effects, though screening may be quite safe at normal doses. Such characteristics may impose restrictions on large-scale screening of cancer patients. Medical imaging can only be applied to patients with certain clinical symptoms or tumor markers identified by lab tests for further identification and classification. Biopsies have been widely regarded as the gold standard for tumor diagnosis. With a needle, an endoscope, or during surgery, doctors directly withdraw tissue or fluid from patients for further pathological diagnosis [15-17]. Although such testing methods can obtain accurate pathological information from the patients or the tumor itself for correct diagnosis, as an invasive detection method, it not only can be quite expensive and time-consuming but can also have a risk of infection [18-20]. Tumor patients with certain infections may not be suitable for such detection.
Recently, gene detection has been introduced for the detection and diagnosis of tumors. Based on the genetic characteristics of tumor cells, people can precisely classify tumors (even those with similar clinical symptoms) into different molecular subtypes, which can be treated by appropriate therapeutic strategies [21]. However, detection relies on tumor tissues, which can only be obtained by invasive methods, such as biopsies, which are unsuitable for large-scale detection and early screening. To solve this problem, a new concept, liquid biopsy, has been presented [16, 22-24]. Liquid biopsy is a specific detection method that relies on the sampling and analysis of non-solid tissues, including blood, lymphatic fluid and CSF [25]. Unlike traditional biopsy, such a detection system is nearly non-invasive, with comparable accuracy [22, 24]. The combination of gene detection and liquid biopsies provides us with a new effective tool for accurate and non-invasive detection of tumors. In addition, it is suitable for large-scale detection and early screening. However, to apply such effective methods for tumor diagnosis, identification of effective markers turn out to be the premise problem for further development of liquid biopsy.
Based on multi-omics data, various approaches have been presented to identify and distinguish different tumor subtypes. In 2015, Zhang et al. reported an effective computational method to classify ten types of major cancer subtypes that threaten human health by reverse phase protein array profiles, implying the availability and feasibility of tumor detection by protein profiling [26]. Further, late in 2016, Zhang et al. presented a systematic analysis algorithm that contributes to the classification of cancers based on the copy number variation (CNV) landscape, confirming that the CNV landscape may also be an effective detection index for tumor classification [27]. Apart from such an analysis at the genomic and proteomic level, Best et al. reported an effective method to distinguish cancer subtypes solely based on RNA-seq results of tumor-educated platelets, a functional blood component that can be easily obtained by liquid biopsy [28]. Tumor-educated platelets contain specific pre-mRNAs of the bone marrow, spliced circulating mRNAs of primary and metastatic tumors, and specific spliced mRNAs of the platelets themselves induced by the tumor microenvironment, making tumor-educated platelets a perfect source for liquid biopsy. Such fundamental research achievements confirmed that the combination of genetic characteristics (either DNA-seq or RNA-seq results) and liquid biopsy might accomplish non-invasive, early detection and identification of different tumor subtypes. However, many markers and genes are redundant, and the genes that can be detected for diagnosis in liquid biopsy are limited [28]. Therefore, it is urgent to provide a computational method to analyze such data, thereby screening core and aberrantly expressed genes for further detection.
In this study, based on the RNA-seq results of tumor-educated platelets, we applied computational methods to screen core mRNA markers that can distinguish cancer subtypes from healthy controls. The gene expression profiles of blood from patients who had one of six cancer subtypes and healthy persons were analyzed by maximum relevance minimum redundancy (mRMR) [29]. Upon further analysis of the feature lists yielded by the mRMR method, eighteen important genes were extracted that may be essential biomarkers for the classification of cancer subtypes and healthy controls. In addition, an optimal classification model using a support vector machine (SVM) algorithm [30, 31] as the classifier was built, which provided good performance with an overall accuracy of 0.751 for diagnosing different cancer types and healthy controls.
RESULTS
Results of the mRMR method
In this study, each patient or healthy sample was represented by 13,445 features as described in Section “Dataset and feature construction”, each of which indicates the expression level of some gene. To analyze them, the mRMR method was employed. According to the relevance between features and targets, all features were ordered in the MaxRel feature list, in which features with high relevance to targets obtained high ranks. In addition, another feature list, mRMR feature list, was also yielded by the mRMR method by further considering the redundancies between features. These two lists are provided in Supplementary Table 1 and 2, respectively.
Results of the IFS method
The IFS method was applied to the mRMR feature list yielded by the mRMR method to identify optimal features for classification. In this method, several feature sets were constructed, which consisted of some first features in the mRMR feature list. Then, for each feature set, the SVM was executed on the dataset, in which samples were represented by feature in the set. However, testing all of the possible feature subsets would take much time due to our limited computational power because 13,445 features were used in this study. In view of this, we designed an IFS method that contained two stages. In the first stage, we only tested some special feature subsets to determine the possible range of optimal features. In the second stage, all of the feature subsets in the possible range were tested to identify the optimal feature subset.
In the first stage, we tested the feature subsets Fi, where i is a multiple of ten, i.e., the numbers of features in these subsets were multiples of ten. For each of these feature subsets, the SVM was executed on all samples that were represented by features in this subset, with its performance evaluated by ten-fold cross-validation. The predicted results were counted as accuracies and specificity, as mentioned in Section “Measurements”. After all of these feature subsets had been tested, several accuracies and specificities were obtained, which are provided in Supplementary Table 3 and 4. Because the overall accuracy TACC was selected as the major measurement, we plotted a curve, namely, an IFS-curve, with TACC as the Y-axis and the number of features as the X-axis, which is shown in Figure 1, to extract the feature subset that can yield the best performance for the SVM. It can be observed that the IFS-curve first follows a sharp increasing trend and reaches the maximum overall accuracy (0.747) when 2030 features were used before becoming stable and following a slow decreasing trend. The high overall accuracies (no less than 0.740) all clustered at approximately 2100. Thus, we believed that the possible range of optimal features was between 2000 and 2200.
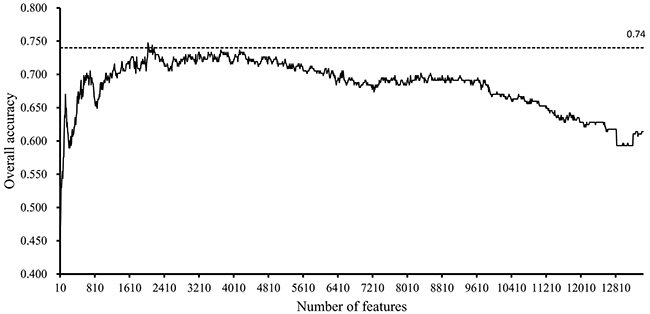
Figure 1: IFS-curves for the results yielded in the first stage of the IFS method. The Y-axis represents the overall accuracy, and the X-axis represents the number of features used for classification. The high overall accuracies (no less than 0.740) all cluster between 2000 and 2200.
In the second stage, we further tested the feature subsets Fi with 2000≤i≤2200. The obtained accuracies and specificities mentioned in Section “Measurements” are provided in Supplementary Table 5 and 6. For ease of observation, we plotted a curve with the overall accuracy (TACC) as the Y-axis the number of features as the X-axis, as shown in Figure 2. We can see that the highest TACC was 0.751 when the top 2,047 features in the mRMR feature list were used for classification. Thus, these features were deemed to be optimal features and comprised the optimal feature subset. By using these optimal features, an optimal classification model was built. The detailed performance of this model is shown in Figure 3. It can be seen that the specificity for each class is quite high (more than 0.920) and the prediction accuracy for each class (i.e., sensitivity) is quite high, except for the accuracy for hepatobiliary cancer. The possible reason for the low accuracy of hepatobiliary cancer may be the small size of this class, which only contained fourteen samples, while the other classes contained at least 35 samples (more than twice as many samples than those available for hepatobiliary cancer).
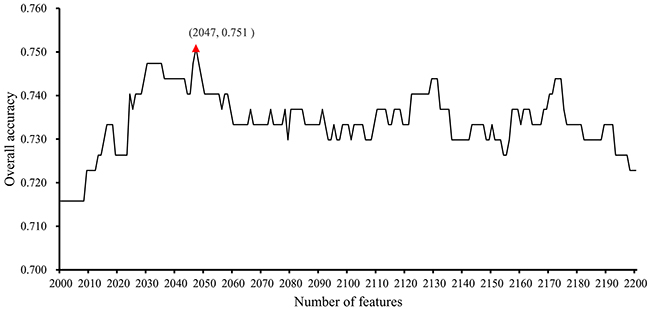
Figure 2: IFS-curves for the results yielded in the second stage of the IFS method. The Y-axis represents the overall accuracy, and the X-axis represents the number of features used for classification. The highest overall accuracy was 0.751 when 2047 features were used.
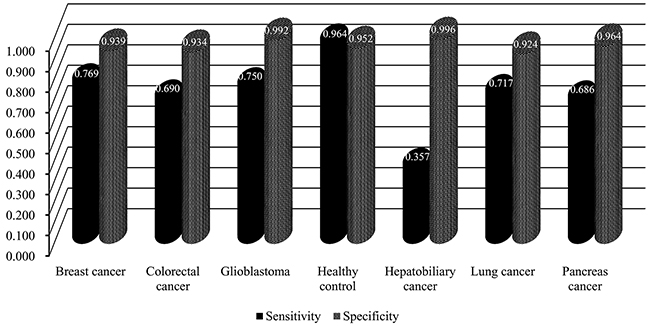
Figure 3: The performance of the optimal classification model evaluated by ten-fold cross-validation.
Comparison with commercial cancer detection panels
There are already some commercial cancer detection panels. Here, we collected cancer panel genes from the following seven commercial cancer detection panels: (I) CancerNext (http://www.ambrygen.com/tests/cancernext), (II) CancerNextExpanded (http://www.ambrygen.com/tests/cancernext-expanded, (III) CloudHealth (http://en.chgenomics.com/products/hereditary), (IV) GeneDx (https://www.genedx.com/test-catalog/available-tests/comprehensive-cancer-panel/), (V) Illumina (https://www.illumina.com.cn/products/by-type/clinical-research-products/trusight-rna-pan-cancer.html), (VI) NanoString (https://www.nanostring.com/products/gene-expression-panels/hallmarks-cancer-gene-expression-panel-collection/pancancer-pathways-panel), (VII) xGen (https://www.idtdna.com/pages/products/nextgen/target-capture/xgen-lockdown-panels/xgen-pan-cancer-panel). The retrieved genes from these seven panels were provided in Supplementary Table 7.
Using the same procedures for building the optimal classification model mentioned in Section “Results of the IFS method”, genes retrieved from each panels can yield an optimal classification model. The performance of these classification models are listed in Table 1, from which we can see that the performance of these models were much inferior to the proposed model.
Table 1: The performance of the optimal classification models using different reference gene sets
Reference gene set |
TACC |
|---|---|
This study |
0.751 |
Genes in CancerNext |
0.407 |
Genes in CancerNextExpanded |
0.463 |
Genes in CloudHealth |
0.421 |
Genes in GeneDx |
0.400 |
Genes in Illumina |
0.656 |
Genes in NanoString |
0.618 |
Genes in xGen |
0.519 |
Important genes
For the MaxRel feature list yielded by the mRMR method, extensive investigation of some of the top features may lead to novel biomarkers for distinguishing different cancer patients. In the MaxRel feature list, each feature was measured by an MI value. A feature with a high MI value indicates that it is quite important. Thus, we set a threshold of 0.360 to select important features, i.e., features with MI values larger than 0.360 were extracted, corresponding to the eighteen genes listed in Table 2. We also investigated ranks of these eighteen genes in the mRMR feature list and listed them in the last column of Table 2. It can be seen that the maximum rank was 122, indicating that these important eighteen genes were all in the optimal feature subset that consisted of the top 2,047 features in the mRMR feature list. It can partly prove that these eighteen genes were quite essential for classification of six cancer subtypes and healthy samples. In the following section, these features were extensively analyzed to uncover the differences of the biological processes and molecular functions between the six cancer subtypes and healthy samples.
Table 2: The top 18 features in the MaxRel feature list
Order |
Feature name |
Gene name |
Description |
MI value |
Rank in the mRMR feature list |
|---|---|---|---|---|---|
1 |
ENSG00000155657 |
TTN |
Titin |
0.416 |
1 |
2 |
ENSG00000008988 |
RPS20 |
Ribosomal Protein S20 |
0.407 |
13 |
3 |
ENSG00000177600 |
RPLP2 |
Ribosomal Protein Lateral Stalk Subunit P2 |
0.405 |
6 |
4 |
ENSG00000211772 |
TRBC2 |
T Cell Receptor Beta Constant 2 |
0.396 |
19 |
5 |
ENSG00000168028 |
RPSA |
Ribosomal Protein SA |
0.393 |
35 |
6 |
ENSG00000142534 |
RPS11 |
Ribosomal Protein S11 |
0.384 |
64 |
7 |
ENSG00000142676 |
RPL11 |
Ribosomal Protein L11 |
0.381 |
48 |
8 |
ENSG00000105193 |
RPS16 |
Ribosomal Protein S16 |
0.380 |
57 |
9 |
ENSG00000160654 |
CD3G |
CD3g Molecule |
0.379 |
25 |
10 |
ENSG00000168421 |
RHOH |
Ras Homolog Family Member H |
0.373 |
3 |
11 |
ENSG00000139193 |
CD27 |
CD27 Molecule |
0.369 |
8 |
12 |
ENSG00000131469 |
RPL27 |
Ribosomal Protein L27 |
0.368 |
106 |
13 |
ENSG00000163682 |
RPL9 |
Ribosomal Protein L9 |
0.368 |
86 |
14 |
ENSG00000071082 |
RPL31 |
Ribosomal Protein L31 |
0.367 |
78 |
15 |
ENSG00000149311 |
ATM |
ATM Serine/Threonine Kinase |
0.367 |
17 |
16 |
ENSG00000149806 |
FAU |
FAU, Ubiquitin Like And Ribosomal Protein S30 Fusion |
0.366 |
31 |
17 |
ENSG00000109475 |
RPL34 |
Ribosomal Protein L34 |
0.366 |
122 |
18 |
ENSG00000089009 |
RPL6 |
Ribosomal Protein L6 |
0.366 |
117 |
DISCUSSION
In Section “Important genes”, eighteen important genes, listed in Table 2, were extracted. These 18 genes are deemed to be important for distinguishing six cancer subtypes and healthy samples. Figure 4 shows the heat map of all samples using the important eighteen genes. It can be seen that the healthy samples were clearly clustered together and among the cancer samples, the Glioblastoma samples were most similar with healthy samples. Generally based on our results, we summarized two specific biological and functional characteristics of various functional genes have been predicted. First, various immune associated genes like CD3G have been predicted, indicating the distinctive expression pattern in tumor and normal tissues. During the tumorigenesis of various cancer subtypes, like breast cancer, colorectal cancer, glioblastoma, the immune system of patients have been confirmed to be systemically suppressed, especially in the tumor microenvironment (cancer adjacent tissues) [32-34]. Therefore, it is quite reasonable to predict genes that contributing to immune reaction as potential differentially expressed genes and biomarkers. Another specific characteristic turns out to be that glioblastoma as a brain cancer has the most similar expression pattern with normal patients based on liquid biopsy of blood platelet. Recent publications confirmed that during the initiation and progression of brain cancer like glioblastoma, the Blood Brain Barrier (BBB) acts as an effective protective screen, preventing the spread of characteristic biomarkers from the brain to the circulating system, resulting in the major liquid biopsy biomarkers that have been identified are mostly based on cerebrospinal fluid detection [35, 36]. Therefore, the expression profile of blood platelet from brain cancer patients and normal controls may appear to be the most similar, comparing to other cancer subtypes. Here, in our study, based on detailed expression profiling data, we successfully validated the similarity between the blood biopsy result of brain cancer patients and normal controls and further identified the potential biomarkers that can recognize brain cancer patients, confirming that similar as blood expression pattern of brain cancer patients with normal controls, there still remain potential biomarkers to reflect the tumorigenesis processes. As for elaborating biological processes that the important gene may participate in, the detailed analysis of each functional gene can be seen below.
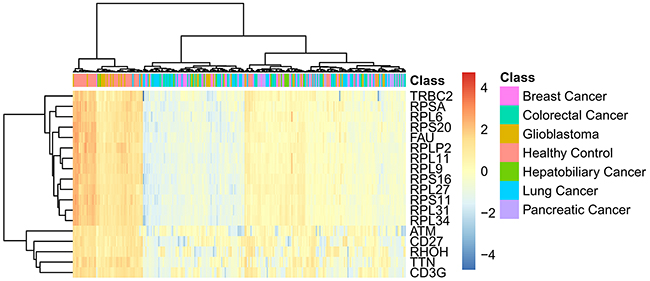
Figure 4: The heat map of all samples using the important eighteen genes.
Based on recent publications, the specific functions of these genes and the specific biological processes that these genes participate in, it can be confirmed that these genes may form grouping standards for cancer subtype identification and differential diagnosis. For clarity, these eighteen genes were clustered into three groups, as shown in Figure 5. The following sections analyze the genes we extracted and divided into different groups one by one.
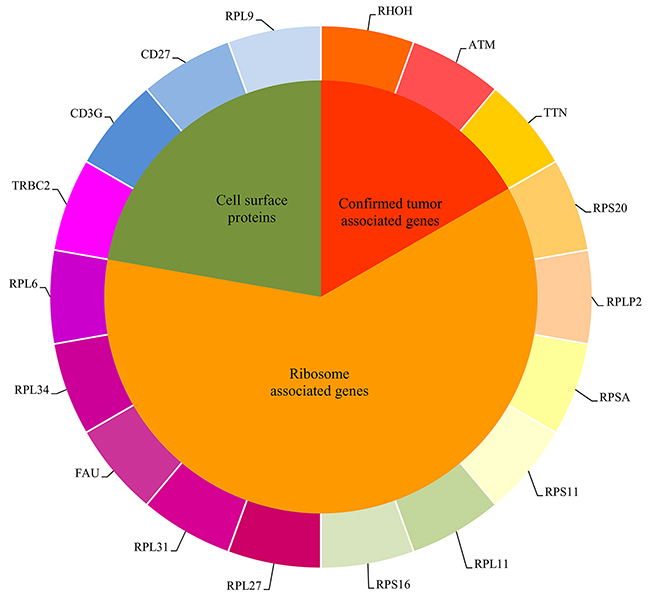
Figure 5: The eighteen important genes found in the MaxRel feature list were clustered into three groups.
Confirmed tumor associated genes
Among the eighteen genes, a specific oncogene, TTN (ENSG00000155657), has been regarded as a crucial marker for the distinction of six cancer subtypes and healthy controls. Encoding the protein Titin, this gene has been confirmed to contribute to platelet activation and cardiac conduction [37, 38]. This gene has also been reported to be a specific cancer-associated gene that can distinguish healthy controls from the other six subgroup of cancers, which all have been confirmed by recent publications [39-41]. Recent publications also confirmed that TTN might affect the composition of serum proteins, as it is expressed in hematopoietic cells, thus implying that TTN can be used as a potential marker in liquid biopsies [42]. Another gene, ENSG00000168421, is the tumor suppressor RHOH, a member of the Ras superfamily. Considering that this gene is expressed in hematopoietic cells, it is quite suitable for it to act as a liquid biopsy marker for the differential diagnosis of tumor [43, 44]. Although this gene has been confirmed to contribute to tumorigenesis, there are few reports on it. This implies that, currently, RHOH can only be used to differentiate between tumor samples and normal controls. ATM, Ataxia Telangiectasia Mutated serine/threonine kinase (ENSG00000149311), has been widely reported to contribute to the regulation of the cell cycle as a member of the PI3/PI4-kinase family [45, 46]. Based on recent publications, this tumor-associated gene contributes to abnormal proliferation and invasion of tumor cells in multiple tumor subtypes [47, 48]. Furthermore, a 2013 Blood report showed that ATM might participate in the secretion of exosomes during tumorigenesis and angiogenesis, confirming the possibility of its early detection by liquid biopsy [49]. Among our candidate subtypes, this gene has been confirmed to contribute to all six cancer subtypes, implying that this gene may be a functional marker to distinguish healthy samples from specific cancer subtypes [50-55].
Ribosome associated genes
For a long time, ribosome associated genes which contribute to ribosome biogenesis have been confirmed to be a group of functional tumor associated genes regulating the proliferation rate of tumor cells [56, 57]. Among the important eighteen genes, some were ribosome associated genes. RPS20 (ENSG00000008988) has also been predicted to be a candidate biomarker. This gene has been reported to encode a ribosomal protein component of the 40S subunit [58, 59]. Different from genes that contribute to all six cancer subtypes, RPS20 has only been identified in limited cancer subtypes, including colorectal cancer and glioblastoma [60, 61]. Therefore, in our seven types of samples, this gene can distinguish colorectal cancer and glioblastoma from the other four cancer subtypes and healthy controls. Further research on this gene also confirmed that it can be identified in exosomes of colorectal carcinoma, which can be further detected by liquid biopsy, validating our prediction [62]. As another ribosome associated gene, RPSA (ENSG00000168028) may also be differentially expressed in our candidate seven groups. Based on recent publications, this gene has only been identified in colorectal cancer, lung cancer, esophageal squamous cancer and acute leukemia [63]. As for the six candidate cancer subtypes and healthy controls in our study, RPSA can distinguish colorectal cancer and lung cancer from the other subtypes [63, 64]. Similarly, another ribosome-associated gene, RPS11 (ENSG00000142534), has also been found to be a candidate biomarker. This gene also encodes a specific component of the 40S subunit. Recent publications have identified it in breast cancer, glioblastoma, lung cancer and colorectal cancer, allowing us to distinguish samples of those four cancers from hepatobiliary cancer samples and normal controls [60, 65, 66]. Similarly, as a homologue of RPS11 analyzed above, RPS16 (ENSG00000105193) was also listed as a candidate biomarker in our study. Like RPS11, this gene encodes a ribosomal protein that is a component of the 40S subunit. According to recent publications, various systematic diseases have been attributed to RPS16, including Diamond-Blackfan Anemia and cancer [67-69]. Furthermore, based on recent publications, only hepatobiliary cancer has been reported to be associated with abnormal functions of this gene, as detected in blood samples, implying that this gene can be a candidate liquid biopsy marker for hepatobiliary cancer [68]. Similar to RPS20, as analyzed above, all of the homologues of RPS20 can also be functional components of exosomes, implying the differentiated role of RPS20 and its homologues for the detection of cancer by liquid biopsy [70, 71].
ENSG00000177600, RPLP2, also has ribosome-associated functions. This gene encodes a component of the 60S subunit [72]. Based on recent publications, this gene has been identified in the blood component of only three tumor subtypes in our study: colorectal cancer, breast cancer and hepatobiliary cancer, indicating its potential contribution to pathological typing [73-75]. As another component of the 40S subunit, RPL11 (ENSG00000142676) encodes another sub-component of the ribosome 40S subunit. Based on recent publications, this gene has been confirmed to contribute to the RPL11-HDM2-p53 nucleolar stress response pathway, which is coupled with the Akt/mTORC1 signaling axis, implying its function during tumorigenesis [76]. However, based on recent findings, there is no direct evidence for RPL11 to contribute to one or a few specific cancer subtypes, implying that it can only differentiate between the normal control and the other six subtypes of cancers. Combined with its specific expression in exosomes, RPL11 may be an effective biomarker for tumor liquid biopsy, validating our prediction [77]. Similarly, RPL31 (ENSG00000071082), as a functional component of the 60S ribosome, has also been confirmed to be a candidate biomarker [78]. Until now, this gene has only been identified in four cancer subtypes: breast cancer, prostate cancer, pancreatic cancer and gastric carcinoma [69, 79-83]. Therefore, considering the specific expression profile of RPL31 in exosomes, it is quite reasonable to use this gene as a crucial standard for the further classification of different tumor subtypes, distinguishing breast cancer and pancreatic cancer from the other four specific cancer subtypes and healthy controls.
FAU, as a ubiquitin-like and ribosomal protein S30 fusion (ENSG00000149806), has been wildly reported to contribute to the biological processes related to Finkel-Biskis-Reilly (FBR)-murine sarcoma virus as a potential secretory protein [84, 85]. This gene has been confirmed to contribute to the initiation of breast cancer, implying that it may be a functional biomarker for the identification and differential diagnosis of breast cancer [86]. ENSG00000109475, RPL34, has also been predicted to be a candidate gene to distinguish between the six cancer subtypes and healthy control. As another ribosomal protein, this gene has only been identified in lung cancer and gastric cancer. Furthermore, this gene has also been identified in the extracellular environment in a mouse model [87]. Thus, it may act as a potential liquid biopsy biomarker for the further classification of candidate tumor subtypes [88, 89]. RPL6 (ENSG00000089009) is also a component of the 60S ribosome. Based on the existing literature, this gene has been identified in colorectal cancer, lung cancer, breast cancer and gastric cancer, implying its potential as a typing marker for distinguishing colorectal cancer, breast cancer and lung cancer from the other three cancer subtypes and healthy control [90-92]. Similar to other ribosomal protein ligands, RPL6 has also been identified in the exosome as a functional ribosome associated component, implying that RPL6 may be a potential biomarker. RPL27 (ENSG00000131469) is a crucial component of the 60S subunit [93, 94]. In gastric cancer, head and neck squamous cell carcinoma, oral squamous cell carcinoma, hepatobiliary cancer and breast cancer, this gene has been confirmed to contribute to the initiation and progression of tumors, with specific expression in bodily fluids, including blood [95-99].
Cell surface proteins (receptors and antigens)
Cell surface proteins can be generally divided into receptors and antigens based on their specific biological functions. Based on recent publications, such two group of proteins have been confirmed to be differentially expressed in tumor comparing to normal cells, which can be attributed to the different biological function and recognition mechanism of tumor cells. Differential expressed proteins not only act as potential biomarkers for tumor identification and classification but also reflect the diverse potential oncogenic mechanisms of different tumor subtypes. TRBC2, ENSG00000211772, encodes a specific region of the T-cell receptor beta-2 chain [100]. Based on recent publications, this gene has also been identified in multiple cancer subtypes, including the six cancer subtypes used in this study, implying that this gene is a crucial marker for the distinction of cancer patients and healthy controls. ENSG00000160654, CD3G, has also been extracted as a candidate biomarker. CD3G has been widely reported to participate in antigen recognition associated biological processes, coupling antigen recognition to specific intracellular signal transduction pathways [101, 102]. Encoding a specific protein that can be easily detected by liquid biopsy, CD3G has been confirmed to be differentially expressed, and may be a direct target of different functional microRNA targets different subtypes [103]. In breast cancer and colorectal cancer, this gene has been confirmed to be differentially expressed compared to normal controls, implying that CD3G can distinguish breast cancer and colorectal cancer samples from other tumor subtypes and normal controls [103]. Considering that CD3G and its regulatory miRNAs have already been detected in peripheral blood, it may be reasonable to use CD3G as a potential biomarker for liquid biopsy, validating our prediction [103]. Another cluster of differentiation (CD) protein, CD27 (ENSG00000139193), was also found in this study. As a member of the TNF-receptor superfamily, this gene has been identified in various cancer subtypes, including glioblastoma, breast cancer and colorectal cancer, but not lung cancer, pancreatic cancer or hepatobiliary cancer, by blood detection [104, 105]. Other studies have also confirmed that during tumorigenesis, CD27-containing exosomes can be identified in the peripheral blood of patients suffering from various cancer subtypes, validating the applicability and practicability of our predicted biomarkers [106]. Considering the differential expression of this gene in different cancer subtypes, it is quite reasonable to regard this gene as a potential biomarker for differential diagnosis. RPL9, or ribosomal protein L (ENSG00000163682), may also contribute to the classification of cancer subtypes and normal control based on the liquid biopsy results. As a ribosome-associated gene of the 60S subunit, this gene has been reported to contribute to various cancer subtypes, including lung cancer, hepatobiliary cancer, breast cancer and colorectal cancer, but not glioblastoma or pancreatic cancer [107]. Therefore, this gene can be a useful marker to distinguish glioblastoma, pancreatic cancer and healthy samples.
This study attempted to identify novel biomarkers (genes) that contribute to the classification of different cancer subtypes by analyzing gene expression data from RNA-seq results through computational methods. Eighteen identified genes were found to be differentially expressed in six cancer subtypes and healthy controls. All of these biomarkers were further classified into three groups, implying their crucial roles for tumorigenesis. In addition, we also propose an optimal classification method for the identification of six cancer subtypes and healthy controls, which can be a novel tool for diagnosing different cancer subtypes.
MATERIALS AND METHODS
Dataset and feature construction
We downloaded gene expression profiles of blood from 285 samples from the Gene Expression Omnibus (GEO) under the accession number GSE68086 [28]. These 285 samples were collected from patients who had one of the following cancer subtypes: breast cancer, colorectal cancer, glioblastoma, hepatobiliary cancer, lung cancer, or pancreatic cancer or from healthy controls. The detailed number of samples in each cancer subtype or healthy samples is listed in Table 3.
Table 3: Breakdown of 285 RNA-seq samples
Cancer subtype |
Number of samples |
|---|---|
Breast cancer |
39 |
Colorectal cancer |
42 |
Glioblastoma |
40 |
Hepatobiliary cancer |
14 |
Lung cancer |
60 |
Pancreatic cancer |
35 |
Healthy control |
55 |
Because the expression levels of some genes from the 285 samples are quite weak, we discarded genes whose expression level in more than 90% of samples was zero, leaving 13,445 genes. Thus, each sample can be represented by 13,445 features, each of which indicates the expression level of a gene in the sample. Furthermore, the gene expression profiles were processed with quantile normalization and log2 transformed. The purpose of this study was to find optimal blood biomarkers for distinguishing various cancer patients.
Feature selection method
As mentioned in Section “Dataset and feature construction”, all samples were represented by the expression levels of 13,445 genes. By extensively analyzing the samples, we can extract the genes that may be important biomarkers for different cancer subtypes. In this study, we employed a widely used and reliable feature selection method, the mRMR method [29], which has been applied to address different complicated biological and medical problems [108-121].
The mRMR method is a mutual information (MI) based feature selection method. The correlations between features and targets are evaluated by the following MI equation:
where p(x, y) is the joint probabilistic density and p(x) and p(y) are the marginal probabilistic densities. A large MI value means that two variables have a strong correlation. The mRMR method evaluates each feature based on its relevance to targets and its redundancy to other features. Thus, two excellent criteria are used in the mRMR method: Max-Relevance and Min-Redundancy. The former indicates the importance of each feature based on its relevance to targets, while the latter assesses the importance of each feature using its redundancy to other features. By these two criteria, the mRMR method can produce two feature lists, the MaxRel feature list and mRMR feature list, in which all features are ranked rigorously. The MaxRel feature list ranks features according to their relevance to targets, i.e., features are ranked in this list by the decreasing order of their MI values to targets. Production of the mRMR feature list is listed below and shown in Figure 6.
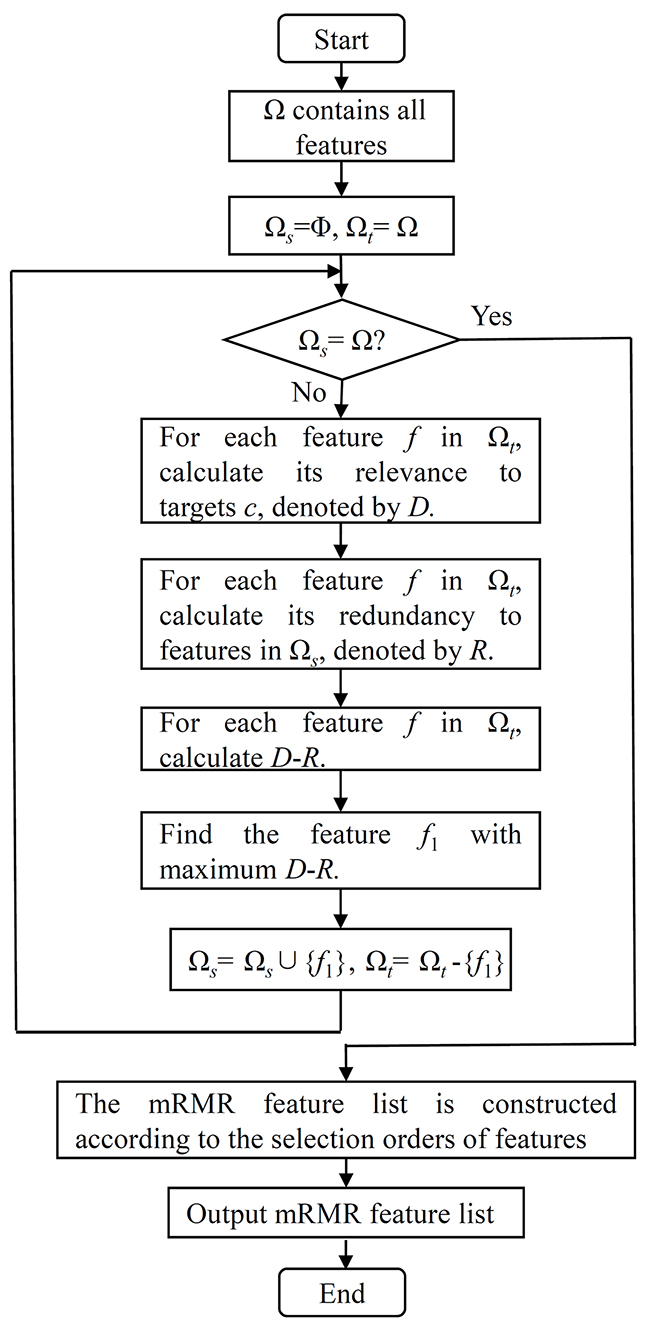
Figure 6: The flow chart of constructing the mRMR feature list in the mRMR method.
Given a dataset with N features, let Ω be a set consisting of all N features, Ωs be a set containing selected features and Ωt be the set consisting of the remaining features, i.e., Ωt=Ω-Ωts. Initially, Ω s is set to be an empty set and all features are in Ωt. Then, a loop procedure is executed to move the features in Ωt one by one to Ωs. For each feature f in Ωt, its relevance to targets c is calculated by D = I(f, c) and its redundancy to features in Ωs is calculated by (). Because both the criteria of Max-Relevance and Min-Redundancy are considered when producing the mRMR feature list, we further calculate D-R for each feature in Ωt. The feature with the maximum D-R is selected and moved from Ωt to Ωs. When all of the features are in Ωs, the loop procedure stops. Accordingly, the mRMR feature list can be ordered according to the selection orders of features, i.e., the first selected feature occupies the first place, followed by the second selected feature, the third selected feature, and so forth. For formulation, the mRMR feature list was formulated as
The mRMR method only provides two feature lists for a given dataset. Clearly, the mRMR feature list can be used to extract the optimal subset of features for building an optimal classification model. Furthermore, a feature with a high rank in the mRMR feature list is more important for classification. However, we do not know how many top features in this list should be selected. To determine how many top features in this list should be selected, the incremental feature selection (IFS) method was employed in this study. This method evaluates the importance of several feature sets that contain some of the top features in F by testing their discriminating power in a classification algorithm.
In detail, for a feature set, say Fi = {f1,f2,…,fi}, containing the top i features in F, all samples are represented by the features in Fi. Then, a classification algorithm is executed on these samples with its performance evaluated by one of the cross-validation methods [122-128]. After all of the possible feature sets have been tested, the feature set yielding the best performance can be found. This feature subset is deemed to be the optimal feature subset, and the features in this subset are called optimal features. At the same time, an optimal classification model can be built, which adopts the optimal features to represent samples. However, in many cases, it is quite time-consuming to test all possible feature subsets because there are too many possible feature subsets. In this case, only a part of possible feature subsets were tested. The obtained feature subset in this case is still called the optimal feature subset and the constructed classification model is still termed the optimal classification model for convenience.
Classification algorithm
In the aforementioned IFS method, a classification algorithm is necessary. Here, we selected the classic machine learning algorithm, support vector machine (SVM) algorithm [30, 31]. This algorithm maps all samples into a higher dimensional space, in which these samples can be perfectly classified by a hyper-plane. Until now, several types of SVM algorithms have been proposed to tackle different types of classification problems. In this study, we chose to use the SVM algorithm trained by the sequential minimal optimization (SMO) algorithm [129] proposed by Platt. To train the SVM, a large quadratic program (QP) must be solved. The SMO algorithm breaks the large QP problem into several smallest QP problems and solves these QP sub-problems analytically. This procedure can avoid the storage of matrix and using the time-consuming numerical QP optimization as an inner loop. To quickly implement this type of SVM, we directly employed the classifier, SMO, in Weka [130] using its default parameters.
Measurements
As mentioned in Section “Classification algorithm”, the SVM was adopted as the prediction engine. Ten-fold cross-validation [122] was employed to evaluate the performance of the SVM on different feature subsets. In this cross-validation method, the original dataset is randomly and equally divided into ten parts. Samples in each part are singled out as testing samples, and the remaining samples are used to train the classification model. Thus, each sample is tested exactly once. Compared with another cross-validation method, jackknife test [124, 131], ten-fold cross-validation needs much less time and yields similar results in most cases. Because our computational power was limited, we selected ten-fold cross-validation rather than jackknife test to evaluate the performance of the SVM in this study.
As listed in Table 1, all samples were classified into seven classes. To assess the predicted results yielded by a classification model, the prediction accuracy for the j-th class, denoted as ACCj, can be calculated as
where xj represents the number of samples that are predicted correctly in the j-th class and Xj represents the total number of samples in the j-th class. In addition, we can calculate the overall accuracy, denoted as TACC, to assess the performance of the classification model on the whole, which can be computed by
Clearly, the overall accuracy can be appropriately used as the major measurement to evaluate the performance of each classification model. The prediction accuracy of each class was also provided in this study as references.
Besides, to further analyze the predicted results yielded by each classification model, we calculated the sensitivity (SN) and specificity (SP) for the j-th class, which were defined as follows:
where TPj represented the number of correctly predicted samples in the j-th class, FNj represented the number of incorrectly predicted samples in the j-th class, FPj represented the number of samples in other classes that were predicted to be in the j-th class, and TNj represented the number of samples in other classes that were not predicted to be in the j-th class. It is easy to see that the sensitivity of one class is same as the prediction accuracy of that class.
Author contributions
LDH, YDC and XYK conceived and supervised this project. TH and LC do the experiment. LC and YHZ analyzed the data. LC, YCX and YHZ drafted the manuscript. YCX and YH modified and polished the manuscript.
ACKNOWLEDGMENTS
The computational data analysis in this study was supported by Shanghai University.
CONFLICTS OF INTEREST
No potential conflicts of interest were disclosed.
FUNDING
This work was supported by grants from the innovation team project of contractual employed principle investigators of Shanghai Jiao Tong University Affiliated Sixth People’s Hospital and Institute of Health Sciences, Shanghai Institutes for Biological Sciences, Chinese Academy of Sciences, the Frontier Science Research Plan (QYZDJ-SSW-SMC01) and Strategic Priority Research Program (A) (XDA12010203) of China Academic of Sciences, the National Natural Science Foundation of China (31371335), the Natural Science Foundation of Shanghai (17ZR1412500), the Shanghai Sailing Program and the Youth Innovation Promotion Association of the Chinese Academy of Sciences (CAS) (2016245).
REFERENCES
1. Krishnan A, Nair SA, Pillai MR. Biology of PPAR gamma in cancer: A critical review on existing lacunae. Current molecular medicine. 2007; 7:532-540.
2. Carney DN. The Biology Of Lung-Cancer - a Review. Acta Oncol. 1989; 28:1-5.
3. Shaw P, Costa J. Molecular-Biology Of Colon Cancer - (Review). Anticancer Research. 1989; 9:21-27.
4. Parsons HM, Harlan LC, Schmidt S, Keegan TH, Lynch CF, Kent EE, Wu XC, Schwartz SM, Chu RL, Keel G, Smith AW, AYA HOPE Collaborative Group. Who Treats Adolescents and Young Adults with Cancer? A Report from the AYA HOPE Study. J Adolesc Young Adul. 2015; 4:141-150.
5. McGuire S. World Cancer Report 2014. Geneva, Switzerland: World Health Organization, International Agency for Research on Cancer, WHO Press, 2015. Adv Nutr. 2016; 7:418-419.
6. Schmitz-Drager BJ, Droller M, Lokeshwar VB, Lotan Y, Hudson MA, van Rhijn BW, Marberger MJ, Fradet Y, Hemstreet GP, Malmstrom PU, Ogawa O, Karakiewicz PI, Shariat SF. Molecular Markers for Bladder Cancer Screening, Early Diagnosis, and Surveillance: The WHO/ICUD Consensus. Urol Int. 2015; 94:1-24.
7. Thriumani R, Zakaria A, Omar MI, Adom AH, Sharaff AY, Kamaruddin LM, Yusuf N, Helmy KM. Review on Exhaled Volatile Organic Compounds from Lung Cancer and Advances of E-Nose as Non-Invasive Detection Method. 2014 Ieee 5th Control And System Graduate Research Colloquium (Icsgrc). 2014; 213-218.
8. Davies DF. A Review Of Detection Methods for Early Diagnosis Of Lung Cancer. J Chron Dis. 1966; 19:819-845.
9. Patel NM, Weiss J. Advanced Lab Testing in Lung Cancer. Oncology-Ny. 2016; 30:348-352.
10. Smyth C, Bhan JM, Dhaliwal AS, Sorokina T, Alarcon M, Levitz JS. CA 19-9 and ALP as potential biomarkers for pancreatic cancer risk: Analysis from a large lab test database. Journal Of Clinical Oncology. 2015; 33:abstr e15211.
11. Bohn OL, Navarro L, Ayaquica C, Saldivar J, Sanchez-Sosa S. HER2 2+Breast Cancer in Mexico, Central America and the Caribbean: Re-Testing Results by a Central Lab. Modern Pathol. 2009; 22:31a.
12. Sun Z, Yi YL, Liu Y, Xiong JP, He CZ. Comparison of whole-body PET/PET-CT and conventional imaging procedures for distant metastasis staging in patients with breast cancer: a meta-analysis. European journal of gynaecological oncology. 2015; 36:672-676.
13. Scapaticci R, Bellizzi G, Catapano I, Crocco L, Bucci OM. An Effective Procedure for MNP-Enhanced Breast Cancer Microwave Imaging. Ieee T Bio-Med Eng. 2014; 61:1071-1079.
14. Seitz M, Scher B, Scherr M, Tilki D, Schlenker B, Gratzke C, Schipf A, Stanislaus R, Muller-Lisse U, Reich O, Stief C. Imaging procedures to diagnose prostate cancer. Urologe. 2007; 46:1435-1446.
15. Panarelli NC, Somarathna T, Samowitz WS, Kornacki S, Sanders SA, Novelli MR, Shepherd NA, Yantiss RK. Diagnostic Challenges Caused by Endoscopic Biopsy of Colonic Polyps A Systematic Evaluation of Epithelial Misplacement With Review of Problematic Polyps From the Bowel Cancer Screening Program, United Kingdom. American Journal Of Surgical Pathology. 2016; 40:1075-1083.
16. Li T, Zheng YT, Sun H, Zhuang RY, Liu J, Liu TS, Cai WM. K-Ras mutation detection in liquid biopsy and tumor tissue as prognostic biomarker in patients with pancreatic cancer: a systematic review with meta-analysis. Medical oncology. 2016; 33:61.
17. van Rossum PS, Goense L, Meziani J, Reitsma JB, Siersema PD, Vleggaar FP, van Vulpen M, Meijer GJ, Ruurda JP, van Hillegersberg R. Endoscopic biopsy and EUS for the detection of pathologic complete response after neoadjuvant chemoradiotherapy in esophageal cancer: a systematic review and meta-analysis. Gastrointest Endosc. 2016; 83:866-879.
18. Kropshofer G, Kneer A, Edlinger M, Meister B, Salvador C, Lass-Florl C, Freund M, Crazzolara R. Computed Tomography Guided Percutaneous Lung Biopsies and Suspected Fungal Infections in Pediatric Cancer Patients. Pediatric Blood & Cancer. 2014; 61:1620-1624.
19. McCormack M, Duclos A, Latour M, McCormack MH, Liberman D, Djahangirian O, Bergeron J, Valiquette L, Zorn K. Effect of needle size on cancer detection, pain, bleeding and infection in TRUS-guided prostate biopsies: a prospective trial. Cuaj-Can Urol Assoc. 2012; 6:97-101.
20. Paajanen H, Hermunen H. Does Preoperative Core Needle Biopsy Increase Surgical Site Infections in Breast Cancer Surgery? Randomized Study of Antibiotic Prophylaxis. Surg Infect. 2009; 10:317-321.
21. Hakozaki M, Hojo H, Tajino T, Yamada H, Kikuta A, Ito M, Sano H, Mochizuki K, Akaihata M, Kikuchi S, Abe M. Periosteal Ewing sarcoma family of tumors of the femur confirmed by molecular detection of EWS-FLI1 fusion gene transcripts - A case report and review of the literature. J Pediat Hematol Onc. 2007; 29:561-565.
22. Labgaa I, Villacorta-Martin C, D’Avola D, Craig AJ, Stueck A, Ward S, Fiel MI, Mahajan M, Thung SN, Friedman SL, Llovet JM, Ang C, Schwartz ME, Villanueva A. Ultra-deep sequencing of circulating tumor DNA identifies druggable mutations: exploring applications of a liquid biopsy in HCC. Hepatology. 2016; 63:627a-628a.
23. Poh A. Liquid Biopsy Holds Its Own in Tumor Profiling. Cancer discovery. 2016; 6:686-686.
24. Schlange T, Pantel K. Potential of circulating tumor cells as blood-based biomarkers in cancer liquid biopsy. Pharmacogenomics. 2016; 17:183-186.
25. Pantel K, Alix-Panabieres C. The Potential of Circulating Tumor Cells as a Liquid Biopsy to Guide Therapy in Prostate Cancer. Cancer discovery. 2012; 2:974-975.
26. Zhang PW, Chen L, Huang T, Zhang N, Kong XY, Cai YD. Classifying ten types of major cancers based on reverse phase protein array profiles. PLoS One. 2015; 10:e0123147.
27. Zhang N, Wang M, Zhang P, Huang T. Classification of cancers based on copy number variation landscapes. Biochim Biophys Acta. 2016; 1860:2750-2755.
28. Best MG, Sol N, Kooi I, Tannous J, Westerman BA, Rustenburg F, Schellen P, Verschueren H, Post E, Koster J, Ylstra B, Ameziane N, Dorsman J, et al. RNA-Seq of Tumor-Educated Platelets Enables Blood-Based Pan-Cancer, Multiclass, and Molecular Pathway Cancer Diagnostics. Cancer Cell. 2015; 28:666-676.
29. Peng H, Long F, Ding C. Feature selection based on mutual information: criteria of max-dependency, max-relevance, and min-redundancy. IEEE Transactions on Pattern Analysis and Machine Intelligence. 2005; 27:1226-1238.
30. Meyer D, Leisch F, Hornik K. The support vector machine under test. Neurocomputing. 2003; 55:169-186.
31. Corinna Cortes VV. Support-vector networks. Machine Learning. 1995; 20:273-297.
32. Jiang X, Shapiro DJ. The immune system and inflammation in breast cancer. Mol Cell Endocrinol. 2014; 382:673-682.
33. Kanterman J, Sade-Feldman M, Biton M, Ish-Shalom E, Lasry A, Goldshtein A, Hubert A, Baniyash M. Adverse immunoregulatory effects of 5FU and CPT11 chemotherapy on myeloid-derived suppressor cells and colorectal cancer outcomes. Cancer Res. 2014; 74:6022-6035.
34. Yan J, Kong LY, Hu JM, Gabrusiewicz K, Dibra D, Xia XQ, Heimberger AB, Li SL. FGL2 as a Multimodality Regulator of Tumor-Mediated Immune Suppression and Therapeutic Target in Gliomas. J Natl Cancer Inst. 2015; 107:djv137.
35. Pan WY, Gu W, Nagpal S, Gephart MH, Quake SR. Brain Tumor Mutations Detected in Cerebral Spinal Fluid. Clinical chemistry. 2015; 61:514-522.
36. Harford-Wright E, Lewis KM, Ghabriel MN, Vink R. Treatment with the NK1 Antagonist Emend Reduces Blood Brain Barrier Dysfunction and Edema Formation in an Experimental Model of Brain Tumors. PLoS One. 2014; 9:e97002.
37. Velichkova M, Keller TCS. Platelet titin: Localization and modification after platelet activation. Molecular biology of the cell. 1998; 9:22a.
38. Kotter S, Kazmierowska M, Andresen C, Bottermann K, Grandoch M, Gorressen S, Heinen A, Moll JM, Scheller J, Godecke A, Fischer JW, Schmitt JP, Kruger M. Titin-Based Cardiac Myocyte Stiffening Contributes to Early Adaptive Ventricular Remodeling After Myocardial Infarction. Circulation Research. 2016; 119:1017-1029.
39. Xia H, Hua L, Zheng WY, Zhou P. Exploration of the cancers association based on somatic data in TCGA. Acsr Adv Comput. 2015; 10:465-473.
40. Schultze E, Ourique A, Yurgel VC, Begnini KR, Thurow H, de Leon PM, Campos VF, Dellagostin OA, Guterres SR, Pohlmann AR, Seixas FK, Beck RC, Collares T. Encapsulation in lipid-core nanocapsules overcomes lung cancer cell resistance to tretinoin. European Journal Of Pharmaceutics And Biopharmaceutics. 2014; 87:55-63.
41. Marouf C, Gohler S, Da Silva MI, Hajji O, Hemminki K, Nadifi S, Forsti A. Analysis of functional germline variants in APOBEC3 and driver genes on breast cancer risk in Moroccan study population. Bmc Cancer. 2016; 16:165.
42. Bogomolovas J, Gasch A, Bajoras V, Karciauskaite D, Serpytis P, Grabauskiene V, Labeit D, Labeit S. Cardiac specific titin N2B exon is a novel sensitive serological marker for cardiac injury. International journal of cardiology. 2016; 212:232-234.
43. Troeger A, Chae HD, Senturk M, Wood J, Williams DA. A Unique Carboxyl-terminal Insert Domain in the Hematopoietic-specific, GTPase-deficient Rho GTPase RhoH Regulates Post-translational Processing. Journal Of Biological Chemistry. 2013; 288:36451-36462.
44. Troeger A, Williams DA. Hematopoietic-specific Rho GTPases Rac2 and RhoH and human blood disorders. Experimental Cell Research. 2013; 319:2375-2383.
45. Cassimere EK, Mauvais C, Denicourt C. p27(Kip1) Is Required to Mediate a G1 Cell Cycle Arrest Downstream of ATM following Genotoxic Stress. PLoS One. 2016; 11:e0162806.
46. Garcia V, Lara-Chica M, Cantarero I, Sterner O, Calzado MA, Muñoz E. Galiellalactone induces cell cycle arrest and apoptosis through the ATM/ATR pathway in prostate cancer cells. Oncotarget. 2016; 7:4490-4506. https://doi.org/10.18632/oncotarget.6606.
47. Liao MJ, Yin CY, Barlow C, Wynshaw-Boris A, Van Dyke T. Atm is dispensable for p53 apoptosis and tumor suppression triggered by cell cycle dysfunction. Molecular And Cellular Biology. 1999; 19:3095-3102.
48. Uhrhammer N, Uckun F, Wood C, Meyn MS. ATM, cell cycle control, and radiosensitivity in lymphoid and solid tumors. American journal of human genetics. 1997; 61:A85.
49. van Balkom BW, de Jong OG, Smits M, Brummelman J, den Ouden K, de Bree PM, van Eijndhoven MA, Pegtel DM, Stoorvogel W, Wurdinger T, Verhaar MC. Endothelial cells require miR-214 to secrete exosomes that suppress senescence and induce angiogenesis in human and mouse endothelial cells. Blood. 2013; 121:3997-4006.
50. Mavuluri J, Beesetti S, Surabhi R, Kremerskothen J, Venkatraman G, Rayala SK. Phosphorylation-Dependent Regulation of the DNA Damage Response of Adaptor Protein KIBRA in Cancer Cells. Molecular And Cellular Biology. 2016; 36:1354-1365.
51. Beke L, Kig C, Linders JT, Boens S, Boeckx A, van Heerde E, Parade M, De Bondt A, Van den Wyngaert I, Bashir T, Ogata S, Meerpoel L, Van Eynde A, et al. MELK-T1, a small-molecule inhibitor of protein kinase MELK, decreases DNA-damage tolerance in proliferating cancer cells. Bioscience Reports. 2015; 35:e00267.
52. Janku F, Kaseb AO, Tsimberidou AM, Wolff RA, Kurzrock R. Identification of novel therapeutic targets in the PI3K/AKT/mTOR pathway in hepatocellular carcinoma using targeted next generation sequencing. Oncotarget. 2014; 5:3012-3022. https://doi.org/10.18632/oncotarget.1687.
53. Davidson D, Abu-Sanad A, Wang YZ, Hasheminasab F, Panasci J, Aloyz R, Panasci L. Simultaneous inhibition of ATR and PARP greatly sensitizes colon cancer cell lines to irinotecan. Cancer Research. 2015; 75.
54. Chen XY, Wang Z, Li B, Zhang YJ, Li YY. Pim-3 contributes to radioresistance through regulation of the cell cycle and DNA damage repair in pancreatic cancer cells. Biochemical And Biophysical Research Communications. 2016; 473:296-302.
55. Hong CS, Ho W, Zhang C, Yang CZ, Elder JB, Zhuang ZP. LB100, a small molecule inhibitor of PP2A with potent chemo- and radio-sensitizing potential. Cancer Biology & Therapy. 2015; 16:821-833.
56. van Sluis M, McStay B. Ribosome biogenesis: Achilles heel of cancer? Genes Cancer. 2014; 5:152-153. https://doi.org/10.18632/genesandcancer.14.
57. Brighenti E, Treré D, Derenzini M. Targeted cancer therapy with ribosome biogenesis inhibitors: a real possibility? Oncotarget. 2015; 6:38617-38627. https://doi.org/10.18632/oncotarget.5775.
58. Daftuar L, Zhu Y, Jacq X, Prives C. Ribosomal Proteins RPL37, RPS15 and RPS20 Regulate the Mdm2-p53-MdmX Network. PLoS One. 2013; 8:e68667.
59. De Bortoli M, Castellino RC, Lu XY, Deyo J, Sturla LM, Adesina AM, Perlaky L, Pomeroy SL, Lau CC, Man TK, Rao PH, Kim JYH. Medulloblastoma outcome is adversely associated with overexpression of EEF1D, RPL30, and RPS20 on the long arm of chromosome 8. Bmc Cancer. 2006; 6:223.
60. Yong WH, Shabihkhani M, Telesca D, Yang S, Tso JL, Menjivar JC, Wei BW, Lucey GM, Mareninov S, Chen ZG, Liau LM, Lai A, Nelson SF, et al. Ribosomal Proteins RPS11 and RPS20, Two Stress-Response Markers of Glioblastoma Stem Cells, Are Novel Predictors of Poor Prognosis in Glioblastoma Patients. PLoS One. 2015; 10:e0141334.
61. Lowe AW, Moseley RH. Mutation of Ribosomal Protein RPS20 Predisposes to Colorectal Cancer. Gastroenterology. 2014; 147:547-549.
62. Nieminen TT, O’Donohue MF, Wu YP, Lohi H, Scherer SW, Paterson AD, Ellonen P, Abdel-Rahman WM, Valo S, Mecklin JP, Jarvinen HJ, Gleizes PE, Peltomaki P. Germline Mutation of RPS20, Encoding a Ribosomal Protein, Causes Predisposition to Hereditary Nonpolyposis Colorectal Carcinoma Without DNA Mismatch Repair Deficiency. Gastroenterology. 2014; 147:595-598.e595.
63. Zhang SC, Jin W, Liu H, Jin MJ, Chen ZX, Ding ZY, Zheng SS, Wang LJ, Yu YX, Chen K. RPSA Gene Mutants Associated with Risk of Colorectal Cancer among the Chinese Population. Asian Pacific Journal Of Cancer Prevention. 2013; 14:7127-7131.
64. Wu MS, Tu T, Huang YC, Cao Y. Suppression subtractive hybridization identified differentially expressed genes in lung adenocarcinoma: ERGIC3 as a novel lung cancer-related gene. Bmc Cancer. 2013; 13:44.
65. Zhan C, Zhang YX, Ma J, Wang L, Jiang W, Shi Y, Wang Q. Identification of reference genes for qRT-PCR in human lung squamous-cell carcinoma by RNA-Seq. Acta Biochimica Et Biophysica Sinica. 2014; 46:330-337.
66. Yajima S, Ishii M, Matsushita H, Aoyagi K, Yoshimatsu K, Kaneko H, Yamamoto N, Teramoto T, Yoshida T, Matsumura Y, Sasaki H. Expression profiling of fecal colonocytes for RNA-based screening of colorectal cancer. International journal of oncology. 2007; 31:1029-1037.
67. Idol RA, Robledo S, Du HY, Crimmins DL, Wilson DB, Ladenson JH, Bessler M, Mason PJ. Cells depleted for RPS19, a protein associated with Diamond Blackfan Anemia, show defects in 18S ribosomal RNA synthesis and small riblosomal subunit production. Blood Cell Mol Dis. 2007; 39:35-43.
68. Nakata T, Seki N, Miwa S, Kobayashi A, Soeda J, Nimura Y, Kawasaki S, Miyagawa S. Identification of genes associated with multiple nodules in hepatocellular carcinoma using cDNA microarray: Multicentric occurrence or intrahepatic metastasis? Hepato-Gastroenterol. 2008; 55:865-872.
69. Heim S, Lage H. Transcriptome analysis of different multidrug-resistant gastric carcinoma cells. In Vivo. 2005; 19:583-590.
70. Thoms M, Thomson E, Bassler J, Gnadig M, Griesel S, Hurt E. The Exosome Is Recruited to RNA Substrates through Specific Adaptor Proteins. Cell. 2015; 162:1029-1038.
71. Willms E, Johansson HJ, Mager I, Lee Y, Blomberg KE, Sadik M, Alaarg A, Smith CI, Lehtio J, El Andaloussi S, Wood MJ, Vader P. Cells release subpopulations of exosomes with distinct molecular and biological properties. Sci Rep. 2016; 6:22519.
72. Castellvi J, Artero-Castro A, Garcia A, Hernandez-Losa J, Lleonart ME, Cajal SRY. Expression of the Ribosomal Proteins Rplp0, Rplp1, and Rplp2 in Gynecologic Tumors. Modern Pathol. 2011; 24:240a.
73. Tian XQ, Sun DF, Zhao SL, Xiong H, Fang JY. Screening of potential diagnostic markers and therapeutic targets against colorectal cancer. Oncotargets Ther. 2015; 8:1691-1699.
74. Leong S, McKay MJ, Christopherson RI, Baxter RC. Biomarkers of Breast Cancer Apoptosis Induced by Chemotherapy and TRAIL. J Proteome Res. 2012; 11:1240-1250.
75. Kim BR, Jeon YK, Nam MJ. A mechanism of apigenin-induced apoptosis is potentially related to anti-angiogenesis and anti-migration in human hepatocellular carcinoma cells. Food And Chemical Toxicology. 2011; 49:1626-1632.
76. Havel JJ, Li Z, Cheng D, Peng J, Fu H. Nuclear PRAS40 couples the Akt/mTORC1 signaling axis to the RPL11-HDM2-p53 nucleolar stress response pathway. Oncogene. 2015; 34:1487-1498.
77. Balaj L, Atai NA, Chen W, Mu D, Tannous BA, Breakefield XO, Skog J, Maguire CA. Heparin affinity purification of extracellular vesicles. Sci Rep. 2015; 5:10266.
78. Peisker K, Braun D, Wolfle T, Hentschel J, Funfschilling U, Fischer G, Sickmann A, Rospert S. Ribosome-associated Complex Binds to Ribosomes in Close Proximity of Rpl31 at the Exit of the Polypeptide Tunnel in Yeast. Molecular biology of the cell. 2008; 19:5279-5288.
79. Maguire S, Leonidou A, Wai P, Marchio C, Ng C, Sapino A, Vincent-Salomon A, Reis J, Weigelt B, Natrajan R. SF3B1 mutations constitute a novel therapeutic target in breast cancer. Cancer Research. 2015; 75.
80. Maruyama Y, Miyazaki T, Ikeda K, Okumura T, Sato W, Horie-Inoue K, Okamoto K, Takeda S, Inoue S. Short Hairpin RNA Library-Based Functional Screening Identified Ribosomal Protein L31 That Modulates Prostate Cancer Cell Growth via p53 Pathway. PLoS One. 2014; 9:e108743.
81. Teterina NL, Kopylov AM, Bogdanov AA. Topography Of Ribosomal-Rna In Ribosomes Effect Of Pancreatic Rnase on Small Ribosomal Subparticles. Biochemistry-Moscow+. 1978; 43:183-188.
82. Beeley JA. Dissociation Of Pancreatic Ribosomes by Para Hydroxymercuric (C-14) Beenzoate. Biochimica Et Biophysica Acta. 1972; 259:112-116.
83. Keller PJ, Cohen E. Purification Of Bovine Pancreatic Ribosomes. Fed Proc. 1963; 22:301.
84. Rossman TG, Visalli MA, Komissarova EV. fau and its ubiquitin-like domain (FUBI) transforms human osteogenic sarcoma (HOS) cells to anchorage-independence. Oncogene. 2003; 22:1817-1821.
85. Casteels D, Michiels L, Merregaert J. On the Formation Of the Finkel-Biskis-Reilly Murine Sarcoma Virus - Involvement Of Radiation-Induced Retropseudogenes Of the Mouse Fau Gene. Proceedings Of the Xvi International Cancer Congress - Free Papers And Posters, Tomes 1-4. 1994; 67-72.
86. Pickard MR, Green AR, Ellis IO, Caldas C, Hedge VL, Mourtada-Maarabouni M, Williams GT. Dysregulated expression of Fau and MELK is associated with poor prognosis in breast cancer. Breast Cancer Research. 2009; 11:R60.
87. Cozzolino AM, Noce V, Battistelli C, Marchetti A, Grassi G, Cicchini C, Tripodi M, Amicone L. Modulating the Substrate Stiffness to Manipulate Differentiation of Resident Liver Stem Cells and to Improve the Differentiation State of Hepatocytes. Stem cells international. 2016; 2016:5481493.
88. Yang SX, Cui J, Yang YS, Liu ZP, Yan HY, Tang CH, Wang H, Qin HF, Li XY, Li JJ, Wang WX, Huang YQ, Gao HJ. Over-expressed RPL34 promotes malignant proliferation of non-small cell lung cancer cells. Gene. 2016; 576:421-428.
89. Liu H, Liang SH, Yang X, Ji ZN, Zhao WY, Ye XB, Rui J. RNAi-mediated RPL34 knockdown suppresses the growth of human gastric cancer cells. Oncology reports. 2015; 34:2267-2272.
90. Hammoudi A, Song F, Reed KR, Jenkins RE, Meniel VS, Watson AJ, Pritchard DM, Clarke AR, Jenkins JR. Proteomic profiling of a mouse model of acute intestinal Apc deletion leads to identification of potential novel biomarkers of human colorectal cancer (CRC). Biochemical And Biophysical Research Communications. 2013; 440:364-370.
91. Du JP, Shi YQ, Pan YL, Jin XH, Liu CJ, Liu N, Han QL, Lu YY, Qiao TD, Fan DM. Regulation of multidrug resistance by ribosornal protein L6 in gastric cancer cells. Cancer Biology & Therapy. 2005; 4:242-247.
92. Jacob AN, Kandpal G, Kandpal RP. Isolation of expressed sequences that include a gene for familial breast cancer (BRCA2) and other novel transcripts from a five megabase region on chromosome 13q12. Oncogene. 1996; 13:213-221.
93. Wang R, Yoshida K, Toki T, Sawada T, Uechi T, Okuno Y, Sato-Otsubo A, Kudo K, Kamimaki I, Kanezaki R, Shiraishi Y, Chiba K, Tanaka H, et al. Loss of function mutations in RPL27 and RPS27 identified by whole-exome sequencing in Diamond-Blackfan anaemia. British Journal Of Haematology. 2015; 168:854-864.
94. Ito E, Yoshida K, Okuno Y, Sato-Otsubo A, Toki T, Miyano S, Shiraishi Y, Chiba K, Terui K, Wang RN, Sato T, Iribe Y, Ohga S, et al. Identification of Two New DBA Genes, RPS27 and RPL27, by Whole-Exome Sequencing in Diamond-Blackfan Anemia Patients. Blood. 2012; 120:984.
95. Varis A, Wolf M, Monni O, Vakkari ML, Kokkola A, Moskaluk C, Frierson H, Powell SM, Knuutila S, Kallioniemi A, El-Rifai W. Targets of gene amplification and overexpression at 17q in gastric cancer. Cancer Research. 2002; 62:2625-2629.
96. Lallemant B, Evrard A, Combescure C, Chapuis H, Chambon G, Raynal C, Reynaud C, Sabra O, Joubert D, Hollande F, Lallemant JG, Lumbroso S, Brouillet JP. Reference gene selection for head and neck squamous cell carcinoma gene expression studies. Bmc Mol Biol. 2009; 10:78.
97. Rentoft M, Hultin S, Coates PJ, Laurell G, Nylander K. Tubulin alpha-6 chain is a stably expressed reference gene in archival samples of normal oral tissue and oral squamous cell carcinoma. Experimental and therapeutic medicine. 2010; 1:419-423.
98. Zhang PJ, Wei R, Wen XY, Ping L, Wang CB, Dong ZN, Deng XX, Bo W, Bin C, Tian YP. Genes expression profiling of peripheral blood cells of patients with hepatocellular carcinoma. Cell biology international. 2012; 36:803-809.
99. Zubor P, Hatok J, Moricova P, Kapustova I, Kajo K, Mendelova A, Sivonova MK, Danko J. Gene expression profiling of histologically normal breast tissue in females with human epidermal growth factor receptor 2-positive breast cancer. Molecular medicine reports. 2015; 11:1421-1427.
100. Li L, Dong M, Wang XG. The Implication and Significance of Beta 2 Microglobulin: A Conservative Multifunctional Regulator. Chinese Medical Journal. 2016; 129:448-455.
101. Dunlop-Briere AF, Baird MC, Budzelaar PHM. Mechanisms of alpha-, beta-, and gamma-H(D) Exchange Processes in the alpha-Agostic Alkyltitanocene (IV) Complexes [Cp2TiCH2CH (CH3)(CMe3)](+) and [Cp2TiCH2CH(CD3)(CMe3)](+): Stark Contrasts with Their gamma-SiMe3 Analogues. Organometallics. 2015; 34:2356-2368.
102. Munoz-Ruiz M, Perez-Flores V, Garcillan B, Guardo AC, Mazariegos MS, Takada H, Allende LM, Kilic SS, Sanal O, Roifman CM, Lopez-Granados E, Recio MJ, Martinez-Naves E, et al. Human CD3 gamma, but not CD3 delta, haploinsufficiency differentially impairs gamma delta versus alpha beta surface TCR expression. Bmc Immunology. 2013; 14:3.
103. Alashti FA, Minuchehr Z. MiRNAs Which Target CD3 Subunits Could Be Potential Biomarkers for Cancers. PLoS One. 2013; 8:e78790.
104. Duggan MC, Jochems C, Donahue RN, Richards J, Karpa V, Foust E, Paul B, Brooks T, Tridandapani S, Olencki T, Pan XL, Lesinski GB, Schlom J, Carson WE. A phase I study of recombinant (r) vaccinia-CEA(6D)-TRICOM and rFowlpox-CEA(6D)-TRICOM vaccines with GM-CSF and IFN-alpha-2b in patients with CEA-expressing carcinomas. Cancer Immunol Immun. 2016; 65:1353-1364.
105. Inokuma M, dela Rosa C, Schmitt C, Haaland P, Siebert J, Petry D, Tang MX, Suni MA, Ghanekar SA, Gladding D, Dunne JF, Maino VC, Disis ML, Maecker HT. Functional T cell responses to tumor antigens in breast cancer patients have a distinct phenotype and cytokine signature. Journal of immunology. 2007; 179:2627-2633.
106. Liu Y, Xiang X, Zhuang X, Zhang S, Liu C, Cheng Z, Michalek S, Grizzle W, Zhang HG. Contribution of MyD88 to the tumor exosome-mediated induction of myeloid derived suppressor cells. Am J Pathol. 2010; 176:2490-2499.
107. Baik IH, Jo GH, Seo D, Ko MJ, Cho CH, Lee MG, Lee YH. Knockdown of RPL9 expression inhibits colorectal carcinoma growth via the inactivation of Id-1/NF-kappa B signaling axis. International journal of oncology. 2016; 49:1953-1962.
108. Huang T, Chen L, Cai Y, Chou C. Classification and Analysis of Regulatory Pathways Using Graph Property, Biochemical and Physicochemical Property, and Functional Property. PLoS One. 2011; 6:e25297.
109. Zhang Y, Ding C, Li T. Gene selection algorithm by combining reliefF and mRMR. BMC genomics. 2008; 9:S27.
110. Liu L, Chen L, Zhang YH, Wei L, Cheng S, Kong XY, Zheng M, Huang T, Cai YD. Analysis and prediction of drug-drug interaction by minimum redundancy maximum relevance and incremental feature selection. Journal of Biomolecular Structure and Dynamics. 2017; 35:312-329.
111. Ni Q, Chen L. A feature and algorithm selection method for improving the prediction of protein structural classes. Combinatorial Chemistry & High Throughput Screening. 2017.
112. Chen L, Zhang YH, Lu G, Huang T, Cai YD. Analysis of cancer-related lncRNAs using gene ontology and KEGG pathways. Artificial Intelligence in Medicine. 2017; 76:27-36.
113. Chen L, Chu C, Feng K. Predicting the types of metabolic pathway of compounds using molecular fragments and sequential minimal optimizatio. Combinatorial Chemistry & High Throughput Screening. 2016; 19:136-143.
114. Chen L, Zhang YH, Huang T, Cai YD. Gene expression profiling gut microbiota in different races of humans. Scientific Reports. 2016; 6:23075.
115. Radovic M, Ghalwash M, Filipovic N, Obradovic Z. Minimum redundancy maximum relevance feature selection approach for temporal gene expression data. BMC Bioinformatics. 2017; 18:9.
116. Korkmaz SA, Korkmaz MF, Poyraz M. Diagnosis of breast cancer in light microscopic and mammographic images textures using relative entropy via kernel estimation. Medical & Biological Engineering & Computing. 2016; 54:561-573.
117. Ma X, Guo J, Sun X. Sequence-Based Prediction of RNA-Binding Proteins Using Random Forest with Minimum Redundancy Maximum Relevance Feature Selection. BioMed Research International. 2015; 2015:425810.
118. Wang S, Zhang YH, Lu J, Cui W, Hu J, Cai YD. Analysis and Identification of Aptamer-Compound Interactions with a Maximum Relevance Minimum Redundancy and Nearest Neighbor Algorithm. Biomed Res Int. 2016; 2016:8351204.
119. Zhang Q, Sun X, Feng K, Wang S, Zhang YH, Wang S, Lu L, Cai YD. Predicting citrullination sites in protein sequences using mRMR method and random forest algorithm. Comb Chem High Throughput Screen. 2017.
120. Wang S, Zhang YH, Huang G, Chen L, Cai YD. Analysis and Prediction of Myristoylation Sites Using the mRMR Method, the IFS Method and an Extreme Learning Machine Algorithm. Combinatorial Chemistry & High Throughput Screening. 2017; 20:96-106.
121. Chen L, Zhang YH, Zheng M, Huang T, Cai YD. Identification of compound-protein interactions through the analysis of gene ontology, KEGG enrichment for proteins and molecular fragments of compounds. Molecular Genetics and Genomics. 2016; 291:2065-2079.
122. Kohavi R. A Study of Cross-Validation and Bootstrap for Accuracy Estimation and Model Selection. International Joint Conference on Artificial Intelligence. 2010; 1137-1143.
123. Chen L, Chu C, Zhang YH, Zheng MY, Zhu L, Kong X, Huang T. Identification of Drug-Drug Interactions Using Chemical Interactions. Current Bioinformatics. 2017.
124. Chen L, Zeng WM, Cai YD, Feng KY, Chou KC. Predicting Anatomical Therapeutic Chemical (ATC) Classification of Drugs by Integrating Chemical-Chemical Interactions and Similarities. PLoS One. 2012; 7:e35254.
125. Wang S, Zhang Q, Lu J, Cai YD. Analysis and Prediction of Nitrated Tyrosine Sites with the mRMR Method and Support Vector Machine Algorithm. Current Bioinformatics. 2017.
126. Li BQ, Zhang YH, Jin Ml, Huang T, Cai YD. Prediction of Protein-Peptide Interactions with a Nearest Neighbor Algorithm. Current Bioinformatics. 2017.
127. Zhang YH, Xing ZH, Liu CL, Wang SP, Huang T, Cai YD, Kong XY. Identification of the core regulators of the HLA I-peptide binding process. Scientific Reports. 2017; 7:42768.
128. Chen L, Yang J, Xing Z, Yuan F, Shu Y, Zhang Y, Kong X, Huang T, Li H, Cai YD. An integrated method for the identification of novel genes related to oral cancer. PLoS One. 2017; 12:e0175185.
129. Platt J. Sequential Minimal Optimizaton: A Fast Algorithm for Training Support Vector Machines. Technical Report MSR-TR-98-14. 1998.
130. Frank E, Hall M, Trigg L, Holmes G, Witten IH. Data mining in bioinformatics using Weka. Bioinformatics. 2004; 20:2479-2481.
131. Chen L, Lu J, Zhang N, Huang T, Cai YD. A hybrid method for prediction and repositioning of drug Anatomical Therapeutic Chemical classes. Molecular BioSystems. 2014; 10:868-877.