
Introduction
Gliomas represent approximately 30% of primary brain tumors, and 80% of malignant tumors. Glioblastoma accounts for the majority of gliomas, while astrocytoma and glioblastoma combined account for about 75% of all gliomas.[1] Based on their histologic appearance, gliomas can be subdivided into an astrocytic (A), oligodendroglial (OD), or oligoastrocytic (OA) lineage. According to the WHO classification, they can be further subclassified into grades: I (pilocytic astrocytomas, PA), II (low grade), III (anaplastic) and IV (glioblastoma multiforme, GBM), depending on the malignant features present.[2, 3]
The response to therapy and outcome of glioma patients varies between different histological subtypes and grades.[3, 4] Most patients with WHO grade II tumours survive more than 5 years, whereas the median survival time for patients with grade III tumours is 2–3 years. Despite of the standard multimodal care for patients—surgical resection followed by adjuvant radiation therapy combined with chemotherapy, most patients with glioblastoma(WHO grade IV) succumb to the disease within one year. In the clinical setting, tumor grade is a critical factor which influences the choice of therapy modalities, particularly the use of adjuvant radiation and chemotherapy protocols. [3]
Radiation therapy(RT), as one of the major modalities of cancer therapy, plays an important role in integrated multimodality treatment for both low grade gliomas[5] and GBM[6]. Biological and technologic innovations over subsequent decades have pushed the field of radiation oncology closer toward the idealized goal of maximal local cancer control with minimal surrounding tissue toxicity.[7, 8] Emerging evidences show that new therapeutic targets have been identified to govern radioresistance in glioma.[9]
In the era of personalized medicine, prognostic and therapy-predictive molecular markers are required to guide cancer therapeutic decisions.[10, 11] One of the major issues in radiation therapy is predicting cancer radiosensitivity. At the molecular level, numerous genes have been shown to be responsive to radiation exposure. Radiosensitivity predictive assays have been developed and tested over the past few decades.[12]. As a high-throughput technology, gene signature has been used to predict radiosensitivity in many cancer types including glioblastoma, cervical, breast, colorectal, head and neck cancer cells[13-19]. One such example is the radiosensitivity index (RSI), which consists of 10 genes that associate with radiosensitivity within a collection of human cancer cell lines.[20] This signature has been clinically validated in five independent clinical data sets of different cancer type[21, 22] A similar assay identified a chemotherapy and/or radiation resistance signature using different cancer cell lines. The IFN-related DNA damage resistance signature (IRDS) analysis was evaluated retrospectively in clinical breast cancer data sets, and it successfully improved prediction of outcome after adjuvant chemotherapy and/or radiation[23].
Recently, a radiosensitivity gene signature, which includes 31 genes derived by integrating four different microarray experiments(Supplementary Table S1), has been found to have a potential for predicting radiosensitivity of cancer cells, but it was seldom validated in the clinical cancer samples. [24] In our study, we proposed that the gene signature may serve as a predictive biomarker for estimating the overall survival(OS) of radiation-treated patients. We analyzed the correlation of gene signature with overall survival time in 276 glioma patients of GSE16011 from Gene Expression Omnibus(GEO), and the prognostic value was further validated in another cohort of 463 patients with glioblastoma multiforme(GBM) from The Cancer Genome Altas (TCGA). (Supplementary Table S2,S3)
Results
Radiosensitivity signature and Cluster analysis
The radiosensitivity molecular signature has been derived by integrating four different microarray experiments by Kim et.al[24]. Briefly, the survival fraction at 2 Gy (SF2) was used as a measure of cellular radiosensitivity. This gene set was identified with multiple microarray platforms using significant analysis of microarrays (SAM), and then gene set analysis was carried out to explore the biological processes and signaling pathways of radiosensitivity. Thus, the gene signature including 31 genes relevant to cell cycle, DNA replication, and cell junction including adherence and gap junctions was identified related to radiosensitivity. We then set out to determine the expression pattern of those 31 genes in a large panel of samples from GSE16011(Fig 1a) and TCGA(Fig1b) by using Hierarchical Clustering module in GenePattern[25]. The samples located on the left single branch of the dendrogram were subclassified as radiosensitive(RS) group, whereas the other major branch was subclassified radioresistant(RR) group according to Kim et.al’s report[24].
Table 1: Patient demographics and clinical characteristics of GSE16011 cohort(n=276)
Characteristic |
No.(available) |
% |
Gender |
||
Male |
184 |
66.7 |
Female |
92 |
33.3 |
Age at diagnosis,years |
||
Mean |
50.3 |
|
Std. Deviation |
14.71 |
|
KPS |
||
Mean |
80.68 |
|
Std. Deviation |
19.55 |
|
Survival years |
||
Mean |
2.73 |
|
Std. Deviation |
3.52 |
|
WHO grade and histology |
||
I(PA) |
8 |
2.9 |
II |
24 |
8.7 |
A |
13 |
4.7 |
OA |
3 |
1.1 |
OD |
8 |
2.9 |
III |
85 |
30.8 |
A |
16 |
5.8 |
OA |
25 |
9.1 |
OD |
44 |
15.9 |
IV(GBM) |
159 |
57.6 |
Treatment |
||
Radiotherapy |
||
No |
78 |
28.3 |
Yes |
198 |
71.7 |
Additional chemotherapy |
||
No |
173 |
62.7 |
Yes |
27 |
9.8 |
Type of surgery |
||
Complete resection |
86 |
31.2 |
Partial resection |
39 |
14.1 |
Biopsy |
146 |
52.9 |
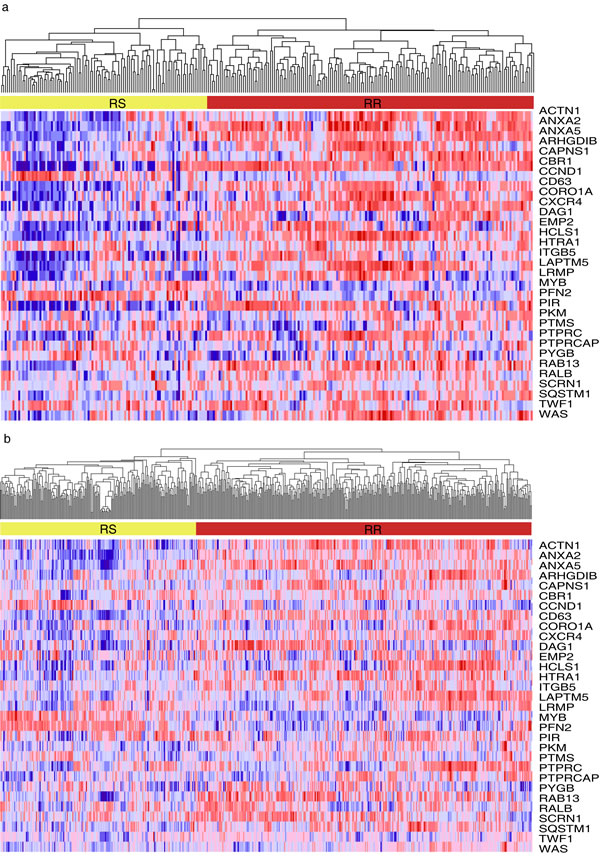
Figure 1: Hierarchical clustering analysis on the samples from two cohorts. Hierarchical clustering was used to determine the expression pattern of 31-gene signature on the samples from GSE16011(Fig 1a) and TCGA(Fig 1b). The samples located on the left single branch of the dendrogram were subclassified as radiosensitive(RS) group, whereas the other major branch was subclassified radioresistant(RR) group according to Kim et.al’s report.
The association of radiosensitivity gene signature and patient’s survival in GSE16011 data set
The association between radiophenotype(as predicted by the radiosensitivity gene signature) and clinical outcome was examined for all the patients with glioma in GSE 16011. Patients predicted to be radiosensitive(RS) are expected to have better survival outcomes compared with patients predicted to be radioresistant(RR). Using the radiosensitivity gene signature, 263 patients were divided into RS(n=104) and RR (n=159) groups. Patients in the RR group had significantly shorter overall survival than those in the RS group (log-rank test P<0.0001)(Figure 2a).
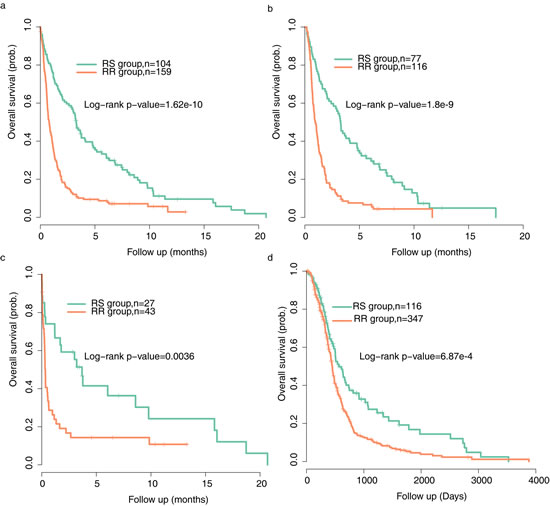
Figure 2: Tumor classification by radiosensitivity gene signature shows distinct prognostic outcomes. Kaplan-Meier curves were used to analyze the association of the radiosensitivity gene signature with clinical outcome(overall survival) of (a) all glioma patients from GSE16011(n=263) (b) patients treated with radiation therapy from GSE 16011(n=193) (c) patients treated with no radiation therapy from GSE 16011(n=70) (d) GBM patients from TCGA(n=463).
The radiosensitivity model predicts clinical outcome only in RT-treated patients
In order to further determine whether the signature is RT-specific, we conducted a subgroup analysis in the dataset. Kaplan–Meier curves were performed for patients treated with and without radiotherapy(RT) separately. RS patients had a superior overall survival compared with RR patients either in radiotherapy-treated subset or in the patients subset that did not receive RT (Figure 2b, p<0.0001 in the RT-treated goup and Figure 2c,p=0.0036 in non RT-treated group).
Table 2: Patient demographics and clinical characteristics of TCGA(The Cancer Genome Atlas) cohort(n=463)
Characteristic |
No. (available) |
% |
Gender |
||
Male |
288 |
62.2 |
Female |
175 |
37.7 |
Age at diagnosis,years |
||
Mean |
56.35 |
|
Std. Deviation |
13.99 |
|
KPS |
||
Mean |
81.9 |
|
Std. Deviation |
14.09 |
|
Molecular subtype |
435 |
|
proneural |
112 |
24.2 |
neural |
64 |
13.8 |
classical |
126 |
27.2 |
mesenchymal |
131 |
28.3 |
Additional chemotherapy |
408 |
|
No |
226 |
48.9 |
Yes |
182 |
39.3 |
Additional surgery procedure |
217 |
|
No |
97 |
21 |
Yes |
120 |
25.9 |
Nevertheless, in the multivariate Cox regression analysis to assess for independent predictors of the relation between the gene signature and clinicopathologic features, we found that the gene signature is the strongest predictor(p=0.0093) in the subgroup of patients with radiotherapy, whereas it does not remain significant (p=0.202) in the non RT group when taking age and Karnofsky performance score (KPS) into account.(Table 3) Taken together, the radiosensitivity gene signature is mainly predictive in patients treated with radiation therapy.
Table 3: Multivariate Cox regression analysis of RT-treated patients in GSE16011 patients. HR = hazard ratio; CI = confidence interval.
Covariate |
P |
HR |
95% CI |
All the patients with glioma(n=276) |
|||
Gene signature |
0.012 |
2.217 |
1.193 to 4.121 |
Age at diagnosis |
0.021 |
1.029 |
1.005 to 1.053 |
KPS |
0.274 |
0.988 |
0.967 to 1.010 |
WHO grade |
0.486 |
1.416 |
0.534 to 3.753 |
Reviewed histologic diagnosis |
0.514 |
1.205 |
0.690 to 2.107 |
Chemotherapy |
0.794 |
0.932 |
0.549 to 1.580 |
Type of surgery |
0.063 |
1.345 |
0.986 to 1.833 |
IDH1_ mutation |
0.111 |
0.557 |
0.272 to 1.141 |
co 1p/19q mutation |
0.277 |
1.455 |
0.743 to 2.849 |
RT-treated patients |
|||
Gene signature |
0.009 |
2.325 |
1.236 to 4.374 |
Age at diagnosis |
0.022 |
1.029 |
1.004 to 1.054 |
KPS |
0.295 |
0.988 |
0.966 to 1.010 |
WHO grade |
0.315 |
1.702 |
0.606 to 4.780 |
Reviewed histologic diagnosis |
0.541 |
1.205 |
0.665 to 2.183 |
Chemotherapy |
0.453 |
0.804 |
0.456 to 1.417 |
Type of surgery |
0.049 |
1.383 |
1.003 to 1.906 |
IDH1_ mutation |
0.091 |
0.525 |
0.250 to 1.103 |
co 1p/19q mutation |
0.675 |
1.161 |
0.579 to 2.329 |
Non RT-treated patients |
|||
Gene signature |
0.202 |
1.510 |
0.805 to 2.831 |
Age at diagnosis |
0.002 |
1.035 |
1.013 to 1.058 |
KPS |
0.002 |
0.974 |
0.959 to 0.990 |
The radiosensitivity model predicts clinical outcome in TCGA cohort
Given the clinical importance of correct assignment, we tended to validate our results using more clinically homogenous dataset with different chip platforms. The TCGA cohort consists of 463 patients with histologically confirmed glioblastoma multiforme (GBM, WHO grade IV). All the patients had received radiation therapy. Similar to the previous findings, patients predicted to be RR had shorter survival time than patients predicted to be RS(Figure 2d). In consistence with the results described above, patient’s survival in the RS group was better than that in the RR group throughout the follow-up. The effect of gene signature group, clinical factors as age, KPS, molecular subtype and treatment procedures on GBM patient survival time was further evaluated by multivariate Cox proportional hazard model. The results showed that gene signature might be an independent predictor of patient survival (Table 4). Further Cox regression analysis on each subtype of samples were carried out and the results were shown as Supplementary Figure S1.
Table 4: Multivariate Cox regression analysis of RT-treated patients in TCGA patients. HR = hazard ratio; CI = confidence interval.
Covariate |
P |
HR |
95% CI |
Gene signature |
0.033 |
1.897 |
1.055 to 3.413 |
Age at diagnosis |
0.003 |
1.023 |
1.008 to 1.039 |
Karnofsky_performance_score |
0.336 |
0.993 |
0.979 to 1.007 |
Additional chemotherapy |
0.019 |
0.633 |
0.432 to 0.928 |
Additional surgery procedure |
0.857 |
0.965 |
0.656 to 1.421 |
Gene Expression Subtype |
0.417 |
0.920 |
0.751 to 1.126 |
Identification of EMT gene sets involved in gene signature
Epithelial mesenchymal transition(EMT) is known as a facilitator of cellular dissociation and migration, which plays a critical role in caner metastasis. Recently, EMT was reported to be related to radioresistence in many cancers[26, 27] and specifically targeting EMT may provide a new targeted approach for improving the therapeutic effectiveness of radiation in cancers[28]. To understand whether the RR samples were enriched with EMT related pathway, we performed Gene Set Enrichment Analysis(GSEA) in TCGA cohort. GSEA is a computational method that assesses coordinate expression changes at a pathway level. To assess the direct transcriptional targets, EMT related gene sets were obtained using the GSEA tool from MIT (www.broad.mit.edu/gsea). As seen in Fig. 3, several gene sets of epithelial mesenchymal transition(EMT) were associated with radioresistant phenotypes. Collectively, these data suggest that radioresistant phenotype was enriched for genes of EMT, whereas radiosensitive phenotype correlated strongly with decrease of genes of EMT.
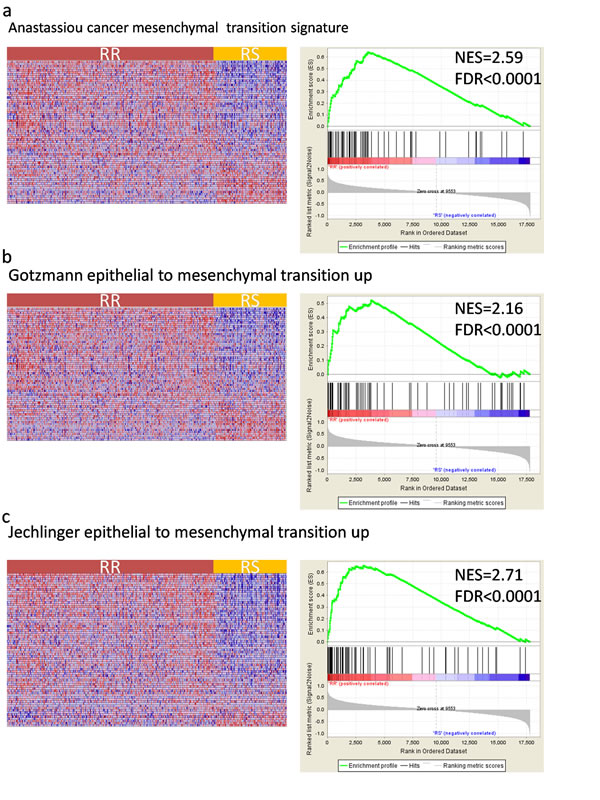
Figure 3: Gene Set Enrichment Analysis(GSEA) shows enrichment of EMT(epithelial mesenchymal transition) related genes among radioresistant(RR) patient classified by the gene signature. GSEA validated enhanced activity of (a) Anastassiou cancer mesenchymal transition signature (b) Gotzmann epithelial to mesenchymal transition up (c) Jechlinger epithelial to mesenchymal transition up. The horizontal bar in graded color from red to blue represents the rank-ordered, non-redundant list of genes. The vertical black lines represent the projection of individual genes onto the ranked gene list. Genes on the left side (red) correlated most strongly with increased EMT related gene expression. NES, normalized enrichment score; FDR, false discovery rate.
Discussion
In the “omics” era, the generation of high-throughput datasets has been widely used to better define treatment and disease outcome. As a genetic disease, cancer is composed of multiple molecular alterations. Aiming at improving cancer care, it is important to examine and try to understand these genetic alterations. Over the last 15 years, gene signatures with specificity in terms of diagnosis, prognosis or prediction of therapy response have been developed and validated by different techniques and teams.[29] For instance, one of the first groups reported a prognostic gene signature in breast cancer.[30] The 70-gene signature provided prognostic and predictive information, and it further triggered development of commercial test(Mammoprint). The prognostic value of Mammoprint has been validated in a series of patients including response prediction for chemotherapy in breast cancer.[31-34] Gene expression profiles have also been identified for classification and prognosis in gliomas.[35-37] However, few radiation-specific biomarkers have become routine due to the lack of validation in clinical radiation oncology practice. Kim et al. has integrated four different microarray and identified genes as candidates for radiosensitivity biomarkers. The gene signature involves 31 genes related to cell cycle, cell junctions, and cell adhesion. In this paper, we propose this discovery platform as a rational strategy to the identification of novel radiation-specific biomarker for gliomas. We test the gene signature in two independent data sets of glioma patients, revealing that the gene signature were significantly associated with survival endpoints. The combined clinical and laboratory data strongly indicate that the 31-gene signature is principally a therapy-predictive marker for glioma patients.
We first examined whether there was any association between radiosensitivity gene signature and clinical outcome in glioma patients from GSE16011 cohort. Patients were then subdivided into RT-treated and non RT-treated groups. By applying the 31 gene signature to the RT-treated patients, we observed a clear separation in the survival curves between patients predicted to be radiosensitive and radioresistant. Patients predicted to be RS in their tumor specimens tended to have prolonged overall survival, whereas patients predicted to be RR tended to have shortened survival. Interestingly, there was no difference in outcome between predicted RS and RR patients that did not receive RT after multivariable Cox regression analysis suggesting that the gene signature is RT-specific. Due to the lack of treatment homogeneity in GSE16011 data set, we further validate the gene signature in another data set obtained from TCGA. For the TCGA data set, all the patients have been diagnosed glioblastoma multiforme histologically, and have been treated with radiotherapy. The association of radiosensitivity gene signature and clinical outcome was also analyzed, and the results were similar to those observed in glioma patients above. Given the clinical importance of correct assignment, any molecular biomarkers have to be confirmed not only with different technical platforms but also with external patient populations. As a confirmatory step, our data show that the radiotherapy specific molecular subgroups correlate with patient survival.
Further analysis revealed that the prognostic value of the radiosensitivity signature was independent of age and KPS, the strongest survival predictors in patients suffering from glioma. In general, younger age and higher KPS show better survival, whereas older age and lower KPS is correlated with worse survival in a treatment independent manner. [38] In accordance with other studies, age was a significant prognostic factor in our study when assessed in the multivariable Cox regression analysis. In the stratification analysis, when age and KPS were analyzed simultaneously by multivariate analysis, significant associations of gene signature and clinical outcome were no longer present for non-RT treated subgroup in GSE data set. Traditionally, prognosis of a patient with GBM is associated with WHO grade and histology. [3] Other generally accepted predictors of survival are the extent of tumor resection, additional chemotherapy, additional surgery locoregional procedure.[39]
Today’s advancements in genetics technology have surfaced more molecular associations with outcomes for these patients , such as IDH1 mutation, codeletion of chromosome 1p/19q, MGMT promoter methylation status.[5, 39, 40] Patients with codeletion of 1p and 19q have an increased response to treatment and favorable outcomes. [41]Isocitrate dehydrogenase 1 (IDH1) mutations are also indicated in increased survival in GBM patients. Patients with MGMT promoter methylation and IDH1 mutation are associated with increased progression-free and overall survival.[42, 43] Here, by performing multivariable Cox regression analysis, we showed that the radiosensitivity gene signature is independent of these possible prognostic predictors(when available) among patients of glioma treated with radiotherapy.
In addition, using GSEA analysis, we find strong evidence for the upregulation of EMT gene sets associated with radioresistant phenotype. As indicted by Kim et al, among the 31 genes, ACTN1, CCND1, HCLS1, ITGB5, PFN2, PTPRC, RAB13, and WAS, totally 8 genes, are adhesion-related molecules, which are enriched in the integrin and EMT signaling pathway. [24] Integrins are molecules that directly bind to the extracellular matrix(ECM) and regulate diverse functions in tumour cells, including migration, invasion, proliferation and survival. Moreover, Integrins are instrumental in the activation and modulation of TGFβ signaling, which is a well-characterized inducer of epithelial–mesenchymal transition(EMT). [44] By performing GSEA Analysis, we successfully validated that several gene sets of epithelial mesenchymal transition(EMT) were associated with radioresistant phenotypes. Based on these results, we might speculate that the gene signature might be involved in the epithelial–mesenchymal transition process. Epithelial–mesenchymal transition (EMT), characterized by a cellular process during which epithelial cells lose their polarized organization and cell–cell junctions, plays a critical role not only in tumor metastasis but also in tumor recurrence. [45] Emerging evidence suggests that EMT plays a crucial role in cancer radiation resistance. [46, 47] However, the role of EMT in glioma radioresistance remains elusive. In clinical setting, resistance to radiotherapy is a major obstacle to the effective treatment of glioma, our findings may bring a new broad of perspective for new therapeutic targets.
In summary, our study demonstrates the prognostic values of radiosensitivity gene signature identified by Kim et al. Our data suggest that the signature is a predictive biomarker of radiotherapy treatment benefit for glioma patients. Epithelial mesenchymal transition(EMT) pathway might be associated with radioresistant phenotypes classified by the gene signature. Future prospective studies will be needed to fully refine the integrated prognostic algorithm in clinical radiation oncology.
Methods
GEO glioma patients gene expression data
The largest data set (GSE16011) of glioma patients from the publicly available GEO databases was used as one of the validation set. Gene expression data and corresponding clinical data used in this study were obtained from GEO databases and related article [48]. The study subjects in this cohort were collected from the Erasmus University Medical Center tumor archive (n = 276) from patients between 1989 and 2005, which has been previously described. [48] The cohort consists of 276 patients with histologically confirmed gliomas of different grades: 8 astrocytomas grade I (PA), 24 grade II(13 astrocytomas, 3 OA and 8 OD), 85 grade III(16 astrocytomas, 25 OA and 44 OD), 159 astrocytomas grade 4 (GBM) Male-to-female ratio was 2:1, median age at diagnosis was 50.3 years (range, 11.7–81.2), and mean KPS was 80.7. Extended demographics for these patients are shown in Table 1. Thirteen patients with no survival information were excluded in the analysis(n=263).
TCGA glioma patients gene expression data
For the TCGA cohort, the gene expression profiles were studied in 463 GBM tumors from patients who were chosen from the updated TCGA database(All the data were available without limitations as assessed on Nov.21,2013). [49] Only patients having received radiation therapy and intact OS information were included in the study. A total of 463 GBM samples of following molecular subtype were included in this study: 128 classical, 133 mesenchymal, 65 neural, 113 proneural(others NA). Male-to-female ratio was 1.6:1, median age at diagnosis was 56 years (range, 10–86) and mean KPS was 78.5. Detailed patient characteristics are listed in Table 2.
Microarray data processing
RNA preparation procedure has been previously described. [48, 49] Raw gene expression data for both datasets are publicly available in GEO (http://www.ncbi.nlm.nih.gov/geo/) and TCGA(http://cancergenome.nih.gov/) Affymetrix HU133 Plus 2.0 arrays was used for GEO cohort, whereas The Cancer Genome Atlas (TCGA) data sets used HU133A microarrays.
Statistical analysis
The analysis was conducted for all patients in each dataset. Patients were divided into RS and RR groups, as described in the previous study. [24] This RS/RR variable was compared with OS of each dataset. The Kaplan-Meier method was used to estimate survival time for the RS/RR groups, along with the two-sided log-rank test to determine the difference between the two groups. Cox proportional hazard models was fit to obtain HRs. Furthermore, we used Cox multivariate analysis to test whether the RS/RR group was an independent predictor for survival time. All the data was analysed by SPSS (version 16.0), The significance level was defined as 0.05.
Gene set enrichment analysis (GSEA)
GSEA was performed by the JAVA program (http://www.broadinstitute.org/gsea) using MSigDB C2 curated gene set collection. Gene sets with a false discovery rate(FDR) value <0.05 after performing 1,000 permutations were considered to be significantly enriched. [50]
Competing interests
The authors declare that they have no competing interests in this study.
Acknowledgements
This article is funded by the research grant (YG2012ZD02, 2JC1407400) from Shanghai Jiaotong University and the Science and Technology Commission of Shanghai, China and the grant (81272506, 61227017) from National Natural Science Foundation of China.
References
1. Ostrom QT, Gittleman H, Farah P, Ondracek A, Chen Y, Wolinsky Y, Stroup NE, Kruchko C and Barnholtz-Sloan JS. CBTRUS statistical report: Primary brain and central nervous system tumors diagnosed in the United States in 2006-2010. Neuro-oncology. 2013; 15 Suppl 2:ii1-56.
2. Bralten LB and French PJ. Genetic alterations in glioma. Cancers. 2011; 3(1):1129-1140.
3. Louis DN, Ohgaki H, Wiestler OD, Cavenee WK, Burger PC, Jouvet A, Scheithauer BW and Kleihues P. The 2007 WHO classification of tumours of the central nervous system. Acta neuropathologica. 2007; 114(2):97-109.
4. Ohgaki H and Kleihues P. Population-based studies on incidence, survival rates, and genetic alterations in astrocytic and oligodendroglial gliomas. Journal of neuropathology and experimental neurology. 2005; 64(6):479-489.
5. Pedersen CL and Romner B. Current treatment of low grade astrocytoma: a review. Clinical neurology and neurosurgery. 2013; 115(1):1-8.
6. Omuro A and DeAngelis LM. Glioblastoma and other malignant gliomas: a clinical review. JAMA : the journal of the American Medical Association. 2013; 310(17):1842-1850.
7. Liauw SL, Connell PP and Weichselbaum RR. New paradigms and future challenges in radiation oncology: an update of biological targets and technology. Science translational medicine. 2013; 5(173):173sr172.
8. Ke C, Tran K, Chen Y, Di Donato AT, Yu L, Hu Y, Linskey ME, Wang PH, Limoli CL and Zhou YH. Linking differential radiation responses to glioma heterogeneity. Oncotarget. 2014.
9. Asuthkar S, Velpula KK, Chetty C, Gorantla B and Rao JS. Epigenetic regulation of miRNA-211 by MMP-9 governs glioma cell apoptosis, chemosensitivity and radiosensitivity. Oncotarget. 2012; 3(11):1439-1454.
10. Hirst DG and Robson T. Molecular biology: the key to personalised treatment in radiation oncology? The British journal of radiology. 2010; 83(993):723-728.
11. Dalton WS and Friend SH. Cancer biomarkers--an invitation to the table. Science. 2006; 312(5777):1165-1168.
12. Begg AC. Predicting response to radiotherapy: evolutions and revolutions. International journal of radiation biology. 2009; 85(10):825-836.
13. Salendo J, Spitzner M, Kramer F, Zhang X, Jo P, Wolff HA, Kitz J, Kaulfuss S, Beissbarth T, Dobbelstein M, Ghadimi M, Grade M and Gaedcke J. Identification of a microRNA expression signature for chemoradiosensitivity of colorectal cancer cells, involving miRNAs-320a, -224, -132 and let7g. Radiotherapy and oncology : journal of the European Society for Therapeutic Radiology and Oncology. 2013; 108(3):451-457.
14. Spitzner M, Emons G, Kramer F, Gaedcke J, Rave-Frank M, Scharf JG, Burfeind P, Becker H, Beissbarth T, Ghadimi BM, Ried T and Grade M. A gene expression signature for chemoradiosensitivity of colorectal cancer cells. International journal of radiation oncology, biology, physics. 2010; 78(4):1184-1192.
15. Hall JS, Iype R, Senra J, Taylor J, Armenoult L, Oguejiofor K, Li Y, Stratford I, Stern PL, O’Connor MJ, Miller CJ and West CM. Investigation of radiosensitivity gene signatures in cancer cell lines. PloS one. 2014; 9(1):e86329.
16. Pramana J, Van den Brekel MW, van Velthuysen ML, Wessels LF, Nuyten DS, Hofland I, Atsma D, Pimentel N, Hoebers FJ, Rasch CR and Begg AC. Gene expression profiling to predict outcome after chemoradiation in head and neck cancer. International journal of radiation oncology, biology, physics. 2007; 69(5):1544-1552.
17. Bhat KP, Balasubramaniyan V, Vaillant B, Ezhilarasan R, Hummelink K, Hollingsworth F, Wani K, Heathcock L, James JD, Goodman LD, Conroy S, Long L, Lelic N, Wang S, Gumin J, Raj D, et al. Mesenchymal differentiation mediated by NF-kappaB promotes radiation resistance in glioblastoma. Cancer cell. 2013; 24(3):331-346.
18. Snijders AM, Marchetti F, Bhatnagar S, Duru N, Han J, Hu Z, Mao JH, Gray JW and Wyrobek AJ. Genetic differences in transcript responses to low-dose ionizing radiation identify tissue functions associated with breast cancer susceptibility. PloS one. 2012; 7(10):e45394.
19. Imadome K, Iwakawa M, Nakawatari M, Fujita H, Kato S, Ohno T, Nakamura E, Ohkubo Y, Tamaki T, Kiyohara H and Imai T. Subtypes of cervical adenosquamous carcinomas classified by EpCAM expression related to radiosensitivity. Cancer biology & therapy. 2010; 10(10):1019-1026.
20. Eschrich SA, Pramana J, Zhang H, Zhao H, Boulware D, Lee JH, Bloom G, Rocha-Lima C, Kelley S, Calvin DP, Yeatman TJ, Begg AC and Torres-Roca JF. A gene expression model of intrinsic tumor radiosensitivity: prediction of response and prognosis after chemoradiation. International journal of radiation oncology, biology, physics. 2009; 75(2):489-496.
21. Eschrich S, Zhang H, Zhao H, Boulware D, Lee JH, Bloom G and Torres-Roca JF. Systems biology modeling of the radiation sensitivity network: a biomarker discovery platform. International journal of radiation oncology, biology, physics. 2009; 75(2):497-505.
22. Eschrich SA, Fulp WJ, Pawitan Y, Foekens JA, Smid M, Martens JW, Echevarria M, Kamath V, Lee JH, Harris EE, Bergh J and Torres-Roca JF. Validation of a radiosensitivity molecular signature in breast cancer. Clinical cancer research : an official journal of the American Association for Cancer Research. 2012; 18(18):5134-5143.
23. Weichselbaum RR, Ishwaran H, Yoon T, Nuyten DS, Baker SW, Khodarev N, Su AW, Shaikh AY, Roach P, Kreike B, Roizman B, Bergh J, Pawitan Y, van de Vijver MJ and Minn AJ. An interferon-related gene signature for DNA damage resistance is a predictive marker for chemotherapy and radiation for breast cancer. Proceedings of the National Academy of Sciences of the United States of America. 2008; 105(47):18490-18495.
24. Kim HS, Kim SC, Kim SJ, Park CH, Jeung HC, Kim YB, Ahn JB, Chung HC and Rha SY. Identification of a radiosensitivity signature using integrative metaanalysis of published microarray data for NCI-60 cancer cells. BMC genomics. 2012; 13:348.
25. Kuehn H, Liberzon A, Reich M and Mesirov JP. Using GenePattern for gene expression analysis. Current protocols in bioinformatics / editoral board, Andreas D Baxevanis [et al]. 2008; Chapter 7:Unit 7 12.
26. Escriva M, Peiro S, Herranz N, Villagrasa P, Dave N, Montserrat-Sentis B, Murray SA, Franci C, Gridley T, Virtanen I and Garcia de Herreros A. Repression of PTEN phosphatase by Snail1 transcriptional factor during gamma radiation-induced apoptosis. Molecular and cellular biology. 2008; 28(5):1528-1540.
27. Kurrey NK, Jalgaonkar SP, Joglekar AV, Ghanate AD, Chaskar PD, Doiphode RY and Bapat SA. Snail and slug mediate radioresistance and chemoresistance by antagonizing p53-mediated apoptosis and acquiring a stem-like phenotype in ovarian cancer cells. Stem cells. 2009; 27(9):2059-2068.
28. Chang L, Graham PH, Hao J, Bucci J, Cozzi PJ, Kearsley JH and Li Y. Emerging roles of radioresistance in prostate cancer metastasis and radiation therapy. Cancer metastasis reviews. 2014.
29. Chibon F. Cancer gene expression signatures - the rise and fall? European journal of cancer. 2013; 49(8):2000-2009.
30. van ‘t Veer LJ, Dai H, van de Vijver MJ, He YD, Hart AA, Mao M, Peterse HL, van der Kooy K, Marton MJ, Witteveen AT, Schreiber GJ, Kerkhoven RM, Roberts C, Linsley PS, Bernards R and Friend SH. Gene expression profiling predicts clinical outcome of breast cancer. Nature. 2002; 415(6871):530-536.
31. Mook S, Schmidt MK, Viale G, Pruneri G, Eekhout I, Floore A, Glas AM, Bogaerts J, Cardoso F, Piccart-Gebhart MJ, Rutgers ET, Van’t Veer LJ and Consortium T. The 70-gene prognosis-signature predicts disease outcome in breast cancer patients with 1-3 positive lymph nodes in an independent validation study. Breast cancer research and treatment. 2009; 116(2):295-302.
32. Bueno-de-Mesquita JM, Linn SC, Keijzer R, Wesseling J, Nuyten DS, van Krimpen C, Meijers C, de Graaf PW, Bos MM, Hart AA, Rutgers EJ, Peterse JL, Halfwerk H, de Groot R, Pronk A, Floore AN, et al. Validation of 70-gene prognosis signature in node-negative breast cancer. Breast cancer research and treatment. 2009; 117(3):483-495.
33. van de Vijver MJ, He YD, van’t Veer LJ, Dai H, Hart AA, Voskuil DW, Schreiber GJ, Peterse JL, Roberts C, Marton MJ, Parrish M, Atsma D, Witteveen A, Glas A, Delahaye L, van der Velde T, et al. A gene-expression signature as a predictor of survival in breast cancer. The New England journal of medicine. 2002; 347(25):1999-2009.
34. Straver ME, Glas AM, Hannemann J, Wesseling J, van de Vijver MJ, Rutgers EJ, Vrancken Peeters MJ, van Tinteren H, Van’t Veer LJ and Rodenhuis S. The 70-gene signature as a response predictor for neoadjuvant chemotherapy in breast cancer. Breast cancer research and treatment. 2010; 119(3):551-558.
35. Shukla S, Pia Patric IR, Thinagararjan S, Srinivasan S, Mondal B, Hegde AS, Chandramouli BA, Santosh V, Arivazhagan A and Somasundaram K. A DNA methylation prognostic signature of glioblastoma: identification of NPTX2-PTEN-NF-kappaB nexus. Cancer research. 2013; 73(22):6563-6573.
36. Freije WA, Castro-Vargas FE, Fang Z, Horvath S, Cloughesy T, Liau LM, Mischel PS and Nelson SF. Gene expression profiling of gliomas strongly predicts survival. Cancer research. 2004; 64(18):6503-6510.
37. Nutt CL, Mani DR, Betensky RA, Tamayo P, Cairncross JG, Ladd C, Pohl U, Hartmann C, McLaughlin ME, Batchelor TT, Black PM, von Deimling A, Pomeroy SL, Golub TR and Louis DN. Gene expression-based classification of malignant gliomas correlates better with survival than histological classification. Cancer research. 2003; 63(7):1602-1607.
38. Bauman G, Fisher B, Watling C, Cairncross JG and Macdonald D. Adult supratentorial low-grade glioma: long-term experience at a single institution. International journal of radiation oncology, biology, physics. 2009; 75(5):1401-1407.
39. Chaudhry NS, Shah AH, Ferraro N, Snelling BM, Bregy A, Madhavan K and Komotar RJ. Predictors of long-term survival in patients with glioblastoma multiforme: advancements from the last quarter century. Cancer investigation. 2013; 31(5):287-308.
40. Krex D, Klink B, Hartmann C, von Deimling A, Pietsch T, Simon M, Sabel M, Steinbach JP, Heese O, Reifenberger G, Weller M, Schackert G and German Glioma N. Long-term survival with glioblastoma multiforme. Brain : a journal of neurology. 2007; 130(Pt 10):2596-2606.
41. Ducray F, Idbaih A, Wang XW, Cheneau C, Labussiere M and Sanson M. Predictive and prognostic factors for gliomas. Expert review of anticancer therapy. 2011; 11(5):781-789.
42. Nobusawa S, Watanabe T, Kleihues P and Ohgaki H. IDH1 mutations as molecular signature and predictive factor of secondary glioblastomas. Clinical cancer research : an official journal of the American Association for Cancer Research. 2009; 15(19):6002-6007.
43. Weller M, Felsberg J, Hartmann C, Berger H, Steinbach JP, Schramm J, Westphal M, Schackert G, Simon M, Tonn JC, Heese O, Krex D, Nikkhah G, Pietsch T, Wiestler O, Reifenberger G, et al. Molecular predictors of progression-free and overall survival in patients with newly diagnosed glioblastoma: a prospective translational study of the German Glioma Network. Journal of clinical oncology : official journal of the American Society of Clinical Oncology. 2009; 27(34):5743-5750.
44. Desgrosellier JS and Cheresh DA. Integrins in cancer: biological implications and therapeutic opportunities. Nature reviews Cancer. 2010; 10(1):9-22.
45. Tiwari N, Gheldof A, Tatari M and Christofori G. EMT as the ultimate survival mechanism of cancer cells. Seminars in cancer biology. 2012; 22(3):194-207.
46. Zhou YC, Liu JY, Li J, Zhang J, Xu YQ, Zhang HW, Qiu LB, Ding GR, Su XM, Mei S and Guo GZ. Ionizing radiation promotes migration and invasion of cancer cells through transforming growth factor-beta-mediated epithelial-mesenchymal transition. International journal of radiation oncology, biology, physics. 2011; 81(5):1530-1537.
47. Theys J, Jutten B, Habets R, Paesmans K, Groot AJ, Lambin P, Wouters BG, Lammering G and Vooijs M. E-Cadherin loss associated with EMT promotes radioresistance in human tumor cells. Radiotherapy and oncology : journal of the European Society for Therapeutic Radiology and Oncology. 2011; 99(3):392-397.
48. Gravendeel LA, Kouwenhoven MC, Gevaert O, de Rooi JJ, Stubbs AP, Duijm JE, Daemen A, Bleeker FE, Bralten LB, Kloosterhof NK, De Moor B, Eilers PH, van der Spek PJ, Kros JM, Sillevis Smitt PA, van den Bent MJ, et al. Intrinsic gene expression profiles of gliomas are a better predictor of survival than histology. Cancer research. 2009; 69(23):9065-9072.
49. Cancer Genome Atlas Research N. Comprehensive genomic characterization defines human glioblastoma genes and core pathways. Nature. 2008; 455(7216):1061-1068.
50. Subramanian A, Tamayo P, Mootha VK, Mukherjee S, Ebert BL, Gillette MA, Paulovich A, Pomeroy SL, Golub TR, Lander ES and Mesirov JP. Gene set enrichment analysis: a knowledge-based approach for interpreting genome-wide expression profiles. Proceedings of the National Academy of Sciences of the United States of America. 2005; 102(43):15545-15550.