
INTRODUCTION
Breast cancer is the most frequently diagnosed cancer globally and is the leading cause of cancer-related deaths among women [1]. In the United States, more than 240,000 newly diagnosed breast cancer cases and 40,000 deaths were reported in 2016 [2]. Liver metastasis is reported in 15% of newly diagnosed breast cancer patients [3, 4]. Breast cancer liver metastasis is associated with very poor prognosis and has a survival time of only 4-8 months, if untreated [5]. Introduction of new therapies in the last decade has resulted in 1-2% yearly decrease in mortality rates [6]. However, breast cancer patients with liver metastasis still are associated with very poor outcomes [7].
Metastatic disease is a complex, multistage process that involves detachment of breast cancer cells from the primary tumor, which then travel through the blood or lymphatic system and finally survive and proliferate in the liver. Given the complex multistep process, liver metastasis involves a sophisticated network of molecular events. However, the molecular mechanisms associated with breast cancer metastasis to the liver are unclear, and their understanding is essential for developing more effective therapies. In this study, therefore, we generated a genetic interaction network using microarray gene expression data from breast cancer liver metastases and explored the molecular mechanisms involved using bioinformatic analyses.
RESULTS
Forty-eight genes are differentially expressed in metastatic breast tumor cells
Table 1 lists the differentially expressed genes with a fold change ≥2 and false discovery rate ≤ 5%. There were 48 differentially expressed genes that were distinctly upregulated (4 genes) or downregulated (44 genes) in metastatic tumor cells than in normal parental cells. Figure 1 shows the heat map of the differentially expressed genes.
Table 1: Significant genes identified by significant analysis of microarray (SAM) in liver-aggressive explant versus primary tumor explant
Gene ID |
Gene Name |
Fold Change |
Gene regulation |
|---|---|---|---|
A_52_P618173 |
Limch1 |
2.290749902 |
Up |
A_52_P418791 |
Rbp1 |
2.424147188 |
Up |
A_51_P423484 |
Rbp1 |
2.165856946 |
Up |
A_52_P299915 |
Map2k6 |
2.176087369 |
Up |
A_51_P102538 |
Otop1 |
0.336723951 |
Down |
A_51_P289341 |
Fermt1 |
0.317362329 |
Down |
A_52_P452667 |
Prom2 |
0.285970233 |
Down |
A_51_P333923 |
Tspan1 |
0.315241505 |
Down |
A_51_P167489 |
Lama3 |
0.41612039 |
Down |
A_51_P177242 |
Unc13b |
0.418318499 |
Down |
A_52_P88091 |
Dsg2 |
0.403969687 |
Down |
A_51_P233153 |
Cadps2 |
0.298078637 |
Down |
A_51_P196207 |
Capsl |
0.388252581 |
Down |
A_52_P79821 |
Esrp1 |
0.26893644 |
Down |
A_52_P559779 |
Dsg2 |
0.347328438 |
Down |
A_51_P493987 |
Moxd1 |
0.417459194 |
Down |
A_52_P87757 |
Il24 |
0.336785971 |
Down |
A_52_P134455 |
Fermt1 |
0.367135842 |
Down |
A_51_P356055 |
Grp |
0.449573589 |
Down |
A_51_P353252 |
Mal2 |
0.291415896 |
Down |
A_51_P187602 |
Serpinb5 |
0.3120555 |
Down |
A_52_P638605 |
Ap1m2 |
0.436913739 |
Down |
A_51_P105879 |
Myo5b |
0.486596961 |
Down |
A_52_P405945 |
Prl3d2 |
0.483474132 |
Down |
A_51_P401517 |
Il24 |
0.483144818 |
Down |
A_52_P252931 |
Dsc2 |
0.491809463 |
Down |
A_52_P468068 |
Tchh |
0.490774711 |
Down |
A_51_P322115 |
Htr5b |
0.372641522 |
Down |
A_52_P286350 |
Sh2d1b1 |
0.471867312 |
Down |
A_52_P487686 |
BC100530 |
0.483518325 |
Down |
A_51_P489488 |
Pde4dip |
0.487698119 |
Down |
A_51_P179293 |
2310002L13Rik |
0.382311761 |
Down |
A_51_P322090 |
Ovol2 |
0.489037358 |
Down |
A_52_P661412 |
Adora1 |
0.485167002 |
Down |
A_52_P683580 |
Tbc1d9 |
0.471654273 |
Down |
A_51_P206475 |
Lce1i |
0.476512201 |
Down |
A_51_P496540 |
Sh2d1b1 |
0.488430246 |
Down |
A_52_P601757 |
Dsg2 |
0.414988774 |
Down |
A_51_P496253 |
Slc6a4 |
0.464974691 |
Down |
A_51_P438283 |
Il1a |
0.497937489 |
Down |
A_51_P455620 |
Fam167a |
0.45781262 |
Down |
A_51_P332309 |
Eomes |
0.434829918 |
Down |
A_51_P225827 |
Ovol1 |
0.474676527 |
Down |
A_51_P338878 |
P2ry12 |
0.424196491 |
Down |
A_52_P373982 |
Grhl2 |
0.481346604 |
Down |
A_52_P642488 |
Kcnk1 |
0.43461204 |
Down |
A_51_P303079 |
Tmem54 |
0.492962995 |
Down |
A_51_P362328 |
Grhl2 |
0.469572322 |
Down |
Abbreviation: SAM, Significance Analysis Microarray
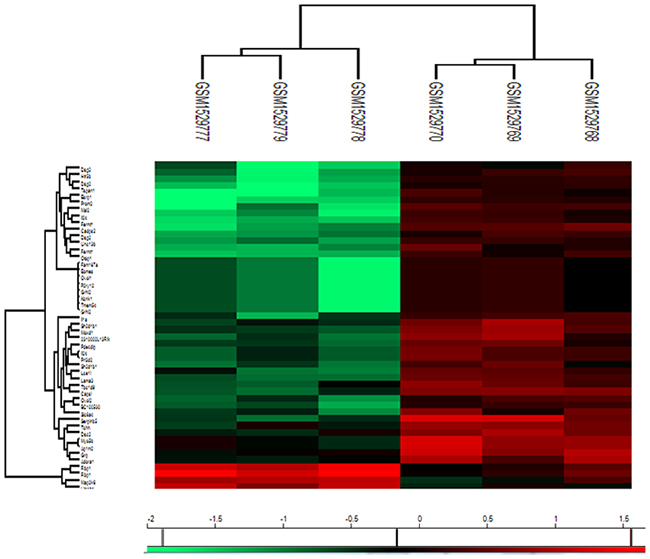
Figure 1: Heatmap visualization of the differently expressed genes identified by Significant Analysis of Microarray (SAM) in metastatic tumor cells (GSM1529777, GSM1529778, GSM1529779) versus 4T1 parental cells (GSM1529768, GSM1529769, GSM1529770). Red represents up-regulated genes, while green represents down-regulated genes.
A genetic interaction network based on the differently expressed genes
A genetic interaction network was constructed from the 48 differentially expressed genes using the String platform future analysis (Figure 2). The interaction network consisted of 84 nodes and 237 edges. The average node degree was 5.64. The network was reliably robust with a clustering coefficient (cc) of 0.598 and protein-protein interaction (PPI) enrichment p value of zero.
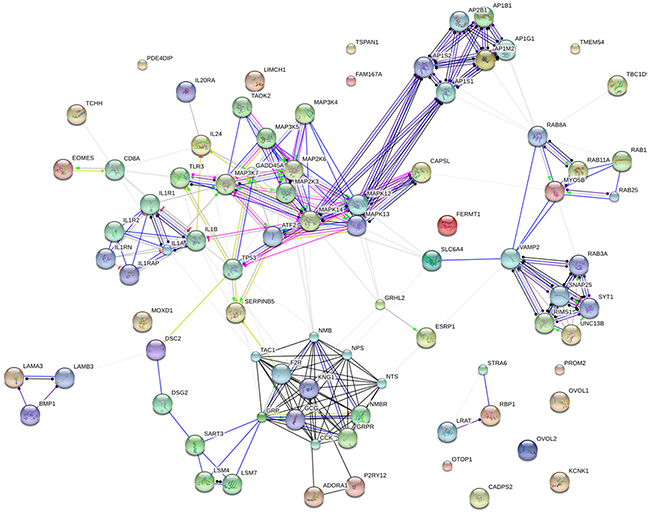
Figure 2: Genetic interaction network associated with breast cancer liver metastases basing on String platform. In this figure, each circle represents a gene (node) and each connection represents a direct or indirect connection (edge). Line color indicates the type of interaction evidence and line thickness indicates the strength of data support.
GO analysis of the differently expressed genes
Molecular function analysis by the GO con-sortium database revealed that most of the differently expressed genes regulated protein binding and kinase activity (Table 2). Besides, the major biological processes associated with the liver metastases were positive regulation of cell communication, MAPK cascade, signaling, and protein kinase activity (Table 3).
Table 2: Molecular function analysis of the genetic interaction network associated with liver-aggressive explant in terms of Gene Ontology (GO)
GO ID |
Molecular Function |
Observed Gene Count |
FDR |
|---|---|---|---|
GO.0004702 |
receptor signaling protein serine/threonine kinase activity |
15 |
3.13E-21 |
GO.0005515 |
protein binding |
7 |
2.03E-05 |
GO.0004708 |
MAP kinase kinase activity |
41 |
2.41E-05 |
GO.0017137 |
Rab GTPase binding |
5 |
2.74E-05 |
GO.0031489 |
myosin V binding |
6 |
0.000307 |
GO.0017022 |
myosin binding |
4 |
0.000381 |
GO.0004709 |
MAP kinase kinase kinase activity |
5 |
0.000518 |
GO.0005488 |
binding |
4 |
0.00169 |
GO.0017075 |
syntaxin-1 binding |
59 |
0.00354 |
GO.0004707 |
MAP kinase activity |
3 |
0.00402 |
GO.0004674 |
protein serine/threonine kinase activity |
3 |
0.00636 |
GO.0004946 |
bombesin receptor activity |
9 |
0.0113 |
GO.0005102 |
receptor binding |
2 |
0.0128 |
GO.0004908 |
interleukin-1 receptor activity |
14 |
0.018 |
GO.0019905 |
syntaxin binding |
2 |
0.0215 |
GO.0019899 |
enzyme binding |
4 |
0.0253 |
GO.0004871 |
signal transducer activity |
15 |
0.032 |
GO.0005179 |
hormone activity |
16 |
0.0377 |
GO.0060089 |
molecular transducer activity |
4 |
0.0377 |
GO.0086083 |
cell adhesive protein binding involved in bundle of His |
17 |
0.0377 |
Abbreviations: FDR, false discovery rate; GO, Gene Ontology.
Table 3: Biological process analysis of the genetic interaction network associated with liver-aggressive explant in terms of Gene Ontology (GO)
GO ID |
Biological Process |
Observed Gene Count |
FDR |
|---|---|---|---|
GO.0051046 |
regulation of secretion |
21 |
5.45E-10 |
GO.0080134 |
regulation of response to stress |
28 |
6.97E-10 |
GO.1903530 |
regulation of secretion by cell |
19 |
4.53E-09 |
GO.0051047 |
positive regulation of secretion |
15 |
8.72E-09 |
GO.0032101 |
regulation of response to external stimulus |
20 |
1.24E-07 |
GO.0032879 |
regulation of localization |
31 |
1.24E-07 |
GO.0051049 |
regulation of transport |
27 |
1.24E-07 |
GO.0051050 |
positive regulation of transport |
20 |
1.24E-07 |
GO.0031347 |
regulation of defense response |
18 |
3.95E-07 |
GO.0010647 |
positive regulation of cell communication |
25 |
4.18E-07 |
GO.0060341 |
regulation of cellular localization |
22 |
4.18E-07 |
GO.0043410 |
positive regulation of MAPK cascade |
14 |
8.81E-07 |
GO.0014047 |
glutamate secretion |
6 |
1.17E-06 |
GO.0050690 |
regulation of defense response to virus by virus |
6 |
1.38E-06 |
GO.0023056 |
positive regulation of signaling |
23 |
1.79E-06 |
GO.0051650 |
establishment of vesicle localization |
10 |
2.00E-06 |
GO.0046717 |
acid secretion |
7 |
3.36E-06 |
GO.0001934 |
positive regulation of protein phosphorylation |
17 |
5.02E-06 |
GO.0016079 |
synaptic vesicle exocytosis |
37 |
3.10E-13 |
GO.0045860 |
positive regulation of protein kinase activity |
11 |
3.55E-13 |
Abbreviations: FDR, false discovery rate; GO, Gene Ontology; MAPK: mitogen-actived protein kinase.
Signaling pathways involved in breast cancer liver metastasis
Table 4 shows the signaling pathways involved in breast cancer liver metastases by the KEGG database. The major signaling pathways included the MAPK, NF-kappa B and VEGF signaling pathways that maybe critical for the distinct pathological stages of liver metastasis.
Table 4: Signaling pathway analysis of the genetic interaction network associated with liver-aggressive explant in terms of Gene Ontology (GO)
Pathway ID |
Signaling pathway |
Observed Gene Count |
FDR |
|---|---|---|---|
4010 |
MAPK signaling pathway |
16 |
1.42E-12 |
4668 |
TNF signaling pathway |
9 |
7.29E-08 |
5014 |
Amyotrophic lateral sclerosis (ALS) |
7 |
1.26E-07 |
4750 |
Inflammatory mediator regulation of TRP channels |
8 |
3.45E-07 |
4380 |
Osteoclast differentiation |
8 |
1.45E-06 |
5140 |
Leishmaniasis |
6 |
1.24E-05 |
4721 |
Synaptic vesicle cycle |
5 |
0.000104 |
4664 |
Fc epsilon RI signaling pathway |
5 |
0.000156 |
4660 |
T cell receptor signaling pathway |
5 |
0.000787 |
5146 |
Amoebiasis |
5 |
0.000993 |
4060 |
Cytokine-cytokine receptor interaction |
7 |
0.00133 |
4722 |
Neurotrophin signaling pathway |
5 |
0.00145 |
5160 |
Hepatitis C |
5 |
0.00206 |
4015 |
Rap1 signaling pathway |
6 |
0.00207 |
4911 |
Insulin secretion |
4 |
0.00355 |
4728 |
Dopaminergic synapse |
4 |
0.0148 |
5131 |
Shigellosis |
3 |
0.0148 |
4370 |
VEGF signaling pathway |
3 |
0.0155 |
5162 |
Measles |
4 |
0.0162 |
5120 |
Epithelial cell signaling in Helicobacter pylori infection |
3 |
0.0194 |
5222 |
Small cell lung cancer |
3 |
0.0351 |
4064 |
NF-kappa B signaling pathway |
3 |
0.0384 |
5168 |
Herpes simplex infection |
4 |
0.0384 |
4723 |
Retrograde endocannabinoid signaling |
3 |
0.0473 |
Abbreviations: FDR, false discovery rate; GO, Gene Ontology.
DISCUSSION
Breast cancer liver metastasis is a complex process that includes tumor cell dissemination from the primary tumor, transit through the blood or lymphatic system, and proliferation in liver. Underlying this complex multistep process is a sophisticated network of molecular events. In this study, we generated, for the first time, a comprehensive genetic interaction network from the microarray gene expression profile to identify the molecular mechanisms involved in breast cancer liver metastases. The results suggested that MAPK, NF-kappa B and VEGF signaling pathways are significantly associated with distinct stages of breast cancer liver metastasis.
Dissemination of carcinoma cells is the initial step of the metastasis, which is initiated by epithelial-mesenchymal transition (EMT) program during which tumor cells acquire mesenchymal features and lose epithelial properties [8, 9]. The complex molecular events during EMT are initiated and controlled by signaling pathways that respond to extracellular cues. The transforming growth factor-β (TGF-β) signaling family plays a predominant role in EMT [10]. Moreover, the MAPK signaling pathway is required for the initiation of TGF-β induced EMT [11, 12]. In addition to TGF-β family proteins, tyrosine kinase receptors (RTKs) play a key role in the trans-differentiation process, further highlighting the importance of MAPK signaling [13]. MAPK pathway inhibitors have been used clinically for many cancers, including breast cancer [14]. In addition, NFκB is an important regulator of the expression of various proteins involved in the immune response [15].
After successfully disassociating from the primary tumor, metastatic carcinoma cells traverse the blood or lymphatic system, during which they interact with several cell types including platelets, neutrophils, monocytes, macrophages, and endothelial cells [16]. The circulating tumor cells also interact with platelets [17] and high platelet counts are associated with poor prognosis in carcinomas [18]. Recent studies have revealed that platelets alter the fate of circulating cancer cells [19]. Platelet-tumor cell contacts and platelet-derived TGF-β synergistically activate the TGF-β/Smad and NFκB pathways in cancer cells enabling their transition to an invasive mesenchymal-like phenotype, thereby enhancing metastasis [20]. Inhibition of NFκB signaling in cancer cells or ablation of TGF-β1 expression in platelets protects against lung metastasis in vivo [20].
In the liver, a pre-metastatic niche is established by VEGFR+ bone marrow progenitors before the arrival of tumor cells [21]. In fact, the initial events during the development of metastasis are VEGF-dependent [22]. Once the metastatic cancer cells survive in the new environment, they undergo colonization before the onset of the final process of malignancy. In general, a tumor requires angiogenesis to grow beyond 1-2 mm in size. In the initial pre-vascular phase, the size of the tumor does not exceed a few millimeters, but, neo-vascularization results in rapid growth of the tumor. Vascular endothelial growth factor (VEGF) is a key regulator of angiogenesis, which stimulates endothelial proliferation and migration, inhibits endothelial apoptosis, and increases vascular permeability and vasodilatation [23]. VEGF-targeting therapy has shown significant benefits in the treatment of metastatic breast cancer [24, 25]. In conclusion, based on the genetic interaction network, we identified MAPK, NF-kappa B and VEGF signaling pathways as key regulators of breast cancer liver metastasis.
MATERIALS AND METHODS
Microarray dataset resources
Microarray dataset with the accession number GSE62598 was downloaded from Gene Expression Omnibus (GEO). In this study, the authors examined if the propensity of breast cancer cells to metastasize to liver was associated with distinct patterns of immune cell infiltration [26]. Total RNA was extracted from 4T1 parental and individual metastatic sub-populations. The mRNA array was performed on Agilent-014868 Whole Mouse Genome Microarray 4×44k G4122F platform.
Analysis of differentially expressed genes
The gene expression profiles of metastatic tumor cells versus disseminated tumor cells were normalized by log10 transformation after normalization. Then, Significance Analysis of Microarrays software (SAM, http://statweb.stanford.edu/~tibs/SAM/) was used to produce a cluster of up- or down-regulated genes [27].
Genetic interaction network construction
Genetic interaction network was constructed using the String consortium database (http://string-db.org/). In addition, to identify the pathways involved Gene Ontology consortium (GO, http://www.geneontology.org/) and Kyoto Encyclopedia of Genes and Genomes (KEGG, http://www.genome.jp/kegg/) functional enrichment analysis was performed using the Database for Annotation, Visualization and Integrated Discovery (DAVID, https://david.ncifcrf.gov/).
Statistical analysis
According to a previous publication [28], gene expression was considered significant if the threshold of false discovery rate (FDR) ≤ 5% and fold change ≥ 2. For GO and KEGG enrichment analysis, biological process, molecular function and signaling pathways, p ≤ 5% was considered significant.
Author contributions
All authors contributed towards data analysis, drafting and revising the paper and agree to be accountable for all aspects of the work.
ACKNOWLEDGMENTS
We thank Gene Expression Omnibus (GEO), Significance Analysis of Microarrays (SAM), and String databases for making their data readily available to the scientific community.
CONFLICTS OF INTEREST
The authors declare no conflicts of interest.
REFERENCES
1. Forouzanfar MH, Foreman KJ, Delossantos AM, Lozano R, Lopez AD, Murray CJ, Naghavi M. Breast and cervical cancer in 187 countries between 1980 and 2010: a systematic analysis. Lancet. 2011; 378:1461–84. https://doi.org/10.1016/S0140-6736(11)61351-2.
2. Siegel RL, Miller KD, Jemal A. Cancer statistics, 2016. CA Cancer J Clin. 2016; 66:7–30. https://doi.org/10.3322/caac.21332.
3. Clark GM, Sledge GW Jr, Osborne CK, McGuire WL. Survival from first recurrence: relative importance of prognostic factors in 1,015 breast cancer patients. J Clin Oncol. 1987; 5:55–61. https://doi.org/10.1200/JCO.1987.5.1.55.
4. Insa A, Lluch A, Prosper F, Marugan I, Martinez-Agullo A, Garcia-Conde J. Prognostic factors predicting survival from first recurrence in patients with metastatic breast cancer: analysis of 439 patients. Breast Cancer Res Treat. 1999; 56:67–78.
5. Adam R, Aloia T, Krissat J, Bralet MP, Paule B, Giacchetti S, Delvart V, Azoulay D, Bismuth H, Castaing D. Is liver resection justified for patients with hepatic metastases from breast cancer? Ann Surg. 2006; 244:897–907. https://doi.org/10.1097/01.sla.0000246847.02058.1b.
6. Pagani O, Senkus E, Wood W, Colleoni M, Cufer T, Kyriakides S, Costa A, Winer EP, Cardoso F, ESO-MBC Task Force. International guidelines for management of metastatic breast cancer: can metastatic breast cancer be cured? J Natl Cancer Inst. 2010; 102:456–63. https://doi.org/10.1093/jnci/djq029.
7. Senkus E, Cardoso F, Pagani O. Time for more optimism in metastatic breast cancer? Cancer Treat Rev. 2014; 40:220–28. https://doi.org/10.1016/j.ctrv.2013.09.015.
8. Fischer KR, Durrans A, Lee S, Sheng J, Li F, Wong ST, Choi H, El Rayes T, Ryu S, Troeger J, Schwabe RF, Vahdat LT, Altorki NK, et al. Epithelial-to-mesenchymal transition is not required for lung metastasis but contributes to chemoresistance. Nature. 2015; 527:472–6. https://doi.org/10.1038/nature15748.
9. Zheng X, Carstens JL, Kim J, Scheible M, Kaye J, Sugimoto H, Wu CC, LeBleu VS, Kalluri R. Epithelial-to-mesenchymal transition is dispensable for metastasis but induces chemoresistance in pancreatic cancer. Nature. 2015; 527:525–530. https://doi.org/https://doi.org/10.1038/nature16064.
10. Lamouille S, Xu J, Derynck R. Molecular mechanisms of epithelial-mesenchymal transition. Nat Rev Mol Cell Biol. 2014; 15 :178–96. https://doi.org/10.1038/nrm3758.
11. Wojciechowski MC, Mahmutovic L, Shu DY, Lovicu FJ. ERK1/2 signaling is required for the initiation but not progression of TGFβ-induced lens epithelial to mesenchymal transition (EMT). Exp Eye Res. 2017; 159:98–113. https://doi.org/10.1016/j.exer.2017.03.012.
12. Hu X, Zhai Y, Kong P, Cui H, Yan T, Yang J, Qian Y, Ma Y, Wang F, Li H, Cheng C, Zhang L, Jia Z, et al. FAT1 prevents epithelial mesenchymal transition (EMT) via MAPK/ERK signaling pathway in esophageal squamous cell cancer. Cancer Lett. 2017; 397:83–93. https://doi.org/10.1016/j.canlet.2017.03.033.
13. Doehn U, Hauge C, Frank SR, Jensen CJ, Duda K, Nielsen JV, Cohen MS, Johansen JV, Winther BR, Lund LR, Winther O, Taunton J, Hansen SH, Frödin M. RSK is a principal effector of the RAS-ERK pathway for eliciting a coordinate promotile/invasive gene program and phenotype in epithelial cells. Mol Cell. 2009; 35:511–22. https://doi.org/10.1016/j.molcel.2009.08.002.
14. Saini KS, Loi S, de Azambuja E, Metzger-Filho O, Saini ML, Ignatiadis M, Dancey JE, Piccart-Gebhart MJ. Targeting the PI3K/AKT/mTOR and Raf/MEK/ERK pathways in the treatment of breast cancer. Cancer Treat Rev. 2013; 39:935–46. https://doi.org/10.1016/j.ctrv.2013.03.009.
15. Hayden MS, Ghosh S. Shared principles in NF-kappaB signaling. Cell. 2008; 132:344–62. https://doi.org/10.1016/j.cell.2008.01.020.
16. Lambert AW, Pattabiraman DR, Weinberg RA. Emerging Biological Principles of Metastasis. Cell. 2017; 168:670–691. https://doi.org/10.1016/j.cell.2016.11.037.
17. Labelle M, Hynes RO. The initial hours of metastasis: the importance of cooperative host-tumor cell interactions during hematogenous dissemination. Cancer Discov. 2012; 2:1091–9. https://doi.org/10.1158/2159-8290.CD-12-0329.
18. Gay LJ, Felding-Habermann B. Contribution of platelets to tumour metastasis. Nat Rev Cancer. 2011; 11:123–34. https://doi.org/10.1038/nrc3004.
19. Franco AT, Corken A, Ware J. Platelets at the interface of thrombosis, inflammation, and cancer. Blood. 2015; 126:582–8. https://doi.org/10.1182/blood-2014-08-531582.
20. Labelle M, Begum S, Hynes RO. Direct signaling between platelets and cancer cells induces an epithelial-mesenchymal-like transition and promotes metastasis. Cancer Cell. 2011; 20:576–90. https://doi.org/10.1016/j.ccr.2011.09.009.
21. Kaplan RN, Riba RD, Zacharoulis S, Bramley AH, Vincent L, Costa C, MacDonald DD, Jin DK, Shido K, Kerns SA, Zhu Z, Hicklin D, Wu Y, et al. VEGFR1-positive haematopoietic bone marrow progenitors initiate the pre-metastatic niche. Nature. 2005; 438:820–7. https://doi.org/10.1038/nature04186.
22. Steeg PS. Tumor metastasis: mechanistic insights and clinical challenges. Nat Med. 2006; 12:895–904. https://doi.org/10.1038/nm1469.
23. Ferrara N, Davis-Smyth T. The biology of vascular endothelial growth factor. Endocr Rev. 1997; 18:4–25. https://doi.org/10.1210/edrv.18.1.0287.
24. Miller K, Wang M, Gralow J, Dickler M, Cobleigh M, Perez EA, Shenkier T, Cella D, Davidson NE. Paclitaxel plus bevacizumab versus paclitaxel alone for metastatic breast cancer. N Engl J Med. 2007; 357:2666–76. https://doi.org/10.1056/NEJMoa072113.
25. Miles DW, Chan A, Dirix LY, Cortés J, Pivot X, Tomczak P, Delozier T, Sohn JH, Provencher L, Puglisi F, Harbeck N, Steger GG, Schneeweiss A, et al. Phase III study of bevacizumab plus docetaxel compared with placebo plus docetaxel for the first-line treatment of human epidermal growth factor receptor 2-negative metastatic breast cancer. J Clin Oncol. 2010; 28:3239–47. https://doi.org/10.1200/JCO.2008.21.6457.
26. Tabariès S, Ouellet V, Hsu BE, Annis MG, Rose AA, Meunier L, Carmona E, Tam CE, Mes-Masson AM, Siegel PM. Granulocytic immune infiltrates are essential for the efficient formation of breast cancer liver metastases. Breast Cancer Res. 2015; 17:45. https://doi.org/10.1186/s13058-015-0558-3.
27. Tusher VG, Tibshirani R, Chu G. Significance analysis of microarrays applied to the ionizing radiation response. Proc Natl Acad Sci USA. 2001; 98:5116–21. https://doi.org/10.1073/pans.091062498.
28. Fan S, Li X, Tie L, Pan Y, Li X. KIAA0101 is associated with human renal cell carcinoma proliferation and migration induced by erythropoietin. Oncotarget. 2016; 7:13520–13537. https://doi.org/10.18632/oncotarget.5876.