
INTRODUCTION
Diabetic cardiomyopathy refers to a disease process that affects the myocardium in the diabetic heart, thereby causing a variety of structural abnormalities and ultimately leading to left ventricular hypertrophy and dysfunction [1, 2]. Hyperglycemia is an independent risk factor for diabetic cardiac injury, the development and progression of diabetic cardiomyopathy are closely associated with the duration and severity of high glucose [3–6]. However, current treatments cannot effectively reduce diabetic cardiomyopathy in diabetic patients, indicating that other mechanisms remain to be discovered.
Numerous studies in both human subjects and animal models have confirmed that perturbations of the internal clock system constitute risk factors for such disorders as obesity, type 2 diabetes, and cardiovascular disease [7–11]. The circadian clock is an evolutionarily conserved fundamental mechanism in organisms, a biological response to Earth’s diurnal cycles. In mammals, circadian rhythms are driven by a group of clock genes that include Bmal1, Clock, Cry, and Per. These genes are rhythmically expressed in the suprachiasmatic nucleus (SCN), the master clock that resides in the hypothalamus, and in nearly all peripheral tissues, where they control the expression of various target genes in a circadian manner, thus affecting many biochemical and physiological processes [12–14]. The clocks are present even when cells are in culture, indicating that the basic mechanism is intrinsic and self-sustained [15]. As a core clock gene, Bmal1 plays a key role in the generation and maintenance of circadian rhythms. Bmal1-knockout mice display a complete loss of circadian rhythms [16]. In addition, alterations of circadian clock activity are present in the Streptozotocin-induced diabetic heart [17]. Genetic disruption of Bmal1 induces an abnormal metabolic phenotype characterized by impaired gluconeogenesis, hyperleptinemia, glucose intolerance, and dyslipidemia [18–20]. Given this evidence, we hypothesized that the circadian gene Bmal1 might participate in the pathogenesis of diabetic cardiomyopathy and that such a connection would furnish new opportunities for mechanism-based diabetic cardiomyopathy therapeutics.
Autophagy is a dynamic process in which damaged or aged intracellular organelles and long-lived proteins are sequestered into double-membraned vesicles termed autophagosomes. Autophagosomes then fuse with lysosomes for the degradation and recycling of their contents [21–25]. It has been reported that high-glucose inhibits autophagy in cardiomyocytes, while autophagy suppression is protective against high-glucose-induced cardiomyocyte injury [26]. These results indicate an association between altered autophagy and diabetic cardiac injury.
In this study, we sought to address 3 questions. (1) Does the circadian clock gene Bmal1 impact cardiomyocyte death and survival under high-glucose conditions? (2) How is altered autophagy involved in the impact of altered Bmal1 expression on cardiomyocyte viability in response to high glucose? (3) What is the molecular mechanism underlying the change in autophagy activity in response to alterations in Bmal1 expression? Our results demonstrated that the clock gene Bmal1 regulates autophagy via the mTOR pathway and protects cardiomyocytes against high-glucose toxicity.
RESULTS
Effects of altered Bmal1 expression on cardiomyocyte viability in response to high glucose
Disruption of the core clock gene Bmal1 leads to the complete loss of circadian rhythms under free-run conditions [16]. We, therefore, used lentivirus to deliver a short hairpin RNA (shRNA) against Bmal1 mRNA that would knock down (KD) the expression of the Bmal1 gene in cultured neonatal rat cardiomyocytes (NRCMs, Supplementary Figure 1A and 1B). We then exposed the cells to normal (5.5 mM) and high (25 mM) concentrations of glucose to study the effects of circadian disruption on cardiomyocyte survival in response to high glucose. Supplementary Figure 2 shows alteration of Bmal1 expression in transduced cardiomyocytes. Interestingly, we found that the effects of altered Bmal1 expression on cardiomyocyte viability were detectable only when cells were exposed to high glucose. Compared with the scrambled control (SC) shRNA group, KD of Bmal1 led to a significant increase in cardiomyocyte death under high-glucose conditions (36.92 ± 4.88% in Bmal1shRNA vs. 24.80 ± 4.88% in SCshRNA, p < 0.01, n = 8; Figure 1A and 1B). The proportion of apoptotic cells in the Bmal1 silencing group were dramatically higher, at 30%, compared with 16% in the SC shRNA control group (p < 0.01, n = 8; Figure 1C and 1D). The exacerbated apoptosis was confirmed by examining the abundance of cleaved caspase 3 and PARP (Figure 1E–1G).
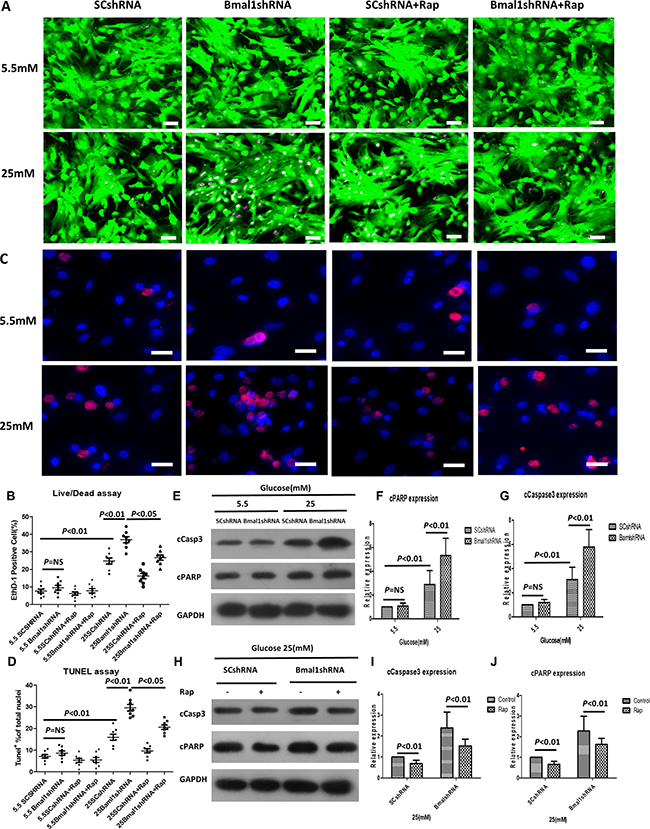
Figure 1: Knockdown of Bmal1 enhances high-glucose-induced cardiomyocyte death, whereas Rap treatment reverses this effect. Cell death was determined by live/dead assay (A, B), apoptosis was measured by TUNEL assay (C, D), and cleavage of caspase3 (E, F, and H, I) and PARP (E, G, and H, J). (A) Representative fluorescent micrographs showing cardiomyocytes viability (Live, green fluorescent calcein-AM; dead, red fluorescent ethidium homodimer-1). (B) Quantification of dead cells by live/dead assay (n = 8). (C) Representative fluorescent micrographs showing apoptosis (Apoptotic cells, red; DAPI for nucleus, blue). (D) Quantification of apoptotic cells by TUNEL assay (n = 8). (E, H) Cleavage of caspase3 and PARP expression were analyzed by western blotting. Bands of interest were first normalized to GAPDH, and then compared with control (E, Bmal1shRNA in 5.5 mM group. H, Bmal1shRNA with no Rap), which was defined as 1. (F, I) Quantification of cleavage of caspase3 expression (n = 8). (G, J) Quantification of cleavage of caspase3 expression (n = 8). Data were expressed as the mean ± SEM, and analyzed by two-way ANOVA. p = NS indicates p > 0.05. Abbreviations: SCshRNA, cardiomyocytes were infected with SCshRNA for 18 h and then cultured under the indicated glucose conditions. Bmal1shRNA, cardiomyocytes were infected with Bmal1shRNA for 18 h and then cultured under the indicated glucose conditions. Baml1shRNA+Rap, cardiomyocytes were infected with Bmal1shRNA for 18 h and then cultured under the indicated glucose conditions for 24 h, and treated with Rap (100 nM) for another 24 h. Rap, autophagy inductive agent rapamycin. EthD-1, ethidium homodimer-1. cCasp3, cCaspase3.
In addition, overexpression of Bmal1 (cDNA) protected cardiomyocytes against high-glucose injury, as shown by attenuated cell death (19.54 ± 3.45% in Bmal1cDNA vs. 28.35 ± 5.46% in pcDNA, p < 0.01, n = 8; Figure 2A–2B), decreased TUNEL-positive cells (13.94 ± 2.43% in Bmal1cDNA vs. 20.90 ± 2.49% in pcDNA, p < 0.01, n = 8; Figure 2C–2D), and less cleaved caspase 3 and PARP, as shown by western blot analysis (Figure 2E–2G). However, in cardiomyocytes under normal glucose conditions, altering the expression of Bmal1 did not obviously impact cardiomyocyte survival or death. These results revealed that alterations in Bmal1 levels had an effect only under hyperglycemic conditions, as disruption of Bmal1 aggravated hyperglycemic toxicity as evaluated by both cardiomyocyte death and apoptosis.
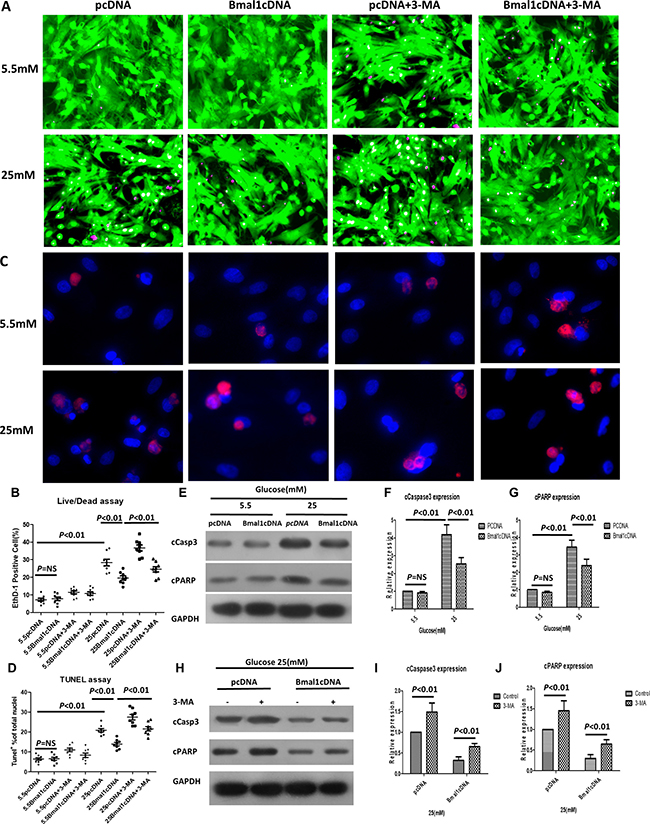
Figure 2: Overexpression of Bmal1 reduces high-glucose-induced cardiomyocyte death, whereas 3-MA treatment reverses this protective effect. Cardiomyocyte death was determined by live/dead assay (A and B), apoptosis was measured by TUNEL assay (C and D), and cleavage of caspase3 (E, F and H, I) and PARP (E, G and H, J). (A) Representative fluorescent micrographs showing cardiomyocytes viability (Live, green fluorescent calcein-AM; dead, red fluorescent ethidium homodimer-1). (B) Quantification of dead cells by live/dead assay (n = 8). (C) Representative fluorescent micrographs showing apoptosis (Apoptotic cells, red; DAPI for nucleus, blue). (D) Quantification of apoptotic cells by TUNEL assay (n = 8). (E, H) Cleavage of caspase3 and PARP expression were analyzed by western blotting. Bands of interest were first normalized to GAPDH, and then compared with control (E, pcDNA in 5.5 mM group. H, pcDNA with no 3-MA), which was defined as 1. (F, I) Quantification of cleavage of caspase3 expression (n = 8). (G, J) Quantification of cleavage of caspase3 expression (n = 8). Data were expressed as the mean ± SEM, and analyzed by two-way ANOVA. p = NS indicates p > 0.05. Abbreviations: pcDNA, cardiomyocytes were infected with pcDNA for 18 h and then cultured under the indicated glucose conditions. Bmal1cDNA, cardiomyocytes were infected with Bmal1cDNA for 18 h and then cultured under the indicated glucose conditions. Baml1cDNA+3-MA, cardiomyocytes were infected with Bmal1cDNA for 18h and then cultured under the indicated glucose conditions for 24 h, and treated with 3-MA (2 mM) for another 24 h. 3-MA, autophagy inhibitor 3-methyladenine. EthD-1, ethidium homodimer-1. cCasp3, cCaspase3.
Altered expression of Bmal1 affects high-glucose-induced inhibition of autophagy
High-glucose-induced suppression of autophagy is reportedly associated with diabetic cardiac injury [26]. We therefore investigated whether Bmal1 can influence cardiomyocyte survival in hyperglycemic conditions by mediating autophagic activity. Autophagosome is the key structure in autophagy (Supplementary Figure 1C and 1D), Beclin-1 (BECN1), microtubule-associated protein light chain 3 (LC3), ATG12-5, and p62 were used as autophagy-related markers. The levels of Beclin1, LC3-II/LC-I and ATG12–5 conjugate are proportional to the number of autophagosomes, while the level of p62 has a negative correlation with autophagic activity [27–31]. As shown in Figure 3A–3C, the levels of LC3-II/LC-I, BECN1, and ATG12–5 conjugates in cardiomyocytes exposed to high glucose were markedly lower than those in cells cultured under normal glucose concentrations, while the p62 protein levels were higher in 25 mM glucose than in 5.5 mM glucose. As a more accurate assessment of autophagy, autophagic flux reflects the number of autophagosomes that are delivered to and degraded in the lysosome and can be detected by the difference between LC3-II protein levels in the absence or presence of lysosomal inhibitors (e.g., bafilomycin A1) [32]. The autophagic flux is shown in Figure 3D (0.69 ± 0.28 in 25 mM glucose vs. 1.57 ± 0.37 in 5.5 mM glucose, p < 0.05, n = 8) as the difference in LC3-II levels (ΔLC3-II = the levels of LC3-II in the presence of BAF - those in the absence of BAF). This analysis clearly showed that high glucose inhibited autophagic activity in cardiomyocytes.
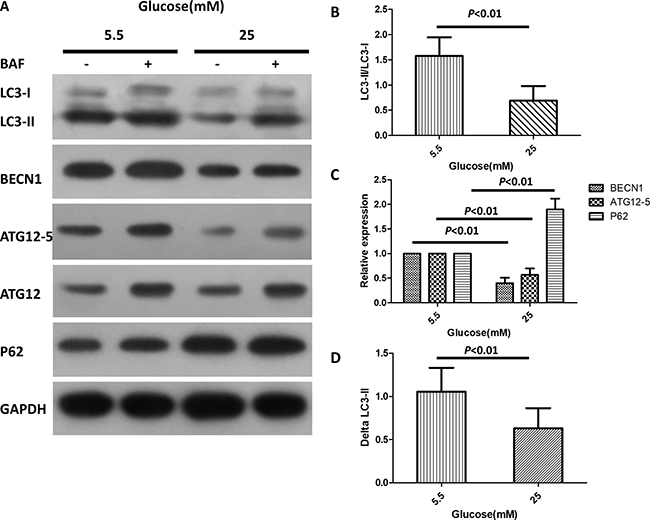
Figure 3: High glucose inhibits autophagy in cardiomyocytes. Cardiomyocytes were cultured in DMEM with normal (5.5 mM) and high doses (25 mM) of glucose for 72 h. (A) Western blotting analysis showing protein levels of LC3-I, LC3-II, BECN1, ATG12–5 conjugates and p62 in the absence or presence of BAF (100 nM). (B–C) Quantification of the protein levels of LC3-II/LC3-I, BECN1, ATG12–5 conjugates and p62. The relative protein levels were first normalized with GAPDH, and then compared with control (5.5 mM glucose with no BAF) which was defined as 1. (D) Quantification of autophagy flux, which is defined as the difference of the LC3-II levels (ΔLC3-II) in the absence or presence of BAF. Data were expressed as the mean ± SEM, and analyzed by Student’s t-test (B and D, n = 8) or two-way ANOVA (C, n = 8). *p < 0.05, **p < 0.01, p = NS indicates p > 0.05. Abbreviations: BAF, lysosome inhibitor bafilomycin A1. BECN1, beclin-1.
We further determined the effects of Bmal1 KD or overexpression on the regulation of autophagic activity in cardiomyocytes. Interestingly, neither overexpression nor silencing of Bmal1 had a significant effect on the autophagic activity of cardiomyocytes cultured in normal glucose concentrations. However, overexpression of Baml1 strikingly increased the abundance of LC3-II, BECN1, and ATG12-5 in cardiomyocytes exposed to high levels of glucose (Figure 4A). Meanwhile, autophagic flux increased to 2-fold that of pcDNA cardiomyocytes, as evidenced by ΔLC3-II levels (0.27 ± 0.021 in Bmal1cDNA vs. 0.14 ± 0.017 in pcDNA, p < 0.01, n = 8; Figure 4B). These results suggested that although overexpression of Bmal1 under hyperglycemic conditions did not further enhance autophagic flux beyond basal levels, it reversed the autophagy inhibition that was triggered by high levels of glucose. Conversely, KD of Bmal1 further reduced autophagic flux to 30% of the SC control in cardiomyocytes cultured in 25 mM glucose (0.049 ± 0.009 in Bmal1shRNA vs. 0.159 ± 0.013 in SCshRNA, p < 0.01, n = 8; Figure 4C and 4D), indicating that high glucose and shBmal1 synergistically inhibited autophagy.
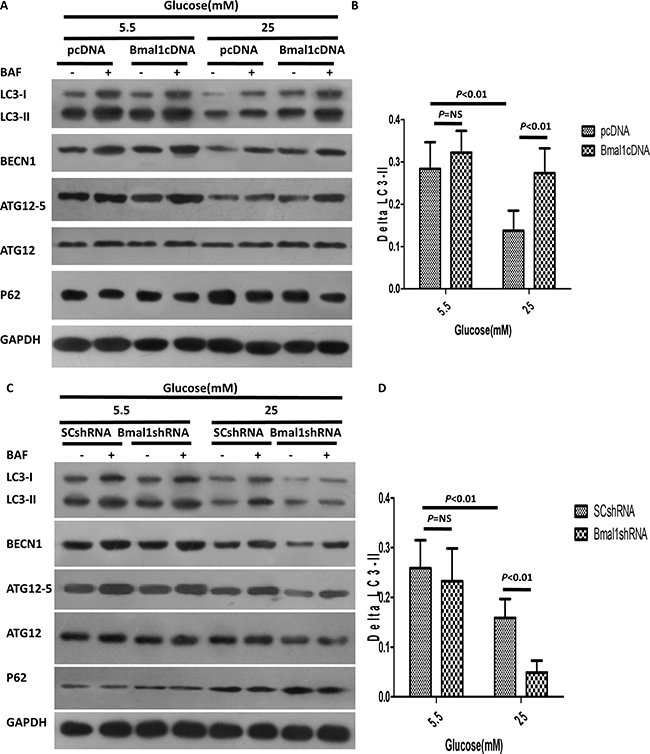
Figure 4: Altered Bmal1 expression affects high-glucose-induced inhibition of autophagy. (A–B) High-glucose-triggered inhibition of autophagy was enhanced by overexpression of Bmal1. (A) Western blotting analysis showing protein levels in the absence or presence of BAF (100 nM). (B) Quantification of autophagic flux by ΔLC3-II. Overexpression of Bmal1 increased autophagic flux only in the cardiomyocytes exposed to 25 mM glucose. (C–D) Bmal1 KD attenuated high-glucose-induced inhibition of autophagy. (C) Western blotting analysis showing protein levels in the absence and presence of BAF (100 nM). (D) Quantification of autophagic flux by ΔLC3-II, Bmal1 KD blocked autophagic flux only in the cardiomyocytes under high glucose condition. Cardiomyocytes were infected with lentivirus for 18 h and then cultured under the indicated glucose conditions for 48 h. pcDNA or SCshRNA was used as a control. Data were expressed as the mean ± SEM, and analyzed by two-way ANOVA (n = 8). p = NS indicates p > 0.05. Abbreviations: BAF, lysosome inhibitor bafilomycin A1. BECN1, beclin-1. ΔLC3-II, the difference of LC3-II levels in the absence or presence of BAF.
Because Bmal1 affects both autophagy and cardiomyocyte survival under hyperglycemic conditions, we hypothesized that Bmal1 affects cardiomyocyte survival under hyperglycemic conditions by regulating autophagic activity. If true, inhibiting autophagy would reduce the protective effect of overexpressing Bmal1; conversely, enhancing autophagy would reduce the injurious effects of silencing Bmal1. To test this hypothesis, the autophagy-inducing agent rapamycin (Rap) and the autophagy inhibitor 3-methyladenine (3-MA) were used to manipulate autophagic activity. As expected, Rap attenuated the Bmal1KD-induced enhancement of hyperglycemia cardiotoxicity, as shown by reduced fractions of dead cells in live/dead staining (Bmal1shRNA 36.92 ± 4.88% vs. 26.72 ± 4.10% Bmal1shRNA plus 100 nM Rap, p < 0.05, n = 8; Figure 1A and 1B) and TUNEL-positive cells (29.57 ± 4.30% in Bmal1shRNA vs. 20.59 ± 2.89% in Bmal1shRNA plus 100 nM Rap, p < 0.05, n = 8; Figure 1C–1D) and by lower levels of cleaved caspase 3 and PARP (Figure 1H–1J). Meanwhile, cardiomyocyte survival caused by overexpression of Bmal1 was reduced by 3-MA, as demonstrated by increased proportions of dead cells in live/dead staining (Bmal1cDNA 19.54 ± 3.45% vs. 24.55 ± 4.28% Bmal1cDNA plus 2 mM 3-MA, p < 0.05, n = 8; Figure 2A and 2B) and TUNEL-positive cells (13.94 ± 2.42 % in Bmal1cDNA vs. 21.57 ± 3.17% in Bmal1cDNA plus 2 mM 3-MA, p < 0.05, n = 8; Figure 2C and 2D) and by enhanced cleavage of caspase 3 and PARP (Figure 2H–2J).
The clock gene Bmal1 induces autophagy by activating the mTORC1 signaling pathway
The mTOR complex 1 (mTORC1) is well known to negatively regulate autophagy [33–35], and the Rap autophagy inducer that we used is an mTOR inhibitor, raising the possibility that the mTOR signaling pathway may be involved in the Bmal1-induced autophagic activity. We thus tested the effects of Bmal1 KD or overexpression on mTORC1 pathway activity. Overexpression of Bmal1 severely inhibited the mTORC1 signaling pathway, as shown by the attenuated phosphorylation of such mTORC1 downstream effectors as p70 ribosomal S6 subunit kinase (p70S6K), ribosomal S6 protein (S6), and elongation factor 4E binding protein (4EBP) (Figure 5A). Conversely, mTORC1 signaling was greatly enhanced by Bmal1 KD (Figure 5B).
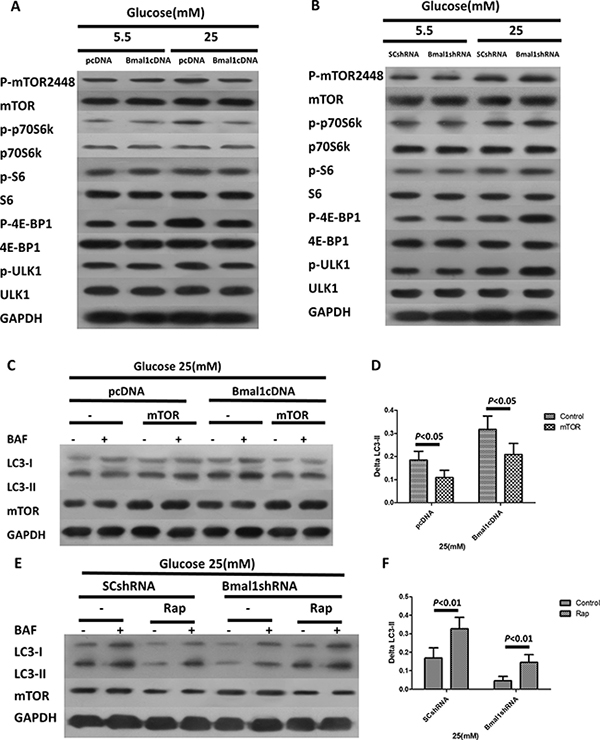
Figure 5: The clock gene Bmal1 induces autophagy by activation of mTORC1 signaling pathway. (A–B) Western blotting analysis showing the protein expression levels and phosphorylation states of the components of mTORC1 signaling pathways in cardiomyocytes with overexpression of Bmal1 (A) and Bmal1 KD (B). (C–D) Rap antagonizes Bmal1 KD –triggered suppression of autophagic flux. (D) Western blotting analysis showing protein levels in the absence or presence BAF (100 nM). (D) Quantification of autophagic flux by ΔLC3-II. (E–F) Overexpression of mTOR blocks Bmal1 overexpression- induced autophagy. (E) Western blotting analysis showing protein levels in the absence and presence BAF (100 nM). (F) Quantification of autophagic flux by ΔLC3-II. Cardiomyocytes were infected with lentivirus for 18 h and then cultured under the indicated glucose conditions for 24 h, and then treated with Rap (100 nM) or infected with mTOR for another 18 h. Data were expressed as the mean ± SEM, and analyzed by two-way ANOVA (n = 8). p = NS indicates p > 0.05. Abbreviations: BAF, lysosome inhibitor bafilomycin A1. BECN1, beclin-1. ΔLC3-II, the difference of LC3-II levels in the absence or presence of BAF.
To further verify the role of mTORC1 in the regulation of autophagic activity in response to altered Bmal1 expression, Bmal1-overexpressing cardiomyocytes were infected with a lentivirus expressing mTOR and then exposed to high glucose. As predicted, overexpression of mTOR decreased autophagic flux (Bmal1cDNA 0.32 ± 0.02 vs. Bmal1cDNA plus mTOR 0.21 ± 0.02, p < 0.05, n= 8; Figure 5C and 5D). Indeed, the mTORC1 inhibitor Rap antagonized the downregulation of autophagic activity triggered by Bmal1 KD, as indicated by ΔLC3-II levels (Bmal1shRNA 0.05 ± 0.01 vs. Bmal1shRNA plus Rap 0.16 ± 0.02, p < 0.01, n = 8; Figure 5E and 5F). Together, these results demonstrated that the autophagy induction triggered by Bmal1 is mediated by inhibition of mTORC1.
DISCUSSION
Several molecular mechanisms have been proposed to contribute to the development of diabetic cardiomyopathy, including hyperglycemia, hyperinsulinemia, and increased circulating fatty acids and triacylglycerols, which alter various molecular pathways within the cardiomyocyte, promote cell injury, and damage cardiac function [36–38]. The failure of current treatments to reduce cardiomyopathy in diabetic patients highlights the need to identify other mechanisms that may contribute to diabetic cardiomyopathy.
It has been demonstrated that the autophagic responses to diabetic cardiomyopathy are distinctly different in type 1 and type 2 Diabetes mellitus(DM), whereas cardiac autophagic activity is enhanced in type 1 DM, it is suppressed in type 2 DM. This dichotomy of autophagy in the diabetic hearts likely reflect a net effect of insulin deficiency or resistance, varying degrees of hyperglycemia, and other diabetes-induced abnormalities such as dyslipidemia [37]. The complicated metabolic and pathological changes in the integral level may also complicate the regulation of Bmal1 to cardiomyocyte autophagy and injury. That was the reason why we decided to use the cultured cell to specifically focus on the Bmal1 gene and high glucose induced cardiomyocyte injury. Recent evidence has confirmed that alterations to circadian clock activity are present in the diabetic heart, and circadian disruption may increase susceptibility to multiple disorders, including obesity, diabetes mellitus, cardiovascular disease, and inflammation [7–11]. In this study, we demonstrated that the core clock gene Bmal1 attenuates high-glucose-induced cardiomyocyte injury by inducing autophagic activity. This conclusion is supported by the result that overexpression of Bmal1 markedly reversed cardiomyocyte damage and autophagy inhibition in response to high levels of glucose. Further suppression of autophagy by 3-MA attenuated the protective effect of Bmal1 expression on cardiomyocytes. Conversely, high-glucose-triggered cardiomyocyte death and suppression of autophagic flux was further aggravated by Bmal1 KD. Moreover, Rap-induced upregulation of autophagy reduced high-glucose toxicity. However, neither overexpression nor downregulated expression of Bmal1 had an obvious effect on cardiomyocyte autophagy or viability at normal glucose concentrations. These results revealed that disruption of the clock gene Bmal1 may be one of the underlying mechanisms contributing to diabetic cardiomyopathy, and this finding may provide a potential therapeutic target for reducing hyperglycemia cardiotoxicity.
Autophagy is a conserved catabolic pathway that has received increasing attention due to its important role in the cytoplasmic quality control and cell homeostasis under both normal and pathological conditions [21–25]. Autophagy has long been considered a survival mechanism that contributes to maintaining energy homeostasis and viability during nutrient or energy limitation and stress conditions [34]. However, autophagy can also cause cardiomyocyte death and heart dysfunction in other situations. Our study indicates that Bmal1 expression increases autophagic activity in cardiomyocytes under high-glucose conditions and that this enhancement of autophagy protects cardiomyocytes against high-glucose toxicity. Our findings in cultured cardiomyocytes, as well as those of Xie et al. [39], Hiromitsu et al. [37] in type 1 DM model, are consistent with the same idea. Hiromisu et al. found that autophagy compensates in an effort to maintain cardiac function in type 1 DM, improvement of autophagy using resveratrol improved cardiac function, while diminished autophagy by chloroquine aggravated both cardiac diastolic and systolic function. [37]. Another study reported that autophagosome maturation is inhibited in high-fat-diet-induced obesity mice, which results in heart dysfunction [40]. Xie et al. report blocked autophagy in hearts of STZ-treated mice and OVE26 type 1 diabetic model mice, which is restored by treatment with metformin to improve cardiac function [39]. However, diametrically opposite reports do exist. Xu et al. reported in the same mice models, proposed inhibition of autophagy as an adaptive response that restricted cardiac dysfunction in type 1 DM [41]. Fructose-induced insulin resistance elevates autophagy, which has been suggested to contribute to cardiac pathology [42]. It is difficult to reconcile those reverse results but we would suggest that the difference might be related to the autophagy assay criteria between the studies (autophagy protein markers vs. autophagy flux). There is another in vitro study found that high glucose inhibits autophagy in cardiomyocytes while autophagy suppression is protective against high-glucose induced cardiomyocyte injury [26], which findings are partly inconsistent with ours. The reason for the contradictory results may attribute to the different glucose concentrations in the two studies (25 mM vs.30 mM). Various glucose concentrations may cause different levels of autophagy on cardiomyocytes, therefore leading to different effects on cell viability. Moreover, autophagy is also activated by other pathological factors, including cardiac hypertrophy [43], cardiac senescence [44], cardiac remodeling [45–46] and so on. Different extents of cardiomyocyte hypertrophy resulted from distinct levels of hyperglycemia in the two studies may also play a role in the inconsistent results. Cardiac senescence and other remodeling factors may have effects as well. Further investigation is warranted regarding these issues. Together, these results emphasize the idea that autophagy can be either protective or detrimental depending on the cell type, the cellular environment, the properties and intensity of the stimulus, and the levels of autophagy. Thus, the functional roles of autophagy under different pathological conditions should be individually determined. In addition, our results suggest that autophagy might be a molecular link between the circadian clock network and a metabolic pathway: it may act to synchronize the external nutritional status of the cells with the core circadian network to optimize nutrient collection and utilization within daily cycles of fasting and feeding. In addition to micro autophagy, studies showed alterations of other types of autophagy such as mitophagy also present in DM patients. Montaigne et al. found mitophagy was significantly decreased in diabetic myocardium, chronic hyperglycemia is a major driver of mitochondrial dysfunction in the diabetic myocardium, the disturbed mitochondrial function, which is associated with decreased contractile performance in heart tissue of diabetic patients before the onset of clinical cardiomyopathy [47]. Further study need be employed on the relationship between Bmal1 gene and mitophagy.
mTORC1 is a nutrient-sensing kinase that can be stimulated by many high-nutrient signals and that then activates anabolic processes such as protein synthesis and suppresses cellular catabolic pathways such as autophagy [33–35]. Our study indicates that mTORC1 mediates the ability of Bmal1 to induce autophagy. First, high glucose activates mTORC1, as indicated by the increased phosphorylation of the mTORC1 substrates p70S6K, S6, and 4EBP1 (Figure 5). In addition, the mTORC1 pathway was severely attenuated by Bmal1 overexpression and induced by Bmal1 KD, as shown in Figure 4. Finally, the mTORC1 inhibitor Rap antagonized Bmal1 silencing-induced autophagic activity, as indicated by ΔLC3-II levels (Figure 5C), and overexpression of mTOR dramatically decreased autophagic flux. Together, these results confirmed that the mTORC1 pathway is responsible for regulating Bmal1-induced autophagy in cardiomyocytes under hyperglycemic conditions.
In conclusion, our study demonstrates that the clock gene Bmal1 protects cardiomyocytes under hyperglycemic conditions by inducing autophagy through mTORC1 signaling downregulation, suggesting a potential role for the Bmal1 gene in autophagic activity regulation and cardiomyocyte viability. Furthermore, it is conceivable that altered Bmal1 function resulting from disrupted circadian physiology may be a new mechanism that contributes to the prevalence of diabetic cardiomyopathy and other metabolic disorders. One limitation of this study is that autophagic flux and other parameters were determined in cultured cells. Whether our conclusions hold true in living animals requires further investigation using diabetic animal models with both gain and loss of Bmal1 function in the heart.
MATERIALS AND METHODS
Neonatal rat cardiomyocyte culture under normal- or high-glucose treatment
All animal work was performed in accordance with the Institutional Animal Care and Use Committee of Hebei Medical University (Shijiazhuang, China). Neonatal rat cardiomyocytes were derived from 1- to 3-day-old Sprague-Dawley rat neonates obtained from the Laboratory Animal Center of Hebei Medical University, as described previously [48]. BrdU (5’-bromo 2’-deoxyuridine; B5002; Sigma-Aldrich, Louis, MO, USA) was applied to cardiomyocytes to inhibit cardiac fibroblast and other non-myocyte growth for 48 h, and cells were then cardiomyocytes were cultured in a glucose-free Dulbecco’s modified essential medium (DMEM; 11966; GIBCO, Carlsbad, CA, USA) containing 5% fetal calf serum supplemented with 5.5 or 25 mM of glucose (G7021; Sigma-Aldrich) for 48 h, then cells were synchronized with 50% v/v adult horse serum (16050-122; GIBCO) shock treatment for 2 hours to get a cyclic expression of clock genes, after which the serum-rich medium was replaced with serum-free medium [49]. The osmolarities of all media were normalized to 25 mM with mannitol (M9647; Sigma-Aldrich). Rapamycin (BML-A275; Enzo Life Sciences, Farmingdale, NY, USA) and Bafilomycin A1 (11038; Cayman Chemical, Ann Arbor, MI, USA) were dissolved in DMSO (D2650; Sigma-Aldrich), and 3-methyladenine (M9281; Sigma-Aldrich) was dissolved in DMEM. Each drug was added to the medium to the final concentration described for each experiment.
Transmission electron microscopy (TEM) analysis
To detect the formation of autophagosomes, cardiomyocytes were fixed with 2.5% glutaraldehyde and then in osmium tetroxide. After dehydration in an ethanol gradient, samples were incubated with propylenoid, impregnated with a mixture of propylenoid/LX-112 (1:1, 21210; Ladd Research Industries, Williston, ND, USA), and embedded in LX-112. Ultrathin sections were stained with uranyl acetate and lead citrate. Sections were examined under a Hitachi H-7500 electron microscope.
Western blot analysis
Protein extracts from cardiomyocytes were prepared as described previously [48]. Protein samples were separated on 12% Precise Protein Gels (4561041; Bio-Rad, Hercules, CA, USA) before being transferred to polyvinylidene fluoride (PVDF) membranes (S80306, EMD Millipore, Darmstadt, Germany), blocked with 5% nonfat milk, and incubated overnight at 4°C with primary antibodies. Subsequently, the membrane was incubated with an appropriate horseradish peroxidase-conjugated secondary antibody for 1 h at room temperature in 5% nonfat milk. Blots were detected with SuperSignal West Femto substrate and exposed with the Gel Doc XR System (Bio-Rad). Bands of interest were first normalized to GAPDH and then to the control group. Data are presented as relative density ratios. Antibodies were purchased from Cell Signaling Technology (Danvers, MA, USA) as follows: LC3 (2775), ATG12 (2010), Beclin1 (3738), SQSTM1/p62 (5114), cleaved caspase 3 (9661), PARP (9542), mTOR (2972), phospho-mTOR (Ser2448, 2971), ULK1 (R600, 4773), phospho-ULK1 (Ser467, 4634), 4EBP (9644), phospho-4EBP (Ser65, 9451), p70 S6 Kinase (S6K, 9202), phospho-p70 S6K (Thr389, 9205), S6 ribosomal protein (S6, 2217), phospho-S6 (Ser240/244, 2215), and glyceraldehyde-3-phosphate dehydrogenase (GAPDH; 5174).
Construction and utilization of replication-deficient lentivirus
Bmal1 shRNA and cDNA constructs were generated as described previously [50]. Bmal1 shRNA constructs in the pGIPZ vector (VGM5520-99941526, VGM5520-99342254, VGM5520-99211363) and a scrambled control (SC) vector (RHS4346) were purchased from Open Biosystems (Lafayette, CO, USA) and were constructed according to the manufacturer’s instructions. cDNAs (in the pcDNA vector) were kindly provided by Dr. Ke Ma [51].
Analysis of cardiomyocyte viability
Cardiomyocyte viability was calculated with the Live/Dead Viability/Cytotoxicity Assay Kit (R37601; Thermo Fisher Scientific, Waltham, MA USA), which estimates the number of dead cells regardless of the cause of death. The numbers of live and dead cells in 4 random microscopic fields were counted based on green fluorescent calcein-AM (live) and red fluorescent ethidium homodimer-1 (dead) staining.
Analysis of cardiomyocyte apoptosis
To detect cardiomyocyte apoptosis, a terminal deoxynucleotidyl transferase dUTP nick-end labeling (TUNEL) assay was performed, along with an analysis of caspase 3 and PARP cleavage. TUNEL assays were performed according to the manufacturer’s instructions (Roche, Basel, Switzerland, USA), and cells were then treated with DAPI (LifeTech, Carlsbad, CA, USA) to stain nuclei. Caspase 3 and PARP cleavage were detected by western blotting.
Statistical analysis
All statistical analyses were performed with GraphPad Prism (GraphPad Software, La Jolla, CA, USA). All results are presented as the means ± SEM. Comparisons between 2 groups were performed with 2-way analysis of variance (ANOVA) followed by a Bonferroni post-test, with the exception of the comparison between 5.5 mM and 25 mM glucose, where autophagic flux was examined with a 2-tailed unpaired Student’s t-test. Differences were considered statistically significant at p < 0.05.
Abbreviations
3-MA, 3-methyladenine; 4EBP, elongation factor 4E binding protein; BrdU, 5’-bromo 2’-deoxyuridine; BAF, bafilomycin A1; BECN1, Beclin 1; bmal1, brain and muscle Arnt-like 1; DMEM, Dulbecco’s modified essential medium; LC3, microtubule-associated protein 1 light chain 3; mTOR, mammalian target of rapamycin; mTORC1, mTOR complex 1; NRCMs, Neonatal rat cardiomyocytes; PARP, Poly (ADP-ribose) polymerase; Rap, rapamycin; S6K, p70 ribosomal protein S6 kinase; SC, scrambled control; shRNA, short hairpin RNA; ULK1, unc-51-like kinase 1.
Author contributions
BG and YL conception and design, financial support, data analysis and interpretation, final approval of the manuscript. LQ collection and/or assembly of data, data analysis and interpretation, manuscript writing. HZ, RY, LC, YW, XJ, and SL collection and/or assembly of data.
ACKNOWLEDGMENTS
The authors thank Dr. Ke Ma (Center for Diabetes Research, The Methodist Hospital Research Institute, Houston, USA) for providing cDNA (in pcDNA vector).
CONFLICTS OF INTEREST
The authors declare no conflicts of interest.
FUNDING
This study was supported by funding from National Natural Science Foundation of China (81400217 and 81570345).
REFERENCES
1. Bugger H, Abel ED. Molecular mechanisms of diabetic cardiomyopathy. Diabetologia. 2014; 57:660–671.
2. Huynh K, Bernardo BC, McMullen JR, Ritchie RH. Diabetic cardiomyopathy: mechanisms and new treatment strategies targeting antioxidant signaling pathways. Pharmacol Ther. 2014; 142:375–415.
3. Boudina S, Abel ED. Diabetic Cardiomyopathy Revisited. Circulation. 2007; 115:3213–3223.
4. Poornima IG, Parikh P, Shannon RP. Diabetic Cardiomyopathy. The Search for a Unifying Hypothesis. 2006; 98:596–605.
5. Stratton IM, Adler AI, Neil HAW, Matthews DR, Manley SE, Cull CA, Hadden D, Turner RC, Holman RR. Association of glycaemia with macrovascular and microvascular complications of type 2 diabetes (UKPDS 35): prospective observational study. BMJ: British Medical Journal. 2000; 321:405–412.
6. van Melle JP, Bot M, de Jonge P, de Boer RA, van Veldhuisen DJ, Whooley MA. Diabetes, Glycemic Control, and New-Onset Heart Failure in Patients With Stable Coronary Artery Disease: Data from the Heart and Soul Study. Diabetes Care. 2010; 33:2084–2089.
7. Kawakami N, Takatsuka N, Shimizu H. Sleep Disturbance and Onset of Type 2 Diabetes. Diabetes Care. 2004; 27:282–283.
8. Leibetseder V, Humpeler S, Svoboda M, Schmid D, Thalhammer T, Zuckermann A, Marktl W, Ekmekcioglu C. Clock Genes Display Rhythmic Expression in Human Hearts. Chronobiology International. 2009; 26:621–636.
9. Spiegel K, Tasali E, Leproult R, Van Cauter E. Effects of poor and short sleep on glucose metabolism and obesity risk. Nature reviews Endocrinology. 2009; 5:253–261.
10. Suwazono Y, Dochi M, Sakata K, Okubo Y, Oishi M, Tanaka K, Kobayashi E, Kido T, Nogawa K. A longitudinal study on the effect of shift work on weight gain in male Japanese workers. Obesity (Silver Spring, Md). 2008; 16:1887–1893.
11. Yaggi HK, Araujo AB, McKinlay JB. Sleep Duration as a Risk Factor for the Development of Type 2 Diabetes. Diabetes Care. 2006; 29:657–661.
12. Dibner C, Schibler U, Albrecht U. The mammalian circadian timing system: organization and coordination of central and peripheral clocks. Annual review of physiology. 2010; 72:517–549.
13. Gustafson CL, Partch CL. Emerging Models for the Molecular Basis of Mammalian Circadian Timing. Biochemistry. 2015; 54:134–149.
14. Yamazaki S, Numano R, Abe M, Hida A, Takahashi RI, Ueda M, Block GD, Sakaki Y, Menaker M, Tei H. Resetting Central and Peripheral Circadian Oscillators in Transgenic Rats. Science. 2000; 288:682–685.
15. Whitmore D, Foulkes NS, Sassone-Corsi P. Light acts directly on organs and cells in culture to set the vertebrate circadian clock. Nature. 2000; 404:87–91.
16. Bunger MK, Wilsbacher LD, Moran SM, Clendenin C, Radcliffe LA, Hogenesch JB, Simon MC, Takahashi JS, Bradfield CA. Mop3 Is an Essential Component of the Master Circadian Pacemaker in Mammals. Cell. 2000; 103:1009–1017.
17. Young ME, Wilson CR, Razeghi P, Guthrie PH, Taegtmeyer H. Alterations of the Circadian Clock in the Heart by Streptozotocin-induced Diabetes. Journal of Molecular and Cellular Cardiology. 2002; 34:223–231.
18. Lamia KA, Storch KF, Weitz CJ. The physiological significance of a peripheral tissue circadian clock. Proceedings of the National Academy of Sciences of the United States of America. 2008; 105:15172–15177.
19. Rudic RD, McNamara P, Curtis AM, Boston RC, Panda S, Hogenesch JB, Fitzgerald GA. BMAL1 and CLOCK, Two Essential Components of the Circadian Clock, Are Involved in Glucose Homeostasis. PLoS Biology. 2004; 2:e377.
20. Shimba S, Ishii N, Ohta Y, Ohno T, Watabe Y, Hayashi M, Wada T, Aoyagi T, Tezuka M. Brain and muscle Arnt-like protein-1 (BMAL1), a component of the molecular clock, regulates adipogenesis. Proceedings of the National Academy of Sciences of the United States of America. 2005; 102:12071–12076.
21. Hamacher-Brady A, Brady NR, Gottlieb RA. The Interplay between Pro-Death and Pro-Survival Signaling Pathways in Myocardial Ischemia/Reperfusion Injury: Apoptosis Meets Autophagy. Cardiovascular Drugs and Therapy. 2006; 20:445.
22. Li Z, Wang J, Yang X. Functions of Autophagy in Pathological Cardiac Hypertrophy. International Journal of Biological Sciences. 2015; 11:672–678.
23. Nemchenko A, Chiong M, Turer A, Lavandero S, Hill JA. Autophagy as a Therapeutic Target in Cardiovascular Disease. Journal of molecular and cellular cardiology. 2011; 51:584–593.
24. Orogo AM, Gustafsson ÅB. Therapeutic Targeting of Autophagy: Potential and Concerns in Treating Cardiovascular Disease. Circulation research. 2015; 116:489–503.
25. Takagi H, Matsui Y, Sadoshima J. The role of autophagy in mediating cell survival and death during ischemia and reperfusion in the heart. Antioxidants & redox signaling. 2007; 9:1373–1381.
26. Kobayashi S, Xu X, Chen K, Liang Q. Suppression of autophagy is protective in high glucose-induced cardiomyocyte injury. Autophagy. 2012; 8:577–592.
27. Blasi I, Korostoff J, Dhingra A, Reyes-Reveles J, Shenker BJ, Shahabuddin N, Alexander D, Lally ET, Bragin A, Boesze-Battaglia K. Variants of Porphyromonas gingivalis lipopolysaccharide alter lipidation of autophagic protein, microtubule-associated protein 1 light chain 3, LC3. Molecular oral microbiology. 2016; 31:486–500.
28. Ichimura Y, Komatsu M. Selective degradation of p62 by autophagy. Seminars in Immunopathology. 2010; 32:431–436.
29. Mei Y, Glover K, Su M, Sinha SC. Conformational flexibility of BECN1: Essential to its key role in autophagy and beyond. Protein science: a publication of the Protein Society. 2016; 25:1767–1785.
30. Otomo C, Metlagel Z, Takaesu G, Otomo T. Structure of the human ATG12~ATG5 conjugate required for LC3 lipidation in autophagy. Nature structural & molecular biology. 2013; 20:59–66.
31. Oyabu J, Yamaguchi O, Hikoso S, Takeda T, Oka T, Murakawa T, Yasui H, Ueda H, Nakayama H, Taneike M, Omiya S, Shah AM, Nishida K, et al. Autophagy-mediated degradation is necessary for regression of cardiac hypertrophy during ventricular unloading. Biochemical and Biophysical Research Communications. 2013; 441:787–792.
32. Klionsky DJ, Abdelmohsen K, Abe A, Abedin MJ, Abeliovich H, Acevedo Arozena A, Adachi H, Adams CM, Adams PD, Adeli K, Adhihetty PJ, Adler SG, Agam G, et al. Guidelines for the use and interpretation of assays for monitoring autophagy (3rd edition). Autophagy. 2016; 12:1–222.
33. Dunlop EA, Tee AR. mTOR and autophagy: A dynamic relationship governed by nutrients and energy. Seminars in Cell & Developmental Biology. 2014; 36:121–129.
34. Russell RC, Yuan HX, Guan KL. Autophagy regulation by nutrient signaling. Cell Research. 2014; 24:42–57.
35. Szymańska P, Martin KR, MacKeigan JP, Hlavacek WS, Lipniacki T. Computational Analysis of an Autophagy/Translation Switch Based on Mutual Inhibition of MTORC1 and ULK1. PLoS ONE. 2015; 10:e0116550.
36. Jia G, DeMarco VG, Sowers JR. Insulin resistance and hyperinsulinaemia in diabetic cardiomyopathy. Nature reviews Endocrinology. 2016; 12:144–153.
37. Kanamori H, Takemura G, Goto K, Tsujimoto A, Mikami A, Ogino A, Watanabe T, Morishita K, Okada H, Kawasaki M, Seishima M, Minatoguchi S. Autophagic adaptations in diabetic cardiomyopathy differ between type 1 and type 2 diabetes. Autophagy. 2015; 11:1146–1160.
38. Miki T, Yuda S, Kouzu H, Miura T. Diabetic cardiomyopathy: pathophysiology and clinical features. Heart Failure Reviews. 2013; 18:149–166.
39. Xie Z, Lau K, Eby B, Lozano P, He C, Pennington B, Li H, Rathi S, Dong Y, Tian R, David K, Minghui Z. Improvement of cardiac functions by chronic metformin treatment is associated with enhanced cardiac autophagy in diabetic OVE26 mice. Diabetes. 2011; 60:1770–1778.
40. Xu X, Hua Y, Nair S, Zhang Y, Ren J. Akt2 knockout preserves cardiac function in high-fat diet-induced obesity by rescuing cardiac autophagosome maturation. J Mol Cell Biol. 2013; 5:61–3.
41. Xu X, Kobayashi S, Chen K, Timm D, Volden P, Huang Y, Gulick J, Yue Z, Robbin J, Epstein PN, Liang Q. Diminished autophagy limits cardiac injury in mice models of type 1 diabetes. J Biol Chem. 2013; 288:18077–18092.
42. Mellor KM, Bell JR, Young MJ, Ritchie RH, Delbridge LMD. Myocardial autophagy activation and suppressed survival signaling is associated with insulin resistance in fructose-fed mice. Journal of Molecular and Cellular Cardiology. 2011; 50:1035–1043.
43. Nakai A, Yamaguchi O, Takeda T, Higuchi Y, Hikoso S, Taniike M, Omiya S, Mizote I, Matsumura Y, Asahi M, Nishida K, Hori M, Mizushima N, et al. The role of autophagy in cardiomyocytes in the basal state and in response to hemodynamic stress. Nat Med. 2007; 13:619–624.
44. Shinmura K, Tamaki K, Sano M, Murata M, Yamakawa H, Ishida H, Fukuda K. Impact of long-term caloric restriction on cardiac senescence: Caloric restriction ameliorates cardiac diastolic dysfunction associated with aging. J Mol Cell Cardiol. 2011; 50:117–127.
45. Kanamori H, Takemura G, Goto K, Maruyama R, Tsujimoto A, Ogino A, Takeyama T, Kawaguchi T, Watanabe T, Fujiwara T, Seishima M, Minatoguchi S. The role of autophagy emerging in post infarction cardiac remodeling. Cardiovasc Res. 2011; 91:330–339.
46. Kanamori H, Takemura G, Goto K, Tsujimoto A, Ogino A, Takeyama T, Kawaguchi T, Watanabe T, Morishita K, Kawasaki M, Mikami A, Fujiwara T, Fujiwara H, et al. Resveratrol reverses remodeling in hearts with large, old myocardial infarctions through enhanced autophagy-activating AMP Kinase pathway. Am J Pathol. 2013; 182:701–713.
47. Montaigne D, Marechal X, Coisne A, Debry N, Modine T, Fayad G, Potelle C, El Arid JM, Mouton S, Sebti Y, Duez H, Preau S, Remy-Jouet I, et al. Myocardial contractile dysfunction is associated with impaired mitochondrial function and dynamics in type 2 diabetic but not in obese patients. Circulation. 2014; 130:554–564.
48. Jin X, Guo B, Yan J, Yang R, Chang L, Wang Y, Miao C, Liu S, Zhang H, Li Y. Angiotensin II increases secreted frizzled-related protein 5 (sFRP5) expression through AT1 receptor/Rho/ROCK1/JNK signaling in cardiomyocytes. Mol Cell Biochem. 2015; 408:215–222.
49. Balsalobre A, Damiola F, Schibler U. A serum shock induces circadian gene expression in mammalian tissue culture cells. Cell. 1998; 93:929–937.
50. Guo B, Chatterjee S, Li L, Kim JM, Lee J, Yechoor VK, Minze LJ, Hsueh W, Ma K. The clock gene, brain and muscle Arnt-like 1, regulates adipogenesis via Wnt signaling pathway. FASEB journal: official publication of the Federation of American Societies for Experimental Biology. 2012; 26:3453–3463.
51. Chatterjee S, Nam D, Guo B, Kim JM, Winnier GE, Lee J, Berdeaux R, Yechoor VK, Ma K. Brain and muscle Arnt-like 1 is a key regulator of myogenesis. Journal of Cell Science. 2013; 126:2213–2224.