
INTRODUCTION
Osteoarthritis (OA) is a common late-onset degenerative joint disease affecting millions of people worldwide. The prominent features of OA include progressive degradation of articular cartilage, accompanied by joint space narrowing, subchondral bone sclerosis, and osteophyte formation at the joint margin; these symptoms result in chronic joint pain and restricted motion [1]. Little is known about the etiology of OA or the relative importance of bone remodeling compared with that of cartilage degradation. In addition to age, sex, body weight, hormonal status, ethnicity, and trauma, numerous genetic factors have recently been identified as causes of OA [2, 3]. To date, several genome-wide association studies based on large sample populations have demonstrated that single nucleotide polymorphisms in various genes, such as protein kinase, cAMP-dependent regulatory type-II β (PRKAR2B), HMG-box transcription factor 1 (HPB1), component of oligomeric Golgi complex 5 (COG5), G protein-coupled receptor 22 (GPR22), growth differentiation factor 5 (GDF5), and a disintegrin and metalloprotease 12 (ADAM12) [4, 5], are associated with susceptibility to knee OA (KOA).
ADAM proteins, members of the Zn-dependent metzincin superfamily, have been shown to be associated with several complex diseases, such as rheumatoid arthritis, heart disease, Alzheimer’s disease, and cancer [6, 7]. Among the 23 identified human ADAM genes, ADAM12 is a candidate gene in the etiology of OA. The cellular roles of ADAM12 appear to be critical in both normal physiology and pathology. Several studies have suggested regulatory roles of human ADAM12 in bone formation, chondrocyte proliferation and maturation, and osteoclast differentiation [8-11]. Moreover, ADAM12 is upregulated in OA cartilage and multinucleated giant cells surrounding loose hip implants [12, 13]. A previous study demonstrated that expression of the ADAM12-S protein is elevated in the serum of some patients with OA and that the expression level is correlated with the grade of the disease [14]. Importantly, the expression of ADAM12 and variations of the ADAM12 gene have previously been shown to be associated with KOA [15-20].
Considering the critical role of ADAM12 in KOA, we performed a meta-analysis of all eligible case-control studies to obtain a more accurate picture of the association of four ADAM12 gene polymorphisms (rs3740199, rs1278279, rs1871054, and rs1044122) with KOA susceptibility.
RESULTS
Eligible studies
Overall, we identified five articles (11 case-control studies, four polymorphism sites) that evaluated the association of the rs3740199, rs1278279, rs1871054, and rs1044122 polymorphisms in ADAM12 with the risk of KOA (Figure 1) [16-20]. Of these, five case-control studies, totaling 1,405 cases and 2,531 controls, were used for assessment of the rs3740199 polymorphism and KOA risk. The remaining three polymorphisms were included in two case-control studies with 316 cases and 379 controls. The diagnosis of patients with KOA was based on criteria of the American College of Rheumatology, which included primary OA with any symptoms and radiographic signs of OA according to the Kellgren-Lawrence grading system. The controls were unrelated, healthy, age-matched, ethnicity-matched individuals. The characteristics of the studies on ADAM12 gene polymorphisms are summarized in Tables 1 and 2. Genotype distributions in the control group were consistent with Hardy-Weinberg equilibrium (HWE).
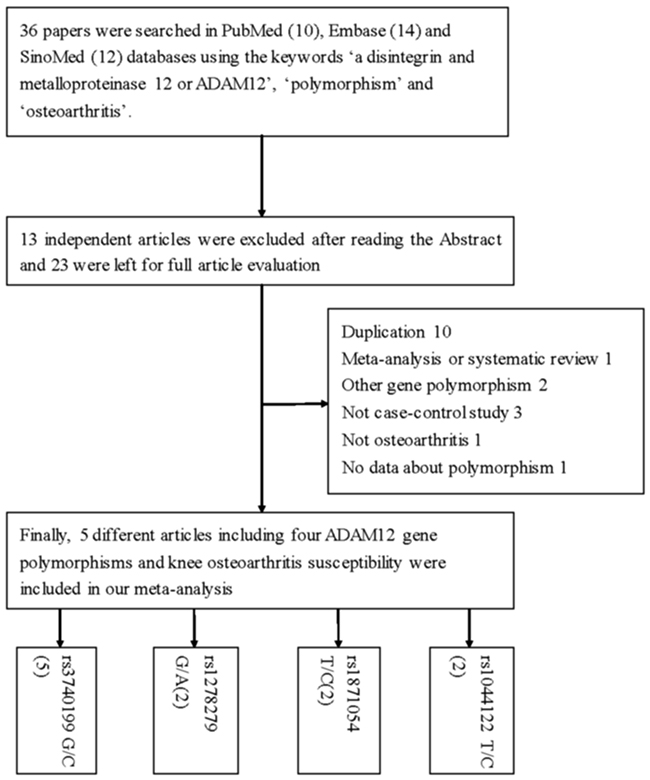
Figure 1: Flowchart illustrating the search strategy used to identify association studies for ADAM12 gene polymorphisms and KOA risk.
Table 1: Basic information for included studies of the association between ADAM12 gene polymorphism sites and knee osteoarthritis susceptibility
Author |
Year |
Origin |
Ethnicity |
Design |
Case |
Control |
Case |
Control |
Method |
NOS |
|||||
|---|---|---|---|---|---|---|---|---|---|---|---|---|---|---|---|
MM |
MW |
WW |
MM |
MW |
WW |
HWE |
|||||||||
rs3740199 |
|
|
|
|
|
|
|
|
|
|
|
|
|
|
|
Shin |
2012 |
Korea |
Asian |
PB |
725 |
1737 |
147 |
364 |
214 |
350 |
863 |
524 |
0.876 |
TaqMan |
8 |
Poonpet |
2016 |
Thailand |
Asian |
HB |
200 |
200 |
56 |
102 |
42 |
46 |
100 |
54 |
0.982 |
PCR–HRM |
7 |
Kerna |
2009 |
Estonia |
Caucasian |
PB |
163 |
215 |
81 |
66 |
16 |
106 |
89 |
20 |
0.823 |
PCR-RFLP |
9 |
Wang |
2015 |
China |
Asian |
HB |
164 |
200 |
36 |
84 |
44 |
47 |
102 |
51 |
0.773 |
iMLDR |
7 |
Lou |
2014 |
China |
Asian |
HB |
153 |
179 |
32 |
78 |
43 |
42 |
93 |
44 |
0.599 |
real-time PCR |
7 |
rs1278279 |
|
|
|
|
|
|
|
|
|
|
|
|
|
|
|
Wang |
2015 |
China |
Asian |
HB |
164 |
200 |
10 |
62 |
92 |
15 |
64 |
121 |
0.119 |
iMLDR |
7 |
Lou |
2014 |
China |
Asian |
HB |
152 |
179 |
9 |
59 |
84 |
13 |
60 |
106 |
0.274 |
real-time PCR |
7 |
rs1871054 |
|
|
|
|
|
|
|
|
|
|
|
|
|
|
|
Wang |
2015 |
China |
Asian |
HB |
164 |
200 |
76 |
59 |
29 |
49 |
99 |
52 |
0.890 |
iMLDR |
7 |
Lou |
2014 |
China |
Asian |
HB |
152 |
179 |
69 |
57 |
26 |
44 |
88 |
47 |
0.825 |
real-time PCR |
7 |
rs1044122 |
|
|
|
|
|
|
|
|
|
|
|
|
|
|
|
Wang |
2015 |
China |
Asian |
HB |
164 |
200 |
25 |
88 |
51 |
37 |
101 |
62 |
0.712 |
iMLDR |
7 |
Lou |
2014 |
China |
Asian |
HB |
152 |
179 |
24 |
81 |
47 |
31 |
92 |
56 |
0.517 |
real-time PCR |
7 |
HWE: Hardy–Weinberg equilibrium; HB: hospital-based; PB: population-based; TB: tuberculosis; PCR-FLIP: polymerase chain reaction and restrictive fragment length polymorphism; PCR-HRM: polymerase chain reaction and high resolutionmelting; iMLDR: improved multiplex ligase improved multiplex ligase detection reaction; NOS: Newcastle-Ottawa Scale; W: wild type-allele; M: mutant-allele.
Table 2: The genotyping frequency of published studies on the relationship between ADAM12 rs3740199 polymorphism and knee osteoarthritis susceptibility by sex subgroup
Author |
Year |
Origin |
Ethnicity |
Sex |
Case |
Control |
Case |
Control |
||||
|---|---|---|---|---|---|---|---|---|---|---|---|---|
CC |
CG |
GG |
CC |
CG |
GG |
|||||||
Shin |
2012 |
Korea |
Asian |
Male |
171 |
882 |
32 |
94 |
45 |
178 |
423 |
281 |
Shin |
2012 |
Korea |
Asian |
Female |
554 |
855 |
115 |
270 |
169 |
172 |
440 |
243 |
Poonpet |
2016 |
Thailand |
Asian |
Male |
53 |
51 |
19 |
24 |
10 |
8 |
25 |
18 |
Poonpet |
2016 |
Thailand |
Asian |
Female |
147 |
149 |
37 |
78 |
32 |
38 |
75 |
36 |
Kerna |
2009 |
Estonia |
Caucasian |
Male |
40 |
60 |
22 |
15 |
3 |
23 |
28 |
9 |
Kerna |
2009 |
Estonia |
Caucasian |
Female |
123 |
155 |
59 |
51 |
13 |
83 |
61 |
11 |
Meta-analysis
For the rs3740199 polymorphism, no significant positive association was observed between KOA risk and the variant genotypes in all different genetic models in whole populations, including allelic contrast (odds ratio [OR] = 1.02, 95% confidence interval [CI] = 0.93–1.12, Pheterogeneity = 0.538, P = 0.726, fixed model, Figure 2), homozygote comparison (OR = 1.03, 95% CI = 0.85–1.25, Pheterogeneity = 0.527, P = 0.758, fixed model), and the dominant model (OR = 1.03, 95% CI = 0.88–1.20, Pheterogeneity = 0.631, P = 0.714, fixed model, Table 3A). Similarly, no associations were detected in the subgroups of ethnicity and source of control. However, despite the small number of samples included, a significant association was found for this polymorphism in men (heterozygote comparison: OR = 1.44, 95% CI = 1.02–2.04, Pheterogeneity = 0.906, P = 0.040, fixed model, Figure 3; dominant model: OR = 1.46, 95% CI = 1.05–2.03, Pheterogeneity = 0.420, P = 0.025, fixed model, Table 3A). In addition, to avoid false-positive results, we calculated the null distribution of the test statistic that adjusts for the inheritance multiple testing [21]. Results showed that the analytical P values were of the order of magnitude of 5.3 × 10⁻⁶.
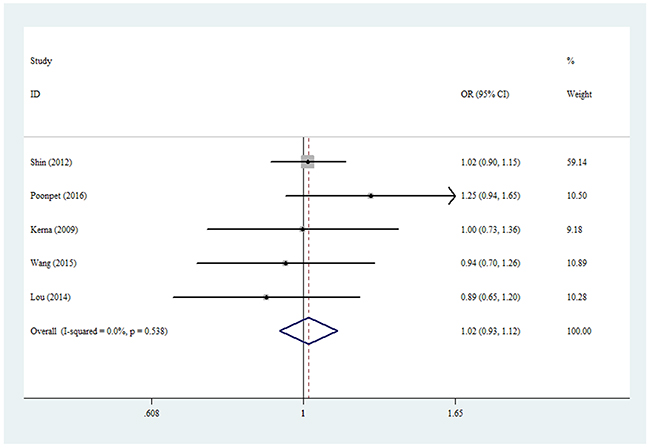
Figure 2: Forest plot of KOA risk associated with rs3740199 polymorphism (C-allele vs. G-allele) in the whole. The squares and horizontal lines correspond to the study-specific OR and 95% CI. The area of the squares reflects the weight (inverse of the variance). The diamond represents the summary OR and 95% CI.
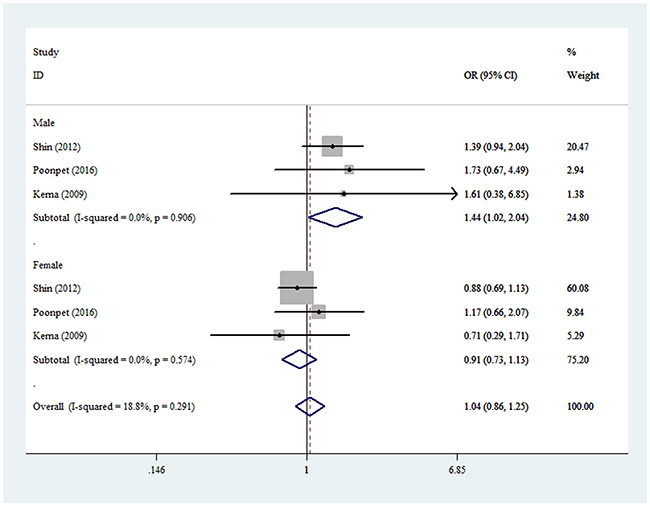
Figure 3: Forest plot of KOA risk associated with rs3740199 polymorphism (CG vs. GG) by sex. The squares and horizontal lines correspond to the study-specific OR and 95% CI. The area of the squares reflects the weight (inverse of the variance). The diamond represents the summary OR and 95% CI.
Table 3A: Total and stratified subgroup analysis for ADAM12 gene polymorphism sites and knee osteoarthritis susceptibility (fixed-model)
Variables |
N |
Case/Control |
OR(95%CI) Ph P |
OR(95%CI) Ph P |
OR(95%CI) Ph P |
OR(95%CI) Ph P |
OR(95%CI) Ph P |
|---|---|---|---|---|---|---|---|
|
|
|
M-allele vs. W-allele |
MW vs. WW |
MM vs. WW |
MM+MW vs. WW |
MM vs. MW+WW |
rs3740199 |
|
|
|
|
|
|
|
Total |
5 |
1405/2531 |
1.02(0.93-1.12)0.538 0.726 |
1.03(0.87-1.21)0.811 0.743 |
1.03(0.85-1.25)0.527 0.758 |
1.03(0.88-1.20)0.631 0.714 |
1.00(0.86-1.17)0.630 0.967 |
Ethnicity |
|
|
|
|
|
|
|
Asian |
4 |
1242/2316 |
1.02(0.92-1.13)0.379 0.709 |
1.03(0.88-1.22)0.680 0.703 |
1.04(0.85-1.27)0.370 0.722 |
1.03(0.88-1.21)0.473 0.679 |
1.00(0.84-1.19)0.461 0.989 |
Caucasian |
1 |
163/215 |
- |
- |
- |
- |
- |
Source of control |
|
|
|
|
|
|
|
HB |
3 |
517/579 |
1.03(0.87-1.21)0.213 0.771 |
1.03(0.77-1.38)0.470 0.829 |
1.05(0.75-1.48)0.209 0.764 |
1.04(0.79-1.36)0.285 0.792 |
0.99(0.75-1.31)0.277 0.944 |
PB |
2 |
888/1952 |
1.01(0.90-1.14)0.914 0.822 |
1.03(0.84-1.24)0.780 0.802 |
1.02(0.81-1.29)0.849 0.868 |
1.03(0.85-1.23)0.805 0.791 |
1.01(0.83-1.22)0.973 0.922 |
Sex |
|
|
|
|
|
|
|
Male |
3 |
264/993 |
1.49(0.95-2.34)0.053 0.086 |
1.44(1.02-2.04)0.906 0.040 |
2.09(0.82-5.33)0.066 0.122 |
1.46(1.05-2.03)0.420 0.025 |
1.60(0.76-3.39)0.034 0.220 |
Female |
3 |
824/1159 |
0.96(0.84-1.09)0.554 0.531 |
0.91(0.73-1.13)0.574 0.389 |
0.94(0.72-1.23)0.537 0.648 |
0.92(0.75-1.13)0.516 0.417 |
0.98(0.79-1.21)0.637 0.836 |
rs1278279 |
2 |
316/379 |
1.08(0.84-1.38)0.964 0.543 |
1.26(0.91-1.73)0.935 0.158 |
0.88(0.47-1.62)0.995 0.671 |
1.19(0.88-1.61)0.950 0.265 |
0.80(0.44-1.47)0.995 0.474 |
rs1871054 |
2 |
316/379 |
1.85(1.49-2.30)0.984 <0.001 |
1.12(0.75-1.67)0.824 0.592 |
2.81(1.84-4.27)0.964 <0.001 |
1.68(1.16-2.43)0.887 0.006 |
2.61(1.89-3.60)0.897 <0.001 |
rs1044122 |
2 |
316/379 |
0.95(0.77-1.18)0.838 0.665 |
1.05(0.75-1.48)0.978 0.759 |
0.87(0.55-1.37)0.803 0.543 |
1.01(0.73-1.39)0.948 0.972 |
0.84(0.56-1.26)0.767 0.394 |
Ph: value of Q-test for heterogeneity test; P: Z-test for the statistical significance of the OR; the red mark: statistical differences by Stata software.
For the rs1871054 polymorphism, a positive correlation was found between KOA risk in the whole analysis, including allelic contrast (OR = 1.85, 95% CI = 1.49–2.30, Pheterogeneity = 0.984, P < 0.001, fixed model), homozygote comparison (OR = 2.81, 95% CI = 1.84–4.27, Pheterogeneity = 0.964, P < 0.001, Figure 4), and the dominant model (OR = 1.68, 95% CI = 1.16–2.43, Pheterogeneity = 0.887, P = 0.006, fixed model, Table 3A).
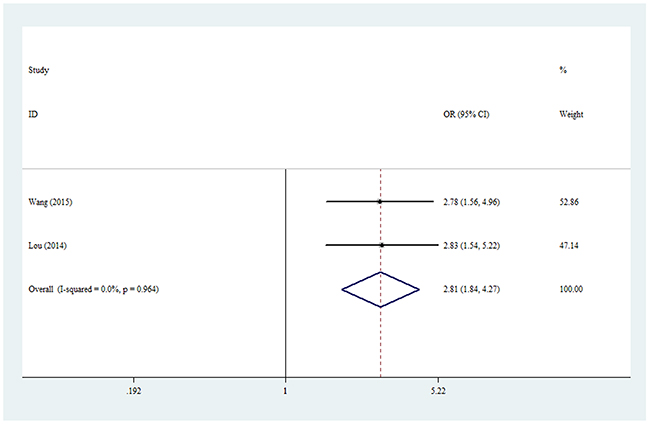
Figure 4: Forest plot of KOA risk associated with rs1871054 polymorphism (CC vs. TT) in the whole. The squares and horizontal lines correspond to the study-specific OR and 95% CI. The area of the squares reflects the weight (inverse of the variance). The diamond represents the summary OR and 95% CI.
For the rs1278279 and rs1044122 polymorphisms, no pooled associations with KOA were found for the whole analysis (Table 3A).
Our analysis used Chi-squared and I2 to test the heterogeneity, which decides the analysis model (fixed effects model or random effects model) and is applied only one model at a time. However, the bias of this method has been pointed out by a previous study [22]. Therefore, we analyzed the opposite effects model at the same time (Table 3B), where similar results were detected in both models, which did not influence the final conclusion.
Table 3B: Total and stratified subgroup analysis for ADAM12 gene polymorphism sites and knee osteoarthritis susceptibility (random-model)
Variables |
N |
Case/Control |
OR(95%CI) Ph P |
OR(95%CI) Ph P |
OR(95%CI) Ph P |
OR(95%CI) Ph P |
OR(95%CI) Ph P |
|---|---|---|---|---|---|---|---|
M-allele vs. W-allele |
MW vs. WW |
MM vs. WW |
MM+MW vs. WW |
MM vs. MW+WW |
|||
rs3740199 |
|
|
|
|
|
|
|
Total |
5 |
1405/2531 |
1.02(0.93-1.12)0.538 0.727 |
1.03(0.87-1.21)0.811 0.745 |
1.03(0.85-1.25)0.527 0.760 |
1.03(0.88-1.20)0.631 0.717 |
1.02(0.87-1.19)0.634 0.841 |
Ethnicity |
|
|
|
|
|
|
|
Asian |
4 |
1242/2316 |
1.02(0.92-1.13)0.376 0.719 |
1.03(0.88-1.22)0.680 0.704 |
1.04(0.84-1.28)0.370 0.736 |
1.03(0.88-1.21)0.473 0.682 |
1.02(0.86-1.21)0.788 0.852 |
Caucasian |
1 |
163/215 |
- |
- |
- |
- |
- |
Source of control |
|
|
|
|
|
|
|
HB |
3 |
517/579 |
1.02(0.83-1.26)0.213 0.845 |
1.03(0.77-1.38)0.470 0.832 |
1.04(0.68-1.60)0.209 0.846 |
1.03(0.76-1.41)0.285 0.828 |
1.03(0.78-1.37)0.428 0.831 |
PB |
2 |
888/1952 |
1.01(0.90-1.14)0.914 0.822 |
1.02(0.84-1.24)0.780 0.803 |
1.02(0.81-1.29)0.849 0.868 |
1.03(0.85-1.23)0.805 0.791 |
1.01(0.83-1.22)0.973 0.922 |
Sex |
|
|
|
|
|
|
|
Male |
3 |
264/993 |
1.25(1.02-1.53)0.053 0.030 |
1.44(1.02-2.04)0.906 0.039 |
1.50(0.99-2.28)0.066 0.056 |
1.46(1.05-2.03)0.420 0.025 |
1.24(0.89-1.72)0.034 0.212 |
Female |
3 |
824/1159 |
0.96(0.84-1.09)0.554 0.531 |
0.91(0.73-1.13)0.574 0.388 |
0.94(0.72-1.23)0.537 0.648 |
0.92(0.74-1.13)0.516 0.417 |
0.98(0.79-1.21)0.637 0.837 |
rs1278279 |
2 |
316/379 |
1.08(0.84-1.38)0.964 0.543 |
1.26(0.91-1.73)0.935 0.158 |
0.88(0.47-1.62)0.995 0.671 |
1.19(0.88-1.61)0.950 0.265 |
0.80(0.44-1.47)0.995 0.474 |
rs1871054 |
2 |
316/379 |
1.85(1.49-2.30)0.984 0.000 |
1.12(0.75-1.67)0.824 0.593 |
2.81(1.84-4.27)0.964 0.000 |
1.68(1.16-2.43)0.887 0.006 |
2.61(1.89-3.60)0.897 0.000 |
rs1044122 |
2 |
316/379 |
0.95(0.77-1.18)0.838 0.665 |
1.05(0.75-1.48)0.978 0.759 |
0.87(0.55-1.37)0.803 0.543 |
1.01(0.73-1.39)0.948 0.972 |
0.84(0.56-1.26)0.767 0.395 |
Ph: value of Q-test for heterogeneity test; P: Z-test for the statistical significance of the OR; the red mark: statistical differences by Stata software.
Sensitivity analysis and publication bias
Egger’s and Begg’s tests were performed to assess for publication bias, and funnel plot symmetry was examined for the rs3740199 polymorphism (Because of insufficient degrees of freedom, the other three polymorphisms were not included and analyzed in this section). No proof of publication bias was obtained. For example, in the additive model analysis (CC+CG versus GG), we obtained values of z = 0.73 and P = 0.462 for Begg’s test, and t = -0.08 and P = 0.944 for Egger’s test (Figures 5 and 6, Table 4). Sensitivity analysis was performed to assess the influence of each individual study on the pooled OR by sequential removal of individual studies. The corresponding overall OR was not significantly altered with inclusion or exclusion of each study for the rs3740199 polymorphism (Figure 7).
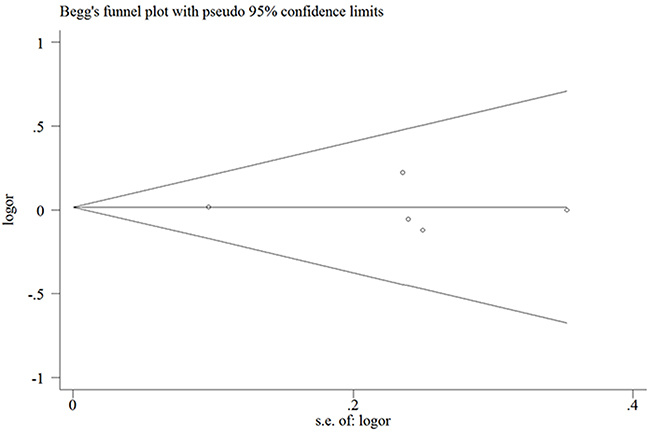
Figure 5: Begg’s funnel plot for publication bias test in the rs3740199 polymorphism (CC+CG vs. GG). Each point represents a separate study for the indicated association. Log [OR], natural logarithm of OR. Horizontal line, mean effect size.
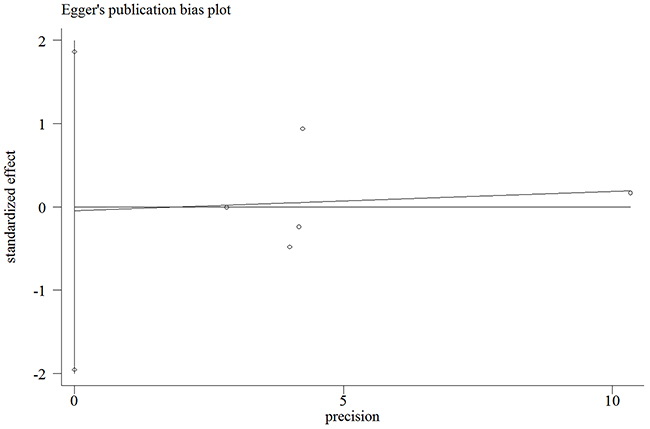
Figure 6: Egger’s publication bias plot for the rs3740199 polymorphism (CC+CG vs. GG).
Table 4: Publication bias tests (Begg’s funnel plot and Egger’s test for publication bias test) for ADAM12 rs3740199 polymorphism
Egger’s test |
|
|
|
|
|
Begg’s test |
|
|---|---|---|---|---|---|---|---|
Genetic type |
Coefficient |
Standard error |
t |
P value |
95%CI of intercept |
z |
P value |
C-allele vs. G-allele |
-0.118 |
1.127 |
-0.1 |
0.923 |
(-3.705, 3.469) |
0.73 |
0.462 |
CG vs. GG |
-0.043 |
0.569 |
-0.08 |
0.944 |
(-1.855, 1.768) |
0.73 |
0.462 |
CC+CG vs. GG |
-0.046 |
0.601 |
-0.08 |
0.944 |
(-1.958, 1.866) |
0.73 |
0.462 |
CC vs. CG+GG |
-0.101 |
0.775 |
-0.13 |
0.905 |
(-2.569, 2.367) |
1.22 |
0.221 |
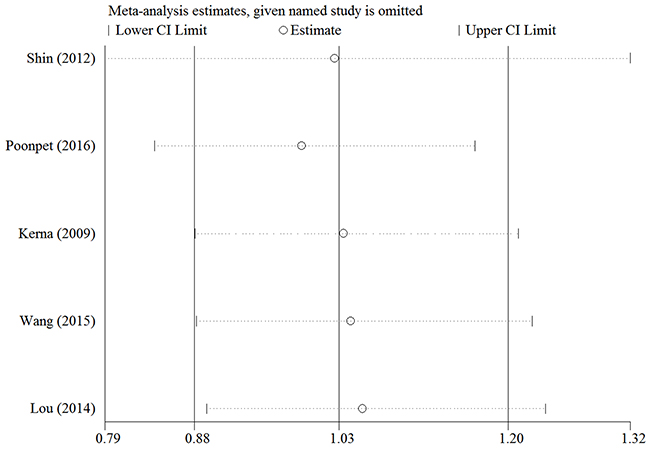
Figure 7: Sensitivity analysis between rs3740199 polymorphism and KOA risk (the dominant genetic model).
DISCUSSION
Identification of gene polymorphisms related to OA susceptibility could not only make it possible to predict the disease phenotypes and construct OA prediction models based on genotype information [23], but also allow us to identify susceptible individuals for administration of preventive therapies (e.g., neuromuscular and proprioceptive training programs) in order to avoid secondary prevention measures for KOA, which typically require 10-20 min to perform and are commonly substituted for regular warm-up sessions prior to sports practice 2-3 times weekly. These programs usually involve education regarding awareness of high-risk positions. This form of prevention seems to be equally effective in all subgroups of individuals analyzed [24].
Polymorphisms in the ADAM12 gene have been reported to be associated with KOA development and progression [11, 15, 18, 25]. Nevertheless, these conclusions are not consistent, as several other studies failed to replicate this association in other ethnicities [17, 26]. Such lack of result replication makes the application of the above-mentioned therapies difficult in the clinical setting. The differences in study results may be due to variations in genotyping and a lack of sufficient markers, differences in case ascertainment and phenotype criteria, differences in ethnicity, and the occurrence of false negatives in the replication study and false positives in the initial studies. Insufficient power related to sample size is a likely source of false positives in initial studies, which consequently tend to overestimate the genetic effects, a phenomenon called the “winner’s curse” [19]. Limited power to detect genetic associations is a substantial problem in the study of the genetics of various complex diseases. Although our study was based on a relatively small population, the results enabled us to perform a meta-analysis to avoid the above-mentioned limitations.
To the best of our knowledge, this is the first meta-analysis to evaluate the association of common polymorphisms in the ADAM12 gene with KOA susceptibility. In the overall analysis of 2,354 KOA cases and 3,668 controls, only the rs1871054 polymorphism was found to be associated with KOA risk, and individuals carrying the C allele may have a high susceptibility for the condition. Furthermore, in the sex-stratified analysis, although there was an increased association between the rs3740199 polymorphism and KOA risk in individuals carrying the CC and CG genotypes, this polymorphism site was not associated with KOA risk in the whole and subgroup analyses after using the genetic model-adjusted P value [22]. It is possible that different polymorphisms in the same gene may exert different effects on gene expression and function, resulting in varying KOA risks. Moreover, a single gene or a single environmental factor may not be likely to have direct effects on KOA susceptibility, and complex interactions between genetic and environmental factors may be involved in the disease development. Finally, if the number of included studies was small, false-negative results may have been found for each polymorphism.
Meta-analysis is a recognized effective method for addressing a variety of clinical questions by summarizing and reviewing published quantitative studies. However, some limitations in our meta-analysis should be mentioned. First, the number of included studies was not large enough for a comprehensive analysis, although we identified all available studies. Second, KOA risk may be modulated by gene-gene and gene-environment interactions, as well as those among different polymorphic loci in the same gene, which should be considered in further research. Third, most of the included studies were hospital-based, which may lead to lack of representation. Moreover, except for one study, all the other included studies were from Asia, which resulted in a limitation of ethnicity representation. Fourth, our meta-analysis was based on unadjusted estimates. A more precise analysis could be conducted if individual data were available, to allow for adjustment by other covariates, including age, family history, environmental factors, ADAM12 gene expression in serum from peripheral blood, disease stage, and lifestyle. Despite the above drawbacks, our meta-analysis had three advantages: a substantial number of cases and controls were pooled from different studies, which increased the statistical power of the analysis significantly; the quality of the case-control studies included was satisfactory based on our selection criteria; and publication bias was not detected in all genetic models, suggesting that the results were relatively stable and powerful.
In summary, our present meta-analysis showed evidence of significant associations between the rs1871054 polymorphism in the ADAM12 gene and increased KOA risk. More well-designed, large-scale studies focusing on gene-gene and gene-environment interactions are warranted to improve our understanding of the correlation between ADAM12 gene polymorphisms and the risk of KOA development.
MATERIALS AND METHODS
Identification and eligibility of relevant studies
We conducted searches on the PubMed, Embase, and SinoMed databases, with the last search updated on April 11, 2017. The keywords used were “ADAM12” or “a disintegrin and metalloprotease 12,” “polymorphism” or “variant,” and “osteoarthritis” (Supplementary Table 1), without any restriction on language or publication year. A total of 36 articles were retrieved, among which five articles coincided with the inclusion criteria. We also manually screened the references of the retrieved articles and review articles.
Inclusion and exclusion criteria
Studies that were included in our analysis had to meet all of the following criteria: (i) published studies according to the correlation between KOA and rs3740199/rs1278279/rs1871054/rs1044122 polymorphisms in the ADAM12 gene, (ii) case-control studies, and (iii) sufficient genotype numbers (CC/CG/GG for rs3740199; AA/AG/GG for rs1278279; and CC/CT/TT for both rs1871054 and rs1044122) in both cases and controls. The following exclusion criteria were used: (i) no control population, (ii) no available number in genotyping frequency, and (iii) duplication of previous publications.
Quality score assessment
The Newcastle-Ottawa Scale (NOS) [27] was selected to assess the quality of each study. This measure assesses aspects of methodology in observational studies related to study quality, including selection of cases, comparability of populations, and ascertainment of exposure to risks. The NOS ranges from zero (worst) to nine stars (best). Studies with a score of seven stars or greater were considered of high quality.
Data extraction
Two of the authors independently extracted all data and ensured that they complied with the selection criteria. The following information was obtained: first author’s last name, year of publication, country of origin, ethnicity, total and each genotype number in case/control group, source of controls, HWE of controls, sex data, and genotyping methods. Ethnicity was categorized as Caucasian or Asian. The control subgroups were population-based and hospital-based, and the sex subgroup was classified by male and female
Statistical analysis
ORs with 95% CIs were used to measure the strength of associations between polymorphisms in the ADAM12 gene and KOA. Fixed effects and random effects models were used to calculate pooled ORs. The statistical significance of the total OR was determined using Z-tests. Heterogeneity assumption was performed using a χ2-based Q-test among the studies. If the P value was greater than 0.10 for the Q-test, indicating a lack of heterogeneity among the studies, the fixed effects model (Mantel-Haenszel method) was chosen; otherwise, the random effects model (DerSimonian-Laird method) was used [28, 29]. For ADAM12 gene polymorphisms, we investigated the association between genetic variants and KOA risk based on allelic contrast (C versus G for rs3740199; A versus G for rs1278279; and C versus T for rs1871054 and rs1044122), heterozygote comparison (CG versus GG for rs3740199; AG versus GG for rs1278279; and CT versus TT for rs1871054 and rs1044122), homozygote comparison (CC versus GG for rs3740199; AA versus GG for rs1278279; and CC versus TT for rs1871054 and rs1044122), the recessive genetic model (CC versus CG+GG for rs3740199; AA versus AG+GG for rs1278279; and CC versus CT+TT for rs1871054 and rs1044122), and the dominant genetic model (CG+CC versus GG for rs3740199; AG+AA versus GG for rs1278279; and CT+CC versus TT for rs1871054 and rs1044122). A sensitivity analysis was performed by omitting studies, one after the other, to assess the stability of results. Departure of the frequencies of the ADAM12 gene polymorphisms from HWE was assessed by Pearson’s χ2 test, where results of P < 0.05 were considered significant [30]. Publication bias was assessed by both Egger’s and Begg’s tests, and results of P < 0.05 were considered significant [31]. All statistical tests for this meta-analysis were performed using Stata software version 11.0 (StataCorp LP, College Station, TX, USA), and the power of the analysis was calculated by Power and Sample Size Calculation (http://biostat.mc.vanderbilt.edu/wiki/Main/PowerSampleSize#Windows).
Genotyping methods
Genotyping of the polymorphisms in the ADAM12 gene was conducted using methods described in the retrieved literature; namely, polymerase chain reaction with restriction fragment length polymorphism; polymerase chain reaction with high-resolution melting; and improved multiplex ligase detection reaction.
ACKNOWLEDGMENTS
This work was supported by the National Natural and Science Foundation (81501874), Jiangsu Province Health and Family Planning Commission Foundation (Q201511 and QNRC2016139) (all foundations to Kewei Ren); The Project of Invigorating Health Care through Science, Technology and Education (Jiangsu Provincial Medical Youth Talent), and Changzhou High-level Medical Talents Training Project (2016CZBJ029) (all foundations to Luming Nong).
CONFLICTS OF INTEREST
The authors declare no conflicts of interest.
REFERENCES
1. Dieppe PA, Lohmander LS. Pathogenesis and management of pain in osteoarthritis. Lancet. 2005;365:965-973.
2. Felson DT. An update on the pathogenesis and epidemiology of osteoarthritis. Radiol Clin North Am. 2004;42:1-9.
3. Valdes AM, Doherty M, Spector TD. The additive effect of individual genes in predicting risk of knee osteoarthritis. Ann Rheum Dis. 2008;67:124-127.
4. Evangelou E, Valdes AM, Kerkhof HJ, Styrkarsdottir U, Zhu Y, Meulenbelt I, Lories RJ, Karassa FB, Tylzanowski P, Bos SD; arcOGEN Consortium, Akune T, Arden NK, et al. Meta-analysis of genome-wide association studies confirms a susceptibility locus for knee osteoarthritis on chromosome 7q22. Ann Rheum Dis. 2011;70:349-355.
5. Valdes AM, Evangelou E, Kerkhof HJ, Tamm A, Doherty SA, Kisand K, Tamm A, Kerna I, Uitterlinden A, Hofman A, Rivadeneira F, Cooper C, Dennison EM, et al. The GDF5 rs143383 polymorphism is associated with osteoarthritis of the knee with genome-widestatistical significance. Ann Rheum Dis. 2011;70:873-875.
6. Kveiborg M, Albrechtsen R, Couchman JR, Wewer UM. Cellular roles of ADAM12 in health and disease. Int J Biochem Cell Biol. 2008;40:1685-1702.
7. Mochizuki S, Okada Y. ADAMs in cancer cell proliferation and progression. Cancer Sci. 2007;98:621-628.
8. Verrier S, Hogan A, McKie N, Horton M. ADAM gene expression and regulation during human osteoclast formation. Bone. 2004;35:34-46.
9. Abe E, Mocharla H, Yamate T, Taguchi Y, Manolagas SC. Meltrin-alpha, a fusion protein involved in multinucleated giant cell and osteoclast formation. Calcif Tissue Int. 1999;64:508-515.
10. Kveiborg M, Albrechtsen R, Rudkjaer L, Wen G, Damgaard-Pedersen K, Wewer UM. ADAM12-S stimulates bone growth in transgenic mice by modulating chondrocyte proliferation and maturation. J Bone Miner Res. 2006;21:1288-1296.
11. Okada A1, Mochizuki S, Yatabe T, Kimura T, Shiomi T, Fujita Y, Matsumoto H, Sehara-Fujisawa A, Iwamoto Y, Okada Y. ADAM-12 (meltrin alpha) is involved in chondrocyte proliferation via cleavage of insulin-like growth factor binding protein 5 in osteoarthritic cartilage. Arthritis Rheum. 2008;58:778-789.
12. Sato T, Konomi K, Yamasaki S, Aratani S, Tsuchimochi K, Yokouchi M, Masuko-Hongo K, Yagishita N, Nakamura H, Komiya S, Beppu M, Aoki H, Nishioka K, et al. Comparative analysis of gene expression profiles in intact and damaged regions of human osteoarthritic cartilage. Arthritis Rheum. 2006;54:808-817.
13. Ma G, Ainola M, Liljeström M, Santavirta S, Poduval P, Zhao D, Chen T, Konttinen YT. Increased expression and processing of ADAM 12 (meltrin-alpha) in osteolysis associated with aseptic loosening of total hip replacement implants. J Rheumatol. 2005;32:1943-1950.
14. Kerna I, Kisand K, Laitinen P, Tamm AE, Kumm J, Lintrop M, Tamm AO. Association of ADAM12-S protein with radiographic features of knee osteoarthritis and bone andcartilage markers. Rheumatol Int. 2012;32:519-523.
15. Valdes AM, Hart DJ, Jones KA, Surdulescu G, Swarbrick P, Doyle DV, Schafer AJ, Spector TD. Association study of candidate genes for the prevalence and progression of knee osteoarthritis. Arthritis Rheum. 2004;50:2497-2507.
16. Poonpet T, Tammachote R, Tammachote N, Kanitnate S, Honsawek S. Association between ADAM12 polymorphism and knee osteoarthritis in Thai population. Knee. 2016;23:357-361.
17. Shin MH, Lee SJ, Kee SJ, Song SK, Kweon SS, Park DJ, Park YW, Lee SS, Kim TJ. Genetic association analysis of GDF5 and ADAM12 for knee osteoarthritis. Joint Bone Spine. 2012;79:488-491.
18. Kerna I, Kisand K, Tamm AE, Lintrop M, Veske K, Tamm AO. Missense single nucleotide polymorphism of the ADAM12 gene is associated with radio graphic knee osteoarthritis in middle-aged Estonian cohort. Osteoarthritis Cartilage. 2009;17:1093-1098.
19. Wang L, Guo L, Tian F, Hao R, Yang T. Analysis of single nucleotide polymorphisms within ADAM12 and risk of knee osteoarthritis in a Chinese Han population. Biomed Res Int. 2015;2015:518643.
20. Lou S, Zhao Z, Qian J, Zhao K, Wang R. Association of single nucleotide polymorphisms in ADAM12 gene with susceptibility to knee osteoarthritis: a case-control study in a Chinese Han population. Int J Clin Exp Pathol. 2014;7:5154-5159.
21. Zang Y, Fung WK, Zheng G. Simple algorithms to calculate asymptotic null distributions of robust tests in case-control genetic association studies in R. J Stat Softw. 2010;33:1-24.
22. Sterne JA, Sutton AJ, Ioannidis JP, Terrin N, Jones DR, Lau J, Carpenter J, Rücker G, Harbord RM, Schmid CH, Tetzlaff J, Deeks JJ, Peters J, et al. Recommendations for examining and interpreting funnel plot asymmetry in meta-analyses of randomised controlled trials. BMJ. 2011;343:d4002.
23. Takahashi H, Nakajima M, Ozaki K, Tanaka T, Kamatani N, Ikegawa S. Prediction model for knee osteoarthritis based on genetic and clinical information. Arthritis Res Ther. 2010;12:R187.
24. Gagnier JJ, Morgenstern H, Chess L. Interventions designed to prevent anterior cruciate ligament injuries in adolescents and adults: asystematic review and meta-analysis. Am J Sports Med. 2013;41:1952-1962.
25. Valdes AM, Van Oene M, Hart DJ, Surdulescu GL, Loughlin J, Doherty M, Spector TD. Reproducible genetic associations between candidate genes and clinical knee osteoarthritis inmen and women. Arthritis Rheum. 2006;54:533-539.
26. Limer KL, Tosh K, Bujac SR, McConnell R, Doherty S, Nyberg F, Zhang W, Doherty M, Muir KR, Maciewicz RA. Attempt to replicate published genetic associations in a large, well-defined osteoarthritis case-control population (the GOAL study). Osteoarthritis Cartilage. 2009;17:782-789.
27. Wells GA, Shea B, O’Connell D, Peterson RJ, Welch V, Losos M, Tugwell P. The Newcastle-Ottawa Scale (NOS) for assessing the quality of nonrandomised studies in meta-analyses. Ottawa Health Research Institute. http://www.ohri.ca/programs/clinical_epidemiology/oxford.asp (accessed Oct 20, 2011).
28. Mantel N, Haenszel W. Statistical aspects of the analysis of data from retrospective studies of disease. J Natl Cancer Inst. 1959;22:719-748.
29. DerSimonian R, Laird N. Meta-analysis in clinical trials. Control Clin Trials. 1986;7:177-188.
30. Napolioni V. The relevance of checking population allele frequencies and Hardy-Weinberg Equilibrium ingenetic association studies: the case of SLC6A4 5-HTTLPR polymorphism in a Chinese Han Irritable Bowel Syndrome association study. Immunol Lett. 2014;162:276-278.
31. Hayashino Y, Noguchi Y, Fukui T. Systematic evaluation and comparison of statistical tests for publication bias. J Epidemiol. 2005;15:235-243.