
INTRODUCTION
It has been well documented that early-life environment plays an important role in adult health [1, 2]. Gestational diabetes mellitus (GDM), a common pregnancy complication, affects up to 28% of all pregnancies and contributes to the long term metabolic derangements both in mother and child [3, 4]. Perturbations in glucose and lipid metabolism may manifest early in children exposed to intrauterine hyperglycemia [5-7]. Although many studies have investigated the correlation between intrauterine hyperglycemia and the incidence of diabetes in offspring, the mechanisms of maternal intrauterine hyperglycemia induced offspring diabetes remain unclear.
Insulin resistance is the primary cause of type 2 diabetes and several factors have been proposed to explain the mechanisms of insulin resistance, such as lipotoxicity, inflammation, oxidative stress and mitochondrial dysfunction [8-10]. Mitochondrial dysfunction from pharmacological treatment or genetic manipulation has close relationship with insulin resistance [11-13]. Malonyl-CoA-acyl carrier protein transacylase (MCAT) is closely associated with FASII pathway of fatty acid biosynthesis in mitochondria [14]. The first committed step of fatty acid biosynthesis is the conversion of acetyl-CoA to malonyl-CoA by an ATP dependent acetyl-CoA carboxylase followed by the conversion of malonyl-CoA to malonyl-ACP through MCAT [15, 16]. MCAT overexpression can be used to improve fatty acid production by increasing the malonyl-ACP availability, and MCAT gene whole body knockout manifests primarily as a lipoylation defect, leading to decreased body weight, loss of white adipose tissue and energy disequilibrium [17]. However, specific roles of MCAT in insulin resistance are still unknown and need to be determined.
Herein we investigated the alteration of umbilical cord blood MCAT levels in offspring exposed to intrauterine hyperglycemia, and explored the network of MCAT in the mechanisms of insulin resistance. We hypothesized that MCAT expression in the umbilical cord blood from GDM patients would be increased, and the dramatically changed proteins in the network of MCAT may contribute to insulin resistance in the offspring.
RESULTS
Differential regulated genes by RNA sequencing in umbilical cord blood lymphocytes from normal pregnant women and GDM patients
By RNA sequencing, we found that there were 460 differentially expressed genes identified in the umbilical cord blood lymphocytes between normal pregnant women and GDM patients. Of those, 248 genes were down-regulated while 212 genes were up-regulated in the umbilical cord blood lymphocytes from GDM patients compared with those from normal pregnant women (Figure 1A, 1B and Supplementary Table 1).
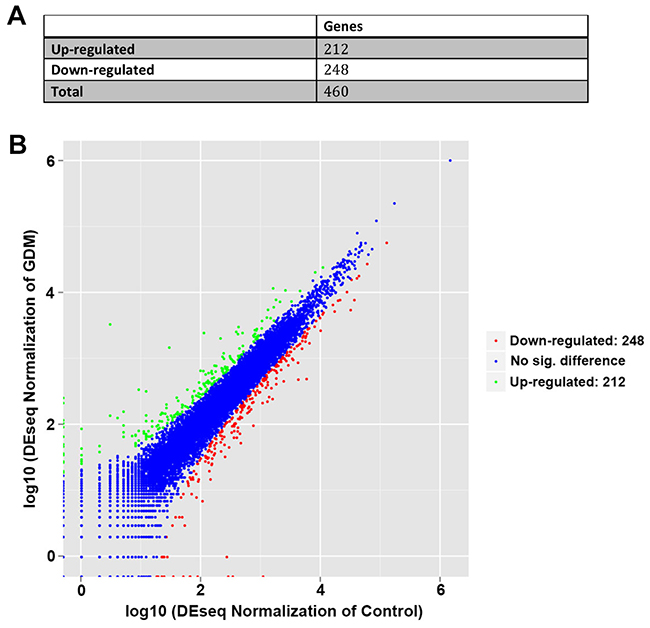
Figure 1: Differential regulated genes by RNA sequencing in umbilical cord blood lymphocytes from normal pregnant women and GDM patients. (A) The number of identified genes. (B) Volcano plot presentation of the significantly altered gene profiles identified in umbilical cord blood lymphocytes. Up-regulated and down-regulated genes are indicated in dots of green and red, respectively.
Gene ontology (GO) enrichment analysis of differential expressed genes
Through GO enrichment analysis, we found that these differential expressed genes were mainly involved in the biological process, cellular components and molecular function (Figure 2). In detail, the differential expressed genes were enriched in immune system process, response to stress and signal transduction. It is estimated that the genes involved in immune system, stress response and signal transduction were dramatically changed in the umbilical vein blood affected by intrauterine hyperglycemia.
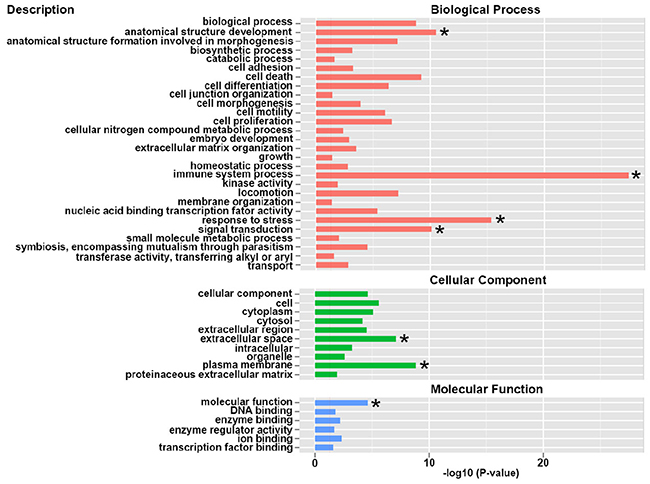
Figure 2: Gene Ontology (GO) enrichment analysis of differential expressed genes. GO terms assigned to biological process, cellular component and molecular functions.
Kyoto encyclopedia of genes and genomes (KEGG) pathway classification enrichment analysis of differentiated expressed genes
Through KEGG enrichment analysis, we checked the pathway classification enrichment of the differential regulated genes. In environmental information processing pathway, signal transduction and signaling molecules and interaction were dramatically regulated. In organismal systems pathways, immune system, endocrine system, digestive system and development pathways were significantly regulated. In human diseases pathways, cancers, immune diseases, endocrine and metabolic diseases and infectious diseases were dramatically affected (Figure 3). We assumed that the genes involved in endocrine system and its signaling pathways were significantly changed in the umbilical cord blood affected by intrauterine hyperglycemia.
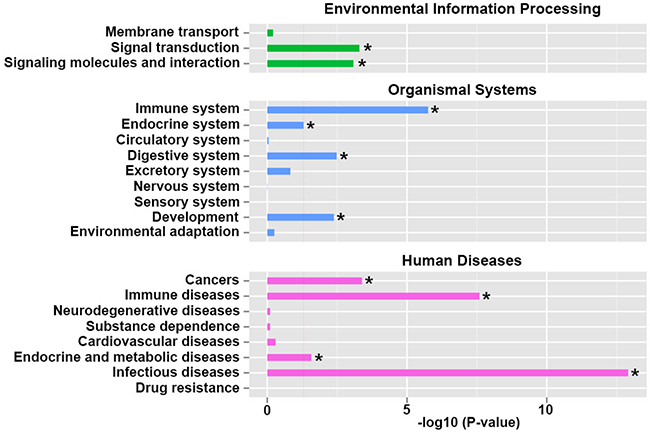
Figure 3: Kyoto Encyclopedia of Genes and Genomes (KEGG) pathway classification enrichment analysis of differentiated expressed genes. Functional annotation and metabolic pathway analysis were grouped in environmental information processing, organismal systems and human diseases. The results are shown as the negative logarithm of significance, which is a statistical score and is a measure of the likelihood of the genes in a given network being found together as a result of chance, as determined by a Fisher’s exact test.
MCAT network by RNA sequencing
From the RNA sequencing, we found out the network of MCAT (Figure 4A). MCAT gene expression was increased in the umbilical cord blood lymphocytes from GDM patients compared with that in normal pregnant women (Figure 4B). Many genes have the co-expression relationship with MCAT, such as KRTAP5-8, SAMM50, IL27, WNT16, ZNF142, PIH1D1, CBY1, SRM, PEX10, FASN, MRPS16. Some genes have physical interactions with MCAT, like ITGAV, SHMT1, PTPN1, SUMO2, TAP1, SPCS2, TMEM43, RAVER1, AGMAT and MRPS16. Besides, MCAT has shared protein domains with FASN (Table 1). This analysis was performed by GeneMANIA that find genes related to a set of input genes, using a very large set of functional association data. Association data include protein and genetic interactions, pathways, co-expression, co-localization and protein domain similarity.
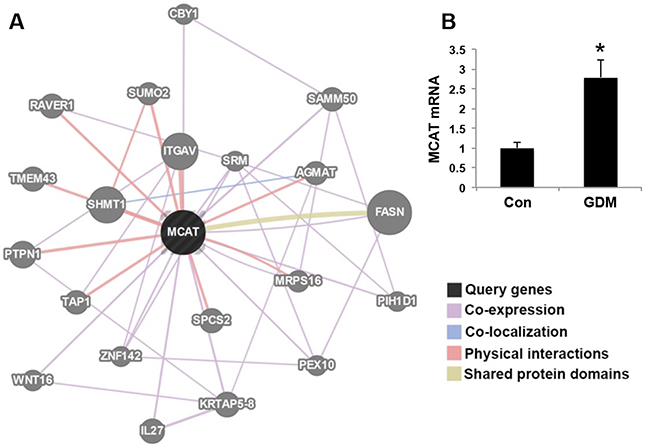
Figure 4: MCAT network by RNA sequencing. (A) The query gene MCAT (marked black) has close relationship with the candidate genes (marked gray). The lines indicating the relationship of co-expression, co-localization, physical interactions and shared protein domains are marked pink, blue, red and yellow, respectively. (B) MCAT mRNA expression in umbilical cord blood from normal control pregnant women (Con) and GDM patients. N=6 in each group. *P<0.05 vs. Con.
Table 1: MCAT network associated genes
Gene 1 |
Gene 2 |
Network group |
Networks |
|---|---|---|---|
MCAT |
PTPN1* |
Physical interactions |
Havugimana-Emili-2012 |
MCAT |
STAT5A* |
Co-expression |
Wu-Garvey-2007 |
MCAT |
KRTAP5-8 |
Co-expression |
Innocenti-Brown-2011 Mallon-McKay-2013 |
MCAT |
SAMM50 |
Co-expression |
Burington-Shaughnessy-2008 Cheok-Evans-2003 |
MCAT |
IL27 |
Co-expression |
Innocenti-Brown-2011 Mallon-McKay-2013 |
MCAT |
WNT16 |
Co-expression |
Gysin-McMahon-2012 |
MCAT |
ZNF142 |
Co-expression |
Burington-Shaughnessy-2008 Salaverria-Siebert-2011 Wu-Garvey-2007 |
MCAT |
PIH1D1 |
Co-expression |
Innocenti-Brown-2011 Kang-Willman-2010 Salaverria-Siebert-2011 |
MCAT |
CBY1 |
Co-expression |
Bild-Nevins-2006 B Gysin-McMahon-2012 |
MCAT |
SRM |
Co-expression |
Roth-Zlotnik-2006 |
MCAT |
PEX10 |
Co-expression |
Bild-Nevins-2006 B Burington-Shaughnessy-2008 |
MCAT |
FASN |
Co-expression |
Bild-Nevins-2006 B |
MCAT |
MRPS16 |
Co-expression |
Salaverria-Siebert-2011 |
MCAT |
ITGAV |
Physical interactions |
Havugimana-Emili-2012 |
MCAT |
SHMT1 |
Physical interactions |
Havugimana-Emili-2012 |
MCAT |
SUMO2 |
Physical interactions |
BIOGRID-SMALL-SCALE-STUDIES |
MCAT |
TAP1 |
Physical interactions |
Havugimana-Emili-2012 |
MCAT |
SPCS2 |
Physical interactions |
Havugimana-Emili-2012 |
MCAT |
TMEM43 |
Physical interactions |
Havugimana-Emili-2012 |
MCAT |
RAVER1 |
Physical interactions |
Havugimana-Emili-2012 |
MCAT |
AGMAT |
Physical interactions |
Havugimana-Emili-2012 |
MCAT |
MRPS16 |
Physical interactions |
Havugimana-Emili-2012 |
MCAT |
FASN |
Shared protein domains |
INTERPRO PFAM |
MCAT: Malony-CoA-Acyl Carrier Protein Transacylase, PTPN1: Protein Tyrosine Phosphatase, Non-Receptor Type 1, STAT5A: Signal Transducer And Activator Of Transcription 5A, KRTAP5-8: Keratin Associated Protein 5-8, SAMM50: Sorting And Assembly Machinery Component 50, IL27: Interleukin 27, WNT16: Wnt Family Member 16, ZNF142: Zinc Finger Protein 142, PIH1D1: PIH1 Domain Containing 1, CBY1: Chibby Homolog 1, SRM: Spermidine Synthase, PEX10: Peroxisomal Biogenesis Factor 10, FASN: Fatty Acid Synthase, MRPS16: Mitochondrial Ribosomal Protein S16, ITGAV: Integrin Subunit Alpha V, SHMT1: Serine Hydroxymethyltransferase 1, SUMO2: Small Ubiquitin-Like Modifier 2, TAP1: Transporter 1, SPCS2: Signal Peptidase Complex Subunit 2, TMEM43: Transmembrane Protein 43, RAVER1: Ribonucleoprotein, AGMAT: Agmatinase.
We found that some genes like PTPN1 (Protein Tyrosine Phosphatase, Non-Receptor Type1) and STAT5A (Signal Transducer And Activator of Transcription 5A), which were involved in insulin signaling pathways had close relationship with MCAT (Table 1), it is possible that the pathways of MCAT may be novel mechanisms as to the offspring insulin resistance affected by intrauterine hyperglycemia.
MCAT, PTPN1 and STAT5A expression in lymphocytes of umbilical cord blood from normal pregnant women and GDM patients
We further verified the MCAT network by Western blotting in umbilical cord blood from both normal control pregnant women and GDM patients. As shown in Figure 5A and Supplementary Figure 1, the protein expressions of MCAT, PTPN1 and STAT5A were increased in the lymphocytes of umbilical cord blood from GDM patients compared with those in healthy pregnant women, with significant differences by quantification (Figure 5B). These data suggest that the signaling pathways that involved MCAT, PTPN1 and STAT5A may contribute to offspring insulin resistance affected by intrauterine hyperglycemia.
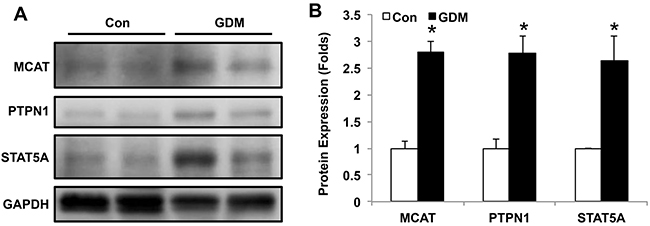
Figure 5: MCAT, PTPN1 and STAT5A expression in lymphocytes of umbilical cord blood from normal pregnant women and GDM patients. (A) Representative western blot of MCAT, PTPN1 and STAT5A protein expression in umbilical cord blood from normal control pregnant women (Con) and GDM patients. (B) Bar figure of the statistical analysis for MCAT, PTPN1 and STAT5A protein quantification. N=6 in each group. * P<0.05 vs. Con.
MCAT methylation in umbilical cord blood lymphocytes from normal pregnant women and GDM patients
MCAT allelic expression is regulated by allele-specific methylation at 3 differentially methylated regions (DMRs). We collected the lymphocytes of umbilical cord blood from 3 control pregnant women and 3 GDM patients, and analyzed the methylation levels of 4 cytosine phosphate guanine (CpGs) of the MCAT DMR1, 3 CpGs of the MCAT DMR2, and 7 CpGs of the MCAT DMR3 by bisulfite genomic sequencing PCR (Figure 6A). We found that in MCAT DMR1, the methylation status of CpG sites 1 and 4 was hypomethylated in GDM patients (90.85 ± 0.76% for site 1 and 82.33 ± 1.37% for site 4, respectively) compared with control (95.24 ± 0.93% for site 1 and 87.78 ± 1.15% for site 4, respectively) (Figure 6B). In MCAT DMR2, the methylation status in control and GDM groups did not show significant differences (Figure 6C). In MCAT DMR3, CpG site 12 showed less methylation in GDM group (4.51 ± 0.10%) than control group (5.06 ± 0.14%) (Figure 6D). The decreased methylation status of MCAT in GDM groups may account for the increased gene expression of MCAT in the lymphocytes of umbilical cord blood from GDM patients compared with the control group.
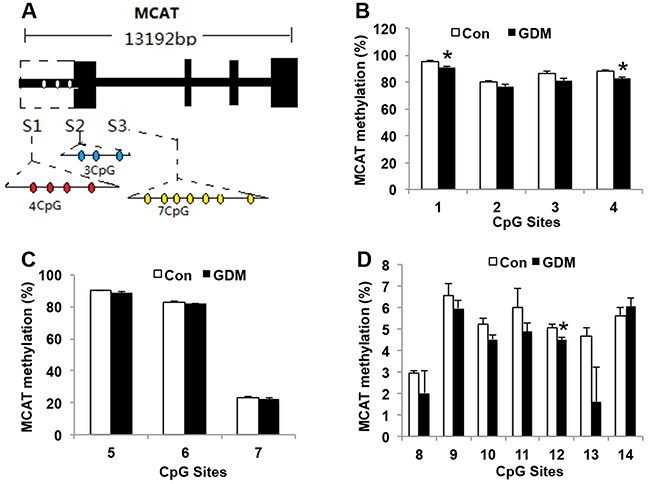
Figure 6: MCAT methylation in umbilical cord blood lymphocytes from normal pregnant women and GDM patients. (A) Schematic diagram of the cytosine phosphate guanine (CpG) sites for MCAT promoter. (B) Methylation levels in CpG sites 1 to 4 in MCAT DMR1 (S1). (C) Methylation levels in CpG sites 5 to 7 in MCAT DMR2 (S2). (D) Methylation levels in CpG sites 8 to 14 in MCAT DMR3 (S3). N=3 in each group. * P<0.05 vs. Con.
DISCUSSION
In the present study, we found that MCAT, PTPN1 and STAT5A were closely associated and all increased in the lymphocytes of umbilical cord blood from GDM patients compared with those in healthy pregnant women. Since PTPN1 and STAT5A were demonstrated to impair insulin signaling, MCAT and its network may be novel mechanisms as to the offspring insulin resistance affected by intrauterine hyperglycemia.
This study proposes for the first time that MCAT network contributes to the offspring insulin resistance from GDM mothers. MCAT mRNA and protein were elevated in the lymphocytes of umbilical cord blood from GDM mothers. MCAT DNA methylation was decreased in several CpG sites of MCAT promoter, which may account for the increased MCAT mRNA level. Since MCAT is of vital importance in fatty acid synthesis, the increased ability of fatty acid synthesis in GDM mothers can pass to the offspring through the lymphocytes of umbilical cord blood. The specific role of MCAT in insulin resistance has not been determined. It is estimated that increased MCAT expression will lead to enhanced fatty acid synthesis and lipotoxicity, which may induce insulin resistance. It has been demonstrated that MCAT whole body knockout (KO) mice showed compromised mitochondrial fatty acid synthesis leading to loss of white adipose tissue and disruption of energy metabolism [17]. The specific role of liver or adipose tissue MCAT in insulin resistance needs to be explored in future study.
Through MCAT net analysis, we found that MCAT can physically interact with PTPN1 and co-expressed with STAT5A. PTPN1 has been shown to act as a negative regulator of insulin signaling by dephosphorylating the phosphotyrosine residues of insulin receptor kinase [18, 19]. Loss of PTPN1 activity causes enhanced insulin sensitivity and resistance to weight gain in mice [20]. Further, liver specific PTPN1 deficiency improves hepatic insulin sensitivity and whole body glucose homeostasis [21, 22]. Therefore, inhibition of PTPN1 has been proposed to be a potential therapy for obesity, insulin resistance and type-2 diabetes mellitus [23]. Besides, STAT5 activity in pancreatic beta cells influences the severity of diabetes in animal models of type 1 and 2 diabetes [24]. The STAT5A-mediated induction of pyruvate dehydrogenase kinase 4 expression by prolactin results in an inhibition of insulin-stimulated glucose transport in fat cells and contributes to insulin resistance [25]. Furthermore, intrauterine hyperglycemia induced offspring glucose intolerance by inhibiting pyruvate dehydrogenase (PDH) activity, along with increased PDH phosphorylation in the liver [26]. The increased PTPN1 and STAT5A in the lymphocytes of umbilical core blood in GDM mothers are proposed to contribute to offspring insulin resistance. Besides PTPN1 and STAT5A, some other genes like FASN, TAP1, which are also involved in insulin resistance [27, 28], have close relationship with MCAT. The potential relationship between MCAT and these genes will be explored in the future study.
In conclusion, MCAT and its crosstalk with PTPN1, STAT5A are increased in the umbilical cord blood affected by maternal uterine hyperglycemia. Inhibition of MCAT by pharmacological treatment in clinic may be a novel way to cure diabetes.
MATERIALS AND METHODS
Isolation of lymphocytes from umbilical cord blood
The umbilical cord blood was collected from both normal pregnant women and GDM pregnant women after delivering babies in International Peace Maternity and Child Hospital and was approved by Shanghai Jiaotong University Ethics Committee. Diagnosis for GDM: fasting blood glucose level greater than 5.1 mmol/l or 1 and 2 h blood glucose levels after the oral glucose tolerance test (OGTT) greater than 10.0 mmol/l and 8.5 mmol/l, respectively. OGTT was conducted within 24th-28th weeks of pregnancy. The blood was diluted with sterile PBS and poured carefully onto the Ficoll solution. The tubes were centrifuged at 400 g for 20 min and the ring with lymphocytes were harvested without touching the Ficoll. The lymphocytes were then washed twice with PBS and used for further study.
Extraction of total RNA
Total RNA was extracted using RNAiso Plus Total RNA extraction reagent (TaKaRa, Shiga, Japan) following the manufacturer’s instructions. The residual genomic DNA in total RNA was removed by DNase I (MBI Fermentas, Glen Burnie, MD, USA). Total RNA was dissolved in RNase-free water and RNA integrity was measured using Agilent 2100 bioanalyzer (Quantifluor-ST fluorometer, Promega, E6090). The high quality RNA was used for cDNA library construction and Illumina sequencing.
Sequencing
Poly (A) mRNA was isolated from the total RNA using the PolyA+ Tract mRNA Isolation System (Illumina, San Diego, CA), and further purified using the RNeasy MinElute Clean up Kit (Qiagen, Hilden, Germany) following the manufacturer’s protocol. Fragmentation buffer was added to cleave mRNA into short fragments, and these fragments were used to synthesize first-strand cDNA using random hexamer primers, which was further transformed into double stranded cDNA with RHase H and DNA polymerase I. A paired-end library was constructed from the cDNA synthesized using the Genomic Sample Prep Kit (Illumina). Fragments larger than 375 bp were purified with QIAquick PCR Extraction Kit (Qiagen), end-repaired, and linked with sequencing adapters. AMPureXP beads were used to remove the unsuitable fragments, and the sequencing library was constructed with PCR amplification. After being validated using Pico green staining (Quant-iT PicoGreen dsDNA Assay Kit, Invitrogen, P7589) and fluorospectrophotometry, and quantified using Agilent 2100 (Quantifluor-ST fluorometer, Promega, E6090), the library was sequenced using Illumina Miseq Platform (Shanghai Personal Biotechnology Cp., Ltd. Shanghai, China). The read length was 2×150 bp, and 6 Gbp sequencing runs were performed. For subsequent analysis, 1/2 run data was generated.
Quantitative real-time RT-PCR (qRT-PCR)
SYBR Green RT-PCR reaction was used to quantify mRNA. The total RNA was prepared from tissues or cells with TRIzol reagent (Sigma, St. Louis, MO). The assay was conducted with 7900 HT Fast real-time PCR System (Applied Biosystems, Foster City, CA). The target mRNA signal was normalized with GAPDH RNA.
DNA methylation (bisulfite genomic sequencing PCR)
Genomic DNA was extracted from lymphocytes of umbilical cord blood in control and GDM groups. Bisulfite was converted using the EpiTect bisulfite kit (Qiagen, Valencia, CA) to deaminate cytosine to uracil according to the manufacturer’s instructions; 5-methyl-cytosine was protected from deamination. Analysis of the methylation status of the MCAT DMR was determined by cloning and sequencing of bisulfite-treated DNA. The purified PCR products were cloned using the pMD19-T vector system (TaKaRa, Dalian, China). The sequence obtained by cloning was analyzed with 3730 DNA Analyzer polymers (Applied Biosystems, Carlsbad, CA).
Western blot analysis
Cell preparations were sonicated in lysis buffer and 50 μg protein was resolved on a 8% SDS-PAGE gel and electroblotted onto PVDF membrane. Blots were then blocked in 5% nonfat milk containing 0.05% Tween-20, rinsed in PBS (pH 7.4), and incubated with the following antibodies: mouse monoclonal anti-MCAT (1:1000), rabbit monoclonal anti-PTPN1 (1:1000), rabbit monoclonal anti-STAT5A (1:1000) and rabbit polyclonal anti-GAPDH (1:1000). GAPDH was probed as a loading control. The immunoreactivity was visualized by enhanced chemiluminescence substrate system (ECL). Films were scanned and subsequently analyzed by measuring the optical densities of immunostained bands using an image-processing and analysis system (Bio-Rad, Hercules, CA).
Statistical analysis
The tool used for the differential expression analysis was DESeq, which is an R package to analyze count data from high-throughput sequencing assays such as RNA-Seq and test for differential expression. We used the software named MGI GO Term Finder to perform GO enrichment analysis, which was established to provide a common language to describe aspects of a gene product’s biology. The method of KEGG enrichment analysis was similar to GO enrichment analysis and performed the same arithmetic. We detected MCAT gene promoter region methylation pattern using pyrosequencing.
In this study, the data were presented as the mean ± SEM from multiple samples and each experiment was conducted at least three times. The representative immunoblot is presented. In the statistical analysis, two-tailed, unpaired Student’s t test was used in analysis of the data with significance P< 0.05.
Abbreviations
MCAT: Malonyl-CoA-Acyl Carrier Protein Transacylase, PDH: Pyruvate Dehydrogenase, GDM: Gestational Diabetes Mellitus, GO: Gene Ontology, KEGG: Kyoto Encyclopedia of Genes and Genomes, DMR: Differentially Methylated Region, CpG: Cytosine phosphate Guanine, PTPN1: Protein Tyrosine Phosphatase, Non-Receptor Type 1, STAT5A: Signal Transducer And Activator Of Transcription 5A, KRTAP5-8: Keratin Associated Protein 5-8, SAMM50: Sorting And Assembly Machinery Component 50, IL27: Interleukin 27, WNT16: Wnt Family Member 16, ZNF142: Zinc Finger Protein 142, PIH1D1: PIH1 Domain Containing 1, CBY1: Chibby Homolog 1, SRM: Spermidine Synthase, PEX10: Peroxisomal Biogenesis Factor 10, FASN: Fatty Acid Synthase, MRPS16: Mitochondrial Ribosomal Protein S16, ITGAV: Integrin Subunit Alpha V, SHMT1: Serine Hydroxymethyltransferase 1, SUMO2: Small Ubiquitin-Like Modifier 2, TAP1: Transporter 1, SPCS2: Signal Peptidase Complex Subunit 2, TMEM43: Transmembrane Protein 43, RAVER1: Ribonucleoprotein, AGMAT: Agmatinase.
Author contributions
Y.Z, J.Y conducted the experiments and analyzed the data. Y.Z and J.F designed the study and prepared the manuscript. All authors read and approved the final version of manuscript.
CONFLICTS OF INTEREST
The authors declare that they have no conflicts of interest concerning this article.
FUNDING
This work was supported by grants from the National Natural Science Foundation of China (Nos. 81471516 and 81501274), the Shanghai Pujiang Program (15PJ1408900) and the Shanghai Municipal Commission of Health and Family Planning (No. 15GWZK0701).
REFERENCES
1. Hales CN, Barker DJ. Type 2 (non-insulin-dependent) diabetes mellitus: the thrifty phenotype hypothesis. Diabetologia. 1992; 35:595-601.
2. Sarr O, Yang K, Regnault TR. In utero programming of later adiposity: the role of fetal growth restriction. J Pregnancy. 2012; 2012:134758.
3. Clausen TD, Mathiesen ER, Hansen T, Pedersen O, Jensen DM, Lauenborg J, Schmidt L, Damm P. Overweight and the metabolic syndrome in adult offspring of women with diet-treated gestational diabetes mellitus or type 1 diabetes. J Clin Endocrinol Metab. 2009; 94:2464-2470.
4. Lawlor DA, Lichtenstein P, Langstrom N. Association of maternal diabetes mellitus in pregnancy with offspring adiposity into early adulthood: sibling study in a prospective cohort of 280,866 men from 248,293 families. Circulation. 2011; 123:258-265.
5. Krishnaveni GV, Hill JC, Leary SD, Veena SR, Saperia J, Saroja A, Karat SC, Fall CH. Anthropometry, glucose tolerance, and insulin concentrations in Indian children: relationships to maternal glucose and insulin concentrations during pregnancy. Diabetes Care. 2005; 28:2919-2925.
6. Bush NC, Chandler-Laney PC, Rouse DJ, Granger WM, Oster RA, Gower BA. Higher maternal gestational glucose concentration is associated with lower offspring insulin sensitivity and altered beta-cell function. J Clin Endocrinol Metab. 2011; 96:E803-809.
7. Page KA, Romero A, Buchanan TA, Xiang AH. Gestational diabetes mellitus, maternal obesity, and adiposity in offspring. J Pediatr. 2014; 164:807-810.
8. Zhang Y, Ye J. Mitochondrial inhibitor as a new class of insulin sensitizer. Acta Pharm Sin B. 2012; 2:341-349.
9. Ye J. Mechanisms of insulin resistance in obesity. Front Med. 2013; 7:14-24.
10. Zhang Y, Zhao Z, Ke B, Wan L, Wang H, Ye J. Induction of posttranslational modifications of mitochondrial proteins by ATP contributes to negative regulation of mitochondrial function. PLoS One. 2016; 11:e0150454.
11. Bonnard C, Durand A, Peyrol S, Chanseaume E, Chauvin MA, Morio B, Vidal H, Rieusset J. Mitochondrial dysfunction results from oxidative stress in the skeletal muscle of diet-induced insulin-resistant mice. J Clin Invest. 2008; 118:789-800.
12. Yin J, Gao Z, Liu D, Liu Z, Ye J. Berberine improves glucose metabolism through induction of glycolysis. Am J Physiol Endocrinol Metab. 2008; 294:E148-156.
13. Pagel-Langenickel I, Bao J, Joseph JJ, Schwartz DR, Mantell BS, Xu X, Raghavachari N, Sack MN. PGC-1alpha integrates insulin signaling, mitochondrial regulation, and bioenergetic function in skeletal muscle. J Biol Chem. 2008; 283:22464-22472.
14. Zhang L, Joshi AK, Smith S. Cloning, expression, characterization, and interaction of two components of a human mitochondrial fatty acid synthase. Malonyltransferase and acyl carrier protein. J Biol Chem. 2003; 278:40067-40074.
15. Bunkoczi G, Misquitta S, Wu X, Lee WH, Rojkova A, Kochan G, Kavanagh KL, Oppermann U, Smith S. Structural basis for different specificities of acyltransferases associated with the human cytosolic and mitochondrial fatty acid synthases. Chem Biol. 2009; 16:667-675.
16. Feng D, Witkowski A, Smith S. Down-regulation of mitochondrial acyl carrier protein in mammalian cells compromises protein lipoylation and respiratory complex I and results in cell death. J Biol Chem. 2009; 284:11436-11445.
17. Smith S, Witkowski A, Moghul A, Yoshinaga Y, Nefedov M, de Jong P, Feng D, Fong L, Tu Y, Hu Y, Young SG, Pham T, Cheung C, et al. Compromised mitochondrial fatty acid synthesis in transgenic mice results in defective protein lipoylation and energy disequilibrium. PLoS One. 2012; 7:e47196.
18. Bento JL, Palmer ND, Mychaleckyj JC, Lange LA, Langefeld CD, Rich SS, Freedman BI, Bowden DW. Association of protein tyrosine phosphatase 1B gene polymorphisms with type 2 diabetes. Diabetes. 2004; 53:3007-3012.
19. Liang F, Lee SY, Liang J, Lawrence DS, Zhang ZY. The role of protein-tyrosine phosphatase 1B in integrin signaling. J Biol Chem. 2005; 280:24857-24863.
20. Elchebly M, Payette P, Michaliszyn E, Cromlish W, Collins S, Loy AL, Normandin D, Cheng A, Himms-Hagen J, Chan CC, Ramachandran C, Gresser MJ, Tremblay ML, Kennedy BP. Increased insulin sensitivity and obesity resistance in mice lacking the protein tyrosine phosphatase-1B gene. Science. 1999; 283:1544-1548.
21. Haj FG, Zabolotny JM, Kim YB, Kahn BB, Neel BG. Liver-specific protein-tyrosine phosphatase 1B (PTP1B) re-expression alters glucose homeostasis of PTP1B-/-mice. J Biol Chem. 2005; 280:15038-15046.
22. Gonzalez-Rodriguez A, Clampit JE, Escribano O, Benito M, Rondinone CM, Valverde AM. Developmental switch from prolonged insulin action to increased insulin sensitivity in protein tyrosine phosphatase 1B-deficient hepatocytes. Endocrinology. 2007; 148:594-608.
23. Qian S, Zhang M, He Y, Wang W, Liu S. Recent advances in the development of protein tyrosine phosphatase 1B inhibitors for Type 2 diabetes. Future Med Chem. 2016; 8:1239-1258.
24. Jackerott M, Moldrup A, Thams P, Galsgaard ED, Knudsen J, Lee YC, Nielsen JH. STAT5 activity in pancreatic beta-cells influences the severity of diabetes in animal models of type 1 and 2 diabetes. Diabetes. 2006; 55:2705-2712.
25. White UA, Coulter AA, Miles TK, Stephens JM. The STAT5A-mediated induction of pyruvate dehydrogenase kinase 4 expression by prolactin or growth hormone in adipocytes. Diabetes. 2007; 56:1623-1629.
26. Zhang Y, Zhang Y, Ding GL, Liu XM, Ye J, Sheng JZ, Fan J, Huang HF. Regulation of hepatic pyruvate dehydrogenase phosphorylation in offspring glucose intolerance induced by intrauterine hyperglycemia. Oncotarget. 2017; 8:15205-15212. https://doi.org/10.18632/oncotarget.14837.
27. Wei X, Song H, Yin L, Rizzo MG, Sidhu R, Covey DF, Ory DS, Semenkovich CF. Fatty acid synthesis configures the plasma membrane for inflammation in diabetes. Nature. 2016; 539:294-298.
28. Morand JP, Macri J, Adeli K. Proteomic profiling of hepatic endoplasmic reticulum-associated proteins in an animal model of insulin resistance and metabolic dyslipidemia. J Biol Chem. 2005; 280:17626-17633.