
INTRODUCTION
IgA nephropathy (IgAN) is one of the most common types of primary glomerulonephritis (PGN) in the world, especially in Asia [1-3], since it was first described by Berger in 1968 [4]. Although IgAN was initially regarded as a benign disease, 20-50% patients developed to end-stage renal disease (ESRD) within 20 years after diagnosis [5-7]. We know it more clearly that IgAN is an autoimmune disease based on the findings of increasing levels of both glycto-deficient IgA1 and its antibody in patients’ kidney tissue and serum [8]. Dozens of risk factors of IgAN progression have been reported during the last decades [9-11], including systolic blood pressure (SBP), proteinuria, uric acid, glomerular filtration rate (GFR), hemoglobin, albumin and serum C3 level. However, it is still challenging to precisely predict outcomes of IgAN patients and the discovery of new risk factors are helpful for risk stratification.
ABO is the most important blood group system for the compatibility of transfusion and organ transplantation, since it was firstly reported by Landsteiner in 1900 [12]. Histo-blood group ABH (O) antigens are major histocompatibility antigens in human, expressing not only highly on red blood cell membranes but also widely on the surface of a variety of human cells and tissues, including epithelium, sensory neurons, platelet and vascular endothelium [13-15].The genes encoding the ABO alleles are located on chromosome 9q34.2 [16], composing of 7 exons. Genome-wide association studies (GWAS) [17-19] found that genetic variants at ABO locus were significantly associated with type 2 diabetes, venous thromboembolism and epithelial ovarian cancer. In addition, there have been increasing evidence suggesting that blood group antigens might serve as receptors for parasites, bacteria, and viruses [20, 21]. Associations between blood group antigens and immunoglobulin (Ig) superfamily, selectins, integrins, and cell surface proteoglycans have been reported over the past decades [22-24]. All these studies suggested that blood group antigens played an important role in infections and host inflammatory status. In addition, inflammation and infections have been largely implicated in the onset and progression of immune-mediated diseases. Several mechanism have been uncovered how infectious agents including viruses, bacteria, fungi and parasites trigger immune-mediated diseases [25-27]. We also know that chronic mucosal infections are important factors associated to susceptibility, severity and progression of chronic kidney disease (CKD) and IgAN [28, 29]. We therefore hypothesized ABO blood group might be associated with renal outcomes of IgAN patients and carried out this study to evaluate predictive value of ABO blood group in the progression of IgAN patients.
RESULTS
Baseline demographic and clinical data
The clinical characteristics of patients with IgAN at the time of renal biopsy were shown in Table 1. There were 252(27.4%) patients in type A, 273(29.7%) in type B, 93(10.1%) in type AB and 301(32.8%) in type O in our study (Supplementary Table 1). Our results showed patients with type B and AB had similar baseline clinical characteristics and renal outcomes, as well as patients with type A and O (Supplementary Table S1, Supplementary Figure 1).Therefore, we merged all type B and AB patients into B antigen group (n = 366) and type A and O patients into non-B antigen group (n = 553). Compared to patients from B antigen group, patients from non-B antigen group had lower eGFR, higher systolic blood pressure (SBP), diastolic blood pressure (DBP), uric acid and urea nitrogen (Table 1). Furthermore, we found increased levels of lactate dehydrogenase (LDH) [140.5(122.5-166.25) IU/L vs.128(121.25-142.5) IU/L, p = 0.006] and high-sensitive C-reactive protein (hsCRP) [0.9(0.36-2.0325) mg/Lvs.0.51(0.28-1.61) mg/L, p = 0.046] in patients from non-B antigen group comparing to that from B antigen group (Table 1).
Table 1: Baseline characteristics of IgAN patients
Variables |
Blood group |
P value |
|
|---|---|---|---|
B antigen group |
non-B antigen group |
||
Follow-up (months) |
57.75±40.49 |
57.27±41.15 |
0.86 |
Age at biopsy (years) |
36.39±11.92 |
37.09±12.5 |
0.40 |
Gender (Male: Female) |
0.74(156:210) |
1.14(294:259) |
0.002* |
eGFR (mL/min/1.73m2) |
81.28±34.68 |
72.47±33.78 |
<0.001* |
CKD stage (eGFR in mL/min/1.73m2) |
|||
1-2 (≥60) (%) |
245 (66.9%) |
329 (59.5%) |
0.001* |
3-4 (<60) (%) |
121 (33.1%) |
224 (40.5%) |
|
SBP (mm Hg) |
125.26±16.58 |
128.77±17.83 |
0.003* |
DBP (mm Hg) |
79.53±11.71 |
81.81±12.52 |
0.005* |
Hypertension (%) |
104(28.4%) |
221(40%) |
<0.001* |
Blood urea nitrogen (mg/dL) |
14.85(6.44-54.06) |
17.37(5.88-120.45) |
<0.001*# |
Serum uric acid (mg/dL) |
6.19±1.7 |
6.52±1.79 |
0.004* |
Serum albumin (g/dL) |
3.6(0.9-5) |
3.6(0.7-4.9) |
0.86 |
Hypoalbuminemia (%) |
67(18.4%) |
85(15.4%) |
0.24 |
Serum triglycerides (mg/dL) |
156.78(39.86-1140.83) |
158.1(40.74-1034.54) |
0.85# |
Serum cholesterol (mg/dL) |
192.58(32.1-512.76) |
194.7(32.1-696.83) |
0.69# |
Hemoglobin (g/dL) |
13.07±1.86 |
12.82±2.05 |
0.06 |
Anemia (%) |
136(37.3%) |
240(43.5%) |
0.06 |
WBC (103/mm3) |
7.1(3.5-19) |
7.2(3.2-22.8) |
0.52# |
N (%) |
58.90±9.32 |
59.70±10.07 |
0.23 |
L (%) |
31.90±8.61 |
31.03±9.41 |
0.17 |
Serum IgA (mg/dL) |
324(70.3-706) |
322.5(68-930) |
0.81# |
Serum C3 (mg/dL) |
103(42.7-204) |
100(55-218) |
0.09# |
LDH (IU/L) |
128(121.25-142.5) |
140.5(122.5-166.25) |
0.006*# |
hsCRP (mg/L) |
0.51(0.28-1.61) |
0.9(0.36-2.0325) |
0.046*# |
ESR (mm/h) |
13(7-22) |
14(7-23) |
0.75 |
Urine protein excretion (g/24h) |
1.04(0.03-12.7) |
1.19(0.02-13.91) |
0.09 |
Nephrotic range proteinuria (%) |
42(11.5%) |
66(11.9%) |
0.85 |
ESRD (%) |
26(7.10%) |
98(17.70%) |
<0.001* |
ACEI or ARB treatment (%) |
308(84.20%) |
471(85.20%) |
0.67 |
Glucocorticoid treatment (%) |
211(57.70%) |
309(55.90%) |
0.60 |
Oxford Classification [number/(%)] |
|||
Mesangial hypercellularity: M1 |
170(46.4%) |
236(42.7%) |
0.26 |
Endocapillary hypercellularity: E1 |
80(21.9%) |
100(18.1%) |
0.16 |
Segmental glomerulosclerosis: S1 |
286(78.1%) |
418(75.6%) |
0.37 |
Tubular atrophy/Interstitial fibrosis: T1/T2 |
89/35(24.3/9.6%) |
132/78(23.9/14.1%) |
0.12 |
Note: Data are presented as n (%) or mean±SD or median and interquartile range. eGFR: estimated glomerular filtration rate; SBP: systolic blood pressure; DBP: diastolic blood pressure; WBC: white blood cell count; Ig: immunoglobulin; C: complement; LDH: lactate dehydrogenase; ASO: Anti-Streptolysin O; TRF: transferrin;hsCRP: high-sensitive C-reactive protein; ESR: Erythrocyte Sedimentation Rate;ACEI: angiotensin converting enzyme inhibitor; ARB, angiotensin II receptor blocker;*p<0.05; #p: p value was calculated by t-test for normally distributed variables after LG conversion.
No significant differences were detected between the two groups regarding to Oxford classification and treatment strategies including glucocorticoid and ACEI/ARB (Table1).
Detection of pro-inflammatory cytokines
We also measured circulating IL-6 and TNF-α levels in 212 IgAN patients, including 128 in non-B antigen group and 84 in B antigen group. Although it was not statistically significant, the TNF-α level was higher in non-B antigen group compared to B antigen group [9.0 vs. 8.1 pg/ml]. Patients from the two groups had similar serum IL-6 levels (Table 2).
Table 2: Detection of proinflammatory cytokines of IgAN
Variables |
Blood group |
P value |
|
|---|---|---|---|
B antigen group (n = 84) |
non-B antigen group (n = 128) |
||
IL-6 (pg/ml) |
2.8(1.9-4.6) |
2.7(1.9-6.2) |
0.51# |
TNF-α (pg/ml) |
8.1(6.2-10.4) |
9.0(6.5-12.8) |
0.09# |
Note: IL: interleukin; TNF: tumor necrosis factor; #p: p value was calculated byt-test for normally distributed variables after LG conversion.
Renal outcomes
After a median follow-up period of 57.46 months, totally 124 (13.5%) IgAN patients progressed to ESRD, including 42(16.7%) type A, 23(8.4%) type B, 3(3.2%) type AB and 56(18.6%) type O patients. The ESRD rate was more than two times higher in non-B antigen group (17.7%) compared to B antigen group (7.1%). Kaplan-Meier analysis showed that median ESRD-free time of patients from non-B antigen group was significantly shorter than patients from B antigen group [143.09±6.38 vs 159.05±4.94 months, n < 0.001] (Figure 1A). Furthermore, the association between non-B antigen group and worse renal outcomes was independent to different CKD stages (Figure 1B-1C).
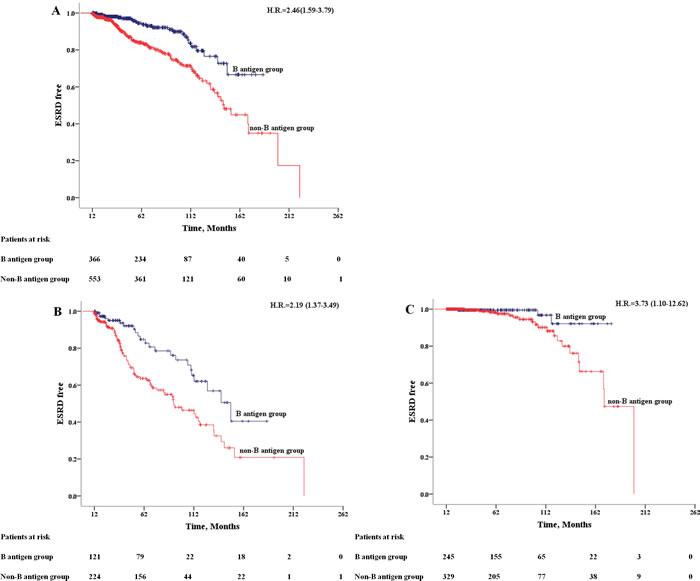
Figure 1: Kaplan-Meier Outcome-free Survival Curves. Patients from B antigen group (dark blue); patients from non-B antigen group (red). A. All patients; B. patients in CKD 3-4 stage (eGFR < 60 ml/min/m2); C. patients in CKD 1-2 stage (eGFR >= 60 ml/min/m2).
By COX regression analysis, non-B antigen group were associated with an increased risk of ESRD (HR = 2.46, 95%CI 1.59-3.79) (Table 3). We took all the statistically significant variables from univariate cox analysis into multivariate cox regression proportional hazards models. The association remains robust after adjusted by age, sex and clinical indicators (SBP, eGFR, blood urea nitrogen, hypoalbuminemia, uric acid, serum triglycerides, hemoglobin, serum C3, urine protein, Oxford Classification T and glucocorticoid treatment) (HR = 2.21, 95%CI 1.35-3.62) (Table 3).
Table 3: Univariate and Multivariate Cox Regression analyses of baseline variables with renal outcome for ESRD.
Variable (n=919) |
Univariate Cox |
Multivariate Cox |
||
|---|---|---|---|---|
HR (95%CI) |
P value |
HR (95%CI) |
P-value |
|
Age at biopsy (years) |
1.01(0.99-1.02) |
0.42 |
0.98(0.96-0.99) |
0.01* |
Gender (Male) |
1.67(1.17-2.41) |
0.005* |
1.86(1.15-3.00) |
0.01* |
eGFR (mL/min/1.73m2) |
0.96(0.95-0.96) |
<0.001* |
0.97(0.96-0.98) |
<0.001* |
SBP (mm Hg) |
1.02(1.01-1.03) |
<0.001* |
1.00(0.99-1.01) |
0.83 |
DBP (mm Hg) |
1.03(1.02-1.04) |
<0.001* |
-- |
-- |
Blood urea nitrogen (mg/dL) |
1.07(1.06-1.08) |
<0.001* |
1.02(0.99-1.05) |
0.14 |
Serum uric acid (mg/dL) |
1.52(1.40-1.66) |
<0.001* |
1.07(0.92-1.24) |
0.37 |
Serum albumin (g/dL) |
0.61(0.49-0.76) |
<0.001* |
-- |
-- |
Hypoalbuminemia (%) |
2.07(1.34-3.18) |
0.001* |
2.15(1.20-3.83) |
0.01* |
Serum triglycerides (mg/dL) |
1.001(1-1.002) |
0.02* |
1.001(1-1.002) |
0.07 |
Serum cholesterol (mg/dL) |
1.001(0.998-1.004) |
0.49 |
-- |
-- |
Hemoglobin (g/dL) |
0.75(0.70-0.82) |
<0.001* |
0.88(0.78-0.98) |
0.02* |
WBC (103/mm3) |
0.93(0.86-1.02) |
0.12 |
-- |
-- |
Serum IgA (mg/dL) |
1.001(0.999-1.002) |
0.48 |
-- |
|
Serum C3 (mg/dL) |
0.99(0.98-1.00) |
0.005* |
1(0.99-1.01) |
0.92 |
Urine protein excretion (g/24h) |
1.16(1.09-1.23) |
<0.001* |
-- |
-- |
Nephrotic range proteinuria (%) |
2.40(1.55-3.74) |
<0.001* |
0.77(0.44-1.37) |
0.38 |
Blood group (nonB-antigen) |
2.46(1.59-3.79) |
<0.001* |
2.21(1.35-3.62) |
0.002* |
Oxford Classification: M1 |
0.74(0.52-1.06) |
0.11 |
-- |
-- |
Oxford Classification: E1 |
0.95(0.57-1.59) |
0.85 |
-- |
-- |
Oxford Classification: S1 |
1.31(0.86-1.99) |
0.21 |
-- |
-- |
Oxford Classification: T(1 increase) |
2.64(2.12-3.29) |
<0.001* |
2.01(1.49-2.70) |
<0.001* |
Oxford Classification: T1 |
2.12(1.36-3.32) |
0.001* |
-- |
-- |
Oxford Classification: T2 |
7.30(4.75-11.21) |
<0.001* |
-- |
-- |
ACEI or ARB treatment |
1.08(0.63-1.86) |
0.78 |
-- |
-- |
Glucocorticoid treatment |
0.44(0.30-0.64) |
<0.001* |
0.61(0.37-0.995) |
0.048* |
Note: Data are reported as hazard ratios (HRs) and 95% confidence intervals (CIs) ;*p<0.05.
DISCUSSION
IgAN is the most common glomerulonephritis worldwide [3]. It is also the leading cause of ESRD in China [7]. The clinical presentations and renal outcomes of IgAN are highly variable. Although dozens of risk factors have been reported, among which proteinuria, GFR and blood pressure were the most validated ones, it is still unsatisfied for clinicians to precise identify IgAN patients with high risk of progression and need be intensively treated at the time of renal biopsy. Therefore, identification of new risk factors of IgAN is crucial to improve this situation. Previous studies suggested that ABO blood antigens played an important role in infections and host inflammatory status which has been largely implicated in the onset and progression of immune-mediated diseases. In this study, we evaluated the predictive value of ABO blood group to renal outcomes based on an extended Chinese IgAN cohort with more than twenty baseline clinical parameters and long follow-up period. By COX regression analysis, we identify ABO blood type is a new risk factor for progression of IgAN. Patients with blood type O or A had a higher risk for renal function deterioration than patients with blood type B or AB, and the association is independent to age, sex, SBP, baseline eGFR, blood urea nitrogen, hypoalbuminemia, uric acid, serum triglycerides, hemoglobin, serum C3, urine protein, Oxford Classification and glucocorticoid treatment.
Infections and inflammatory status have been largely implicated in the onset and progression of immune-mediated diseases. Several mechanism have been uncovered how infectious agents including viruses, bacteria, fungi and parasites trigger immune-mediated diseases [25-27]. It has been reported that the infection, immune system and inflammatory response played a pivotal role in the pathogenesis, clinical manifestations and outcomes of IgAN [8, 30, 31]. The evidences became even stronger after the release of GWAS studies on IgAN which linked intestinal mucosal inflammatory disorders to onset of IgAN [32].
ABO blood group was firstly found to be associated with the mortality of CKD patients in a Canadian study based on 8,432 ESRD patients in 1989 [33]. In this study, the authors reported that patients with blood type AB had a clear but not statistically significant decreased risk of death. The authors explained this finding partly on that patients with blood type AB had higher likelihood of receiving a transplant. Besides, individuals with blood group A were reported to have a higher risk for H. pylori infection, chronic atrophic gastritis, gastric cancer and suffered more refractory iron deficiency anemia than individuals with other blood groups [34, 35]. Furthermore, individuals with blood group O was found to had higher risk to peptic ulceration due to an increasing density of colonization of epithelial cells and higher inflammatory responses (release of IL-6, IL-10 and TNF-α) to H. pylori. [21]. The mechanisms for the association between ABO blood type and inflammatory responses to infection have been partly uncovered. A and B antigens can be recognized as receptors for pathogens, affecting host-pathogen interactions and diseases susceptibility among individuals with different glycosylation profiles [36]. Genetic studies revealed ABO blood type was a major genetic determinant of circulation glycoprotein levels which were important in endothelial function and inflammation. These glycoproteins includs soluble intercellular adhesion molecule-1 (sICAM-1), selectins, von Willebrand factor (vWF), thrombomodulin and TNF-α [37-42]. Previous studies found increasing levels of IL-6, TNF-α and hsCRP were common in CKD patients and hsCRP was associated with progression of IgAN [43-45]. Based on these evidences, we hypothesized that it was possible that ABO blood group influenced the prognosis of IgAN via affecting inflammatory status of these patients. In our study, LDH and hsCRP were significantly elevated in non-B antigen group indicated increase of the inflammatory status. Elevation of serum LDH was regarded as an indicator of cell injury and inflammation [46]. Furthermore, although it was not significant, we found TNF-α level was also elevated in non-B antigen group compared to B antigen group. Based on these data, we assumed that ABO blood group might influence IgAN progression by its potential roles on inflammation.
In addition to ABO blood type, we also found younger male IgAN patients with lower eGFR, serum albumin, hemoglobin, and more severe tubular atrophy/interstitial fibrosis held a higher risk to progress to ESRD in IgAN patients. Interestingly, urine protein excretion did not contribute to the risk of progression in our multivariate models. The reason for this might due to its strong correlation with serum albumin and most of its variance in outcome was captured by serum albumin.
There were several limitations of our study. Firstly, the baseline characteristics between patients in B antigen group and non-B antigen group were not perfect balance. The imbalance baseline status could be partly explained by its retrospective study design. To resolve this issue we used a fully adjusted COX regression model and performed subgroup analysis by stratified patients by CKD stages. Secondly, part of patients recruited in this study didn’t have chances to measure their serum inflammatory factors because serum samples of these patients were not available.
CONCLUSION
In conclusion, our study firstly identified that ABO blood group is a new risk factor for IgAN progression which may be explained by influencing patient’s inflammatory status. Compare to patients with blood type B/AB, patients with blood type O/A have an increased risk for disease progression of IgAN. Since ABO blood group is stable through lifetime and is one of the most readily available laboratory tests for most patients. It may represent an ideal marker for clinicians to predict disease progression. The prognostic value of ABO blood group must be further validated and its biological explanation should be elucidated.
MATERIALS AND METHODS
Participants
All IgAN patients recruited in this study were diagnosed and followed up in Shanghai Ruijin Hospital, Shanghai Jiao Tong University School of Medicine. The inclusion criteria were as follow: 1) IgAN was defined by dominant and at least 2+ (on a scale from 0 to 3+) mesangial staining for IgA by immunofluorescence in combination with compatible findings on light microscopy [47]; 2) Age between 10 to 75 years old; 3) eGFR≥15ml/min/1.73m2 at the time of biopsy; 4) Minimum follow-up of 12 months; 5) Signed informed consent. Exclusion criteria included: 1) A secondary cause of IgA was suspected, especially patients with systemic diseases; 2) Clinical and follow-up data was incomplete; 3) Patients received any immune-suppression treatment before renal biopsy. This study was in accordance with the principle of the Helsinki Declaration II. The study protocol was approved by the Institutional Review Board of Ruijin Hospital, Shanghai Jiao Tong University School of Medicine and written informed consent was obtained from each participant.
Clinical characteristics
Baseline demographic, clinical and laboratory data were collected from all patients at the time of renal biopsy. ABO histo-blood group was determined by using standard erythrocyte antiserum agglutination methods. Histological changes were evaluatedand semi-quantitative scored according to the Oxford scoring system by experienced pathologists [48].
Estimated glomerular filtration rate (eGFR) was evaluated by The Chronic Kidney Disease Epidemiology Collaboration (CKD-EPI) Equation [49]: eGFR [ml/min/1.73m2] = 141 × min(Scr/κ, 1)α × max(Scr/κ, 1)-1.209 × 0.993Age × 1.018 [if female] _ 1.159 [if black], where Scr is serum creatinine (mg/dL), κ is 0.7 for females and 0.9 for males, α is -0.329 for females and -0.411 for males, min indicates the minimum of Scr/κ or 1, and max indicates the maximum of Scr/κ or 1. Chronic kidney disease (CKD) was classified based to the Kidney Disease Outcomes Quality Initiative (K/DOQI) practice guidelines [50]. Hypertension was defined as SBP≥140 mmHg or DBP≥90 mmHg (at least 2 times in different environments) or having a history of antihypertensive medication. Hypoalbuminemia was defined by serum albumin<3 g/dL. Anemia was defined by gender-specific criteria of hemoglobin concentrations<13.5 g/dL in males or<12 g/dL in females. Nephrotic range proteinuria was defined by proteinuria ≥ 3.5 g/24h. IgAN patients with hypertension (SBP≥140 mmHg or DBP≥90 mmHg) and/or proteinuria higher than 0.5g/day were treated with ACE inhibitors (ACEI) and/or angiotensin receptor blockers (ARB). Glucocortoid therapy was used if patients who did not respond to an ACEI or ARB therapy (urinary protein excretion of >1 g/day continued after 3 to 6 month therapy). Combination of immunosuppressive agents and glucocorticoids were used if patients had rapid progressing glomerulonephritis.
Study end points
The study endpoint was ESRD defined as eGFR<15ml/min/1.73m2 or need renal replacement therapy (dialysis or renal transplantation). Patients were censored at the time of death or ESRD or loss of follow-up.
Detection of circulating interleukin-6 (IL-6) and tumor necrosis factor-α (TNF-α) levels
5ml venous bloodwas collected from IgAN patients on the morning of renal biopsy. Plasma was extracted and divided into aliquots. The serum samples were stored at -80°C fridge until they were tested. IL-6 and TNF-αlevels were measured by a sequential solid phase chemiluminescent assay performed by IMMULITE 1000 Analyzer (Siemens Medical Solutions Diagnostics) using corresponding kits by professionals according to the manufacturer’s instructions. The kits were purchased from SIEMENS (IMMULITE 1000 IL-6/ TNF-α).
Statistical analyses
Statistical analysis was performed using SPSS version 17.0 (SPSS Inc., Chicago, Illinois, USA). The distributions of quantitative variables were assessed for normality. Continuous data were expressed as mean ± standard deviation (SD) (normally distributed variables) or median and interquartile range (non-normally distributed variables). Student t-test (normally distributed variables) or Mann–Whitney test (non-normally distributed variables) were used when compared with two groups. Categorical data were expressed as frequencies and percentages (%) and compared by using a standard chi-squared test. Probabilities of cumulative renal survival curves were generated by the Kaplan-Meier method, and log-rank test was used when comparing survival time between two groups (Figure 2). Univariate and multivariate Cox regression proportional hazards models were builtto evaluate independent risk factors of ESRD. The results of Cox regressionanalyses were expressed as hazard ratios (HRs) with 95% confidence intervals (CIs). In all analyses, a two sided P < 0.05 was considered as statistically significant.
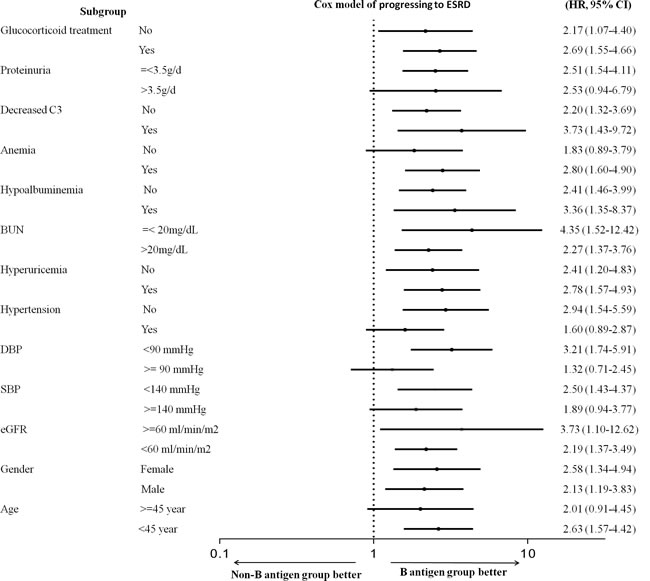
Figure 2: Stratified Cox model of progressing to ESRD (non-B antigen group vs B antigen group). Log-scale plot of hazard ratios (HRs) and 95% CIs for disease progression.
ACKNOWLEDGMENTS
The corresponding authors, on behalf of all authors, declare that written permission has been obtained from all individuals.
CONFLICTS OF INTEREST
No Conflict of interest.
GRANT SUPPORT
This work was supported by grants from National Key Research and Development Program of China (2016YFC0904100), National Basic Research Program of China 973 (No.2012CB517604, No.2012CB517701), Shanghai Jiao Tong University School of Medicine Multi Center Clinical Study Program (DLY201510), National Natural Science Foundation of China (No.81570598, 81000295,81370015). International Cooperation and Exchange Projects of Shanghai Science and Technology Commettee (No.14430721000), Shanghai Municipal Education Commission, Gaofeng Clinical Medicine Grant Support (20152207), National Key Technology R&D Program (12-5)(No.2011BAI10B06).
REFERENCES
1. Nationwide and long-term survey of primary glomerulonephritis in Japan as observed in 1,850 biopsied cases. Research Group on Progressive Chronic Renal Disease. Nephron. 1999; 82:205-213.
2. Li LS, Liu ZH. Epidemiologic data of renal diseases from a single unit in China: analysis based on 13,519 renal biopsies. Kidney Int. 2004; 66:920-923.
3. Zhou FD, Zhao MH, Zou WZ, Liu G, Wang H. The changing spectrum of primary glomerular diseases within 15 years: a survey of 3331 patients in a single Chinese centre. Nephrol Dial Transplant. 2009; 24:870-876.
4. Berger J, Hinglais N. [Intercapillary deposits of IgA-IgG]. J Urol Nephrol (Paris). 1968; 74:694-695.
5. Alamartine E, Sabatier JC, Guerin C, Berliet JM, Berthoux F. Prognostic factors in mesangial IgA glomerulonephritis: an extensive study with univariate and multivariate analyses. Am J Kidney Dis. 1991; 18:12-19.
6. Schena FP. A retrospective analysis of the natural history of primary IgA nephropathy worldwide. Am J Med. 1990; 89:209-215.
7. Le W, Liang S, Hu Y, Deng K, Bao H, Zeng C, Liu Z. Long-term renal survival and related risk factors in patients with IgA nephropathy: results from a cohort of 1155 cases in a Chinese adult population. Nephrol Dial Transplant. 2012; 27:1479-1485.
8. Suzuki H, Fan R, Zhang Z, Brown R, Hall S, Julian BA, Chatham WW, Suzuki Y, Wyatt RJ, Moldoveanu Z, Lee JY, Robinson J, Tomana M, et al. Aberrantly glycosylated IgA1 in IgA nephropathy patients is recognized by IgG antibodies with restricted heterogeneity. J Clin Invest. 2009; 119:1668-1677.
9. Xie J, Kiryluk K, Wang W, Wang Z, Guo S, Shen P, Ren H, Pan X, Chen X, Zhang W, Li X, Shi H, Li Y, et al. Predicting progression of IgA nephropathy: new clinical progression risk score. PLoS One. 2012; 7:e38904.
10. Moriyama T, Tanaka K, Iwasaki C, Oshima Y, Ochi A, Kataoka H, Itabashi M, Takei T, Uchida K, Nitta K. Prognosis in IgA nephropathy: 30-year analysis of 1,012 patients at a single center in Japan. PLoS One. 2014; 9:e91756.
11. Kim SJ, Koo HM, Lim BJ, Oh HJ, Yoo DE, Shin DH, Lee MJ, Doh FM, Park JT, Yoo TH, Kang SW, Choi KH, Jeong HJ, et al. Decreased circulating C3 levels and mesangial C3 deposition predict renal outcome in patients with IgA nephropathy. PLoS One. 2012; 7:e40495.
12. Landsteiner K. Zur Kenntnis der antifermentativen luaWdBudL. Zbl Bakterial. 1900; 27:357-62.
13. Franchini M, Liumbruno GM. ABO blood group: old dogma, new perspectives. Clin Chem Lab Med. 2013; 51:1545-1553.
14. Liumbruno GM, Franchini M. Beyond immunohaematology: the role of the ABO blood group in human diseases. Blood Transfus. 2013; 11:491-499.
15. Eastlund T. The histo-blood group ABO system and tissue transplantation. Transfusion. 1998; 38:975-988.
16. Yamamoto F, McNeill PD, Hakomori S. Genomic organization of human histo-blood group ABO genes. Glycobiology. 1995; 5:51-58.
17. Qi L, Cornelis MC, Kraft P, Jensen M, van Dam RM, Sun Q, Girman CJ, Laurie CC, Mirel DB, Hunter DJ, Rimm E, Hu FB. Genetic variants in ABO blood group region, plasma soluble E-selectin levels and risk of type 2 diabetes. Hum Molec Genet. 2010; 19:1856-1862.
18. Heit JA, Armasu SM, Asmann YW, Cunningham JM, Matsumoto ME, Petterson TM, De Andrade M. A genome-wide association study of venous thromboembolism identifies risk variants in chromosomes 1q24.2 and 9q. J Thromb Haemost. 2012; 10:1521-1531.
19. Chen K, Ma H, Li L, Zang R, Wang C, Song F, Shi T, Yu D, Yang M, Xue W, Dai J, Li S, Zheng H, et al. Genome-wide association study identifies new susceptibility loci for epithelial ovarian cancer in Han Chinese women. Nat Commun. 2014; 5:4682.
20. Garratty G. Do blood groups have a biological role. Immunobiology of Transfusion Medicine. Marcel Dekker, 1993; pp 201-255.
21. Alkout AM, Blackwell CC, Weir DM. Increased inflammatory responses of persons of blood group O to Helicobacter pylori. J Infect Dis. 2000; 181:1364-1369.
22. Garratty G. Blood group antigens as tumor markers, parasitic/bacterial/viral receptors, and their association with immunologically important proteins. Immunol Invest. 1995; 24:213-232.
23. Telen MJ. Erythrocyte blood group antigens: not so simple after all. Blood. 1995; 85:299-306.
24. Cartron JP, Bailly P, Le Van Kim C, Cherif-Zahar B, Matassi G, Bertrand O, Colin Y. Insights into the structure and function of membrane polypeptides carrying blood group antigens. Vox Sang. 1998; 74 Suppl 2:29-64.
25. Vojdani A. A Potential Link between Environmental Triggers and Autoimmunity. Autoimmune Dis. 2014; 2014:437231.
26. Munz C, Lunemann JD, Getts MT, Miller SD. Antiviral immune responses: triggers of or triggered by autoimmunity? Nat Rev Immunol. 2009; 9:246-258.
27. Kivity S, Agmon-Levin N, Blank M, Shoenfeld Y. Infections and autoimmunity—friends or foes? Trends Immunol. 2009; 30:409-414.
28. Maeda I, Hayashi T, Sato KK, Shibata MO, Hamada M, Kishida M, Kitabayashi C, Morikawa T, Okada N, Okumura M, Konishi M, Konishi Y, Endo G, et al. Tonsillectomy has beneficial effects on remission and progression of IgA nephropathy independent of steroid therapy. Nephrol Dial Transplant. 2012; 27:2806-2813.
29. De Angelis M, Montemurno E, Piccolo M, Vannini L, Lauriero G, Maranzano V, Gozzi G, Serrazanetti D, Dalfino G, Gobbetti M, Gesualdo L. Microbiota and metabolome associated with immunoglobulin A nephropathy (IgAN). PLoS One. 2014; 9:e99006.
30. Maillard N, Wyatt RJ, Julian BA, Kiryluk K, Gharavi A, Fremeaux-Bacchi V, Novak J. Current Understanding of the Role of Complement in IgA Nephropathy. J Am Soc Nephrol. 2015;26:1503-12.
31. Rollino C, Vischini G, Coppo R. IgA nephropathy and infections. J Nephrol. 2016; 29:463-468.
32. Kiryluk K, Li Y, Scolari F, Sanna-Cherchi S, Choi M, Verbitsky M, Fasel D, Lata S, Prakash S, Shapiro S, Fischman C, Snyder HJ, Appel G, et al. Discovery of new risk loci for IgA nephropathy implicates genes involved in immunity against intestinal pathogens. Nat Genet. 2014; 46:1187-1196.
33. Silins J, Fortier L, Mao Y, Posen G, Ugnat AM, Brancker A, Gaudette L, Wigle D. Mortality rates among patients with end-stage renal disease in Canada, 1981-86. CMAJ. 1989;141:677-82.
34. Nakao M, Matsuo K, Ito H, Shitara K, Hosono S, Watanabe M, Ito S, Sawaki A, Iida S, Sato S, Yatabe Y, Yamao K, Ueda R, et al. ABO genotype and the risk of gastric cancer, atrophic gastritis, and Helicobacter pylori infection. Cancer Epidemiol Biomarkers Prev. 2011; 20:1665-1672.
35. Wang Z, Zhang L, Guo Z, Liu L, Ji J, Zhang J, Chen X, Liu B, Zhang J, Ding Q, Wang X, Zhao W, Zhu Z, Yu Y. A unique feature of iron loss via close adhesion of Helicobacter pylori to host erythrocytes. PLoS One. 2012; 7:e50314.
36. Yamamoto F, Cid E, Yamamoto M, Blancher A. ABO research in the modern era of genomics. Transfus Med Rev. 2012; 26:103-118.
37. Barbalic M, Dupuis J, Dehghan A, Bis JC, Hoogeveen RC, Schnabel RB, Nambi V, Bretler M, Smith NL, Peters A, Lu C, Tracy RP, Aleksic N, et al. Large-scale genomic studies reveal central role of ABO in sP-selectin and sICAM-1 levels. Hum Molec Genet. 2010; 19:1863-1872.
38. Paterson AD, Lopes-Virella MF, Waggott D, Boright AP, Hosseini SM, Carter RE, Shen E, Mirea L, Bharaj B, Sun L, Bull SB, Diabetes Control and Complications Trial/Epidemiology of Diabetes Interventions and Complications Research Group. Genome-wide association identifies the ABO blood group as a major locus associated with serum levels of soluble E-selectin. Arterioscler Thromb Vasc Biol. 2009; 29:1958-1967.
39. Kiechl S, Pare G, Barbalic M, Qi L, Dupuis J, Dehghan A, Bis JC, Laxton RC, Xiao Q, Bonora E, Willeit J, Xu Q, Witteman JC, et al. Association of variation at the ABO locus with circulating levels of soluble intercellular adhesion molecule-1, soluble P-selectin, and soluble E-selectin: a meta-analysis. Circ Cardiovasc Genet. 2011; 4:681-686.
40. Franchini M, Capra F, Targher G, Montagnana M, Lippi G. Relationship between ABO blood group and von Willebrand factor levels: from biology to clinical implications. Thrombos J. 2007; 5:14.
41. Blann AD, Daly RJ, Amiral J. The influence of age, gender and ABO blood group on soluble endothelial cell markers and adhesion molecules. Br J Haemotol. 1996; 92:498-500.
42. Melzer D, Perry JR, Hernandez D, Corsi AM, Stevens K, Rafferty I, Lauretani F, Murray A, Gibbs JR, Paolisso G, Rafiq S, Simon-Sanchez J, Lango H, et al. A genome-wide association study identifies protein quantitative trait loci (pQTLs). PLoS Genet. 2008; 4:e1000072.
43. Pereira BJ, Shapiro L, King AJ, Falagas ME, Strom JA, Dinarello CA. Plasma levels of IL-1 beta, TNF alpha and their specific inhibitors in undialyzed chronic renal failure, CAPD and hemodialysis patients. Kidney Int. 1994; 45:890-896.
44. Stenvinkel P, Ketteler M, Johnson RJ, Lindholm B, Pecoits-Filho R, Riella M, Heimburger O, Cederholm T, Girndt M. IL-10, IL-6, and TNF-alpha: central factors in the altered cytokine network of uremia—the good, the bad, and the ugly. Kidney Int. 2005; 67:1216-1233.
45. Kaartinen K, Syrjanen J, Porsti I, Hurme M, Harmoinen A, Pasternack A, Huhtala H, Mustonen J. Inflammatory markers and the progression of IgA glomerulonephritis. Nephrol Dial Transplant. 2008; 23:1285-1290.
46. Drent M, Cobben NA, Henderson RF, Wouters EF, van Dieijen-Visser M. Usefulness of lactate dehydrogenase and its isoenzymes as indicators of lung damage or inflammation. Eur Respir J. 1996; 9:1736-1742.
47. Wyatt RJ, Julian BA. IgA nephropathy. N Engl J Med. 2013; 368:2402-2414.
48. Cattran DC, Coppo R, Cook HT, Feehally J, Roberts IS, Troyanov S, Alpers CE, Amore A, Barratt J, Berthoux F, Bonsib S, Bruijn JA, D’Agati V, et al; Working Group of the International IgA Nephropathy Network and the Renal Pathology Society. The Oxford classification of IgA nephropathy: rationale, clinicopathological correlations, and classification. Kidney Int. 2009; 76:534-545.
49. Levey AS, Stevens LA, Schmid CH, Zhang YL, Castro AF 3rd, Feldman HI, Kusek JW, Eggers P, Van Lente F, Greene T, Coresh J, CKD-EPI (Chronic Kidney Disease Epidemiology Collaboration). A new equation to estimate glomerular filtration rate. Ann Intern Med. 2009; 150:604-612.
50. National Kidney Foundation. K/DOQI clinical practice guidelines for chronic kidney disease: evaluation, classification, and stratification. Am J Kidney Dis. 2002; 39:S1-266.