
INTRODUCTION
Ankylosing spondylitis (AS) is a common chronic autoimmune disease characterized by axial skeleton arthritis and enthesitis [1]. Axial skeleton impairment and hypofunction decrease social and working ability of patients and make them suffering. Previous studies have shown that single nucleotide polymorphisms (SNPs) associated with the development of AS. Identification of genes underlying AS is vital to our understanding of its etiology and helpful for prophylaxis, diagnosis and treatment of AS [2, 3].
Disarrangement of immune homeostasis can induce development of autoimmune disease. Cytokines and their pathways are important for maintaining immune homeiostasis [4]. Tumor necrosis factor receptor superfamily (TNFRSF) member herpes virus entry mediator (HVEM, also known as TNFRSF14) is a very special cytokine [5]. HVEM regulates immune response of T-cell in both stimulatory and inhibitory signaling pathways by combining with different ligands. Experimental mouse models and human diseases have indicated the correlation between dysregulation of HVEM network and autoimmune pathogenesis. HVEM is now considered as an attractive target for drug intervention. LIGHT(lymphotoxin exhibits inducible expression and competes with herpes simplex virus glycoprotein D for HVEM, a receptor expressed on T lymphocytes)acts as a ligand and binds to HVEM to stimulate inflammation [6, 7], whereas the engagement between HVEM and B and T lymphocyte attenuator (BTLA), a member of the immunoglobulin superfamily, mediates inhibitory signaling pathway [8].
As long as the exact mechanism of the genetic susceptibility to AS has not been fully discovered, development of AS will not be completely understood. SNP, a bi-allelic type of marker used in genetic studies with autofrequency, has been proved its efficacy in testifying the genetic susceptibility to diseases in recent years [9–11]. We chose three SNPs in LIGHT and BTLA to figure out whether they have any impact on the susceptibility to AS.
Above all, our study aimed to investigate the correlation between AS and three SNPs, rs2171513 C>T in BTLA, rs1077667 G>A and rs12609318 A>G in LIGHT in a Chinese Han population.
RESULTS
Demographic data
Population stratification and sampling bias in patients and controls were not in HWE (p< 0.05), but matches up with the data shown in HapMap. The mean ages of patients and controls were 33.1 ± 11.3 (range 10 to 74) years old and 37.8 ± 14.3 (range 13 to 77) years old, respectively. Males account for 69% (342/497) of patients and females 31% (155/497) for patients and 69% (266/387) are male and 31% (121/387) are female for controls. Age and gender does not have any significant difference between patients and controls (p = 0.811 and 0.979931 respectively) (Table 1) [12].
Table 1: Clinical characteristics of patients and controls
Characteristics |
Healthy controls |
AS patients |
p |
|---|---|---|---|
Gender (male : female) |
266 :121 |
342 : 155 |
0.979931 |
Age (years) |
37.84 ± 14.31 |
33.10 ± 11.27 |
0.811 |
CRP (mg/L) |
--- |
20.66(2.89, 24.60) |
|
WBC (109/L) |
--- |
7.66 ± 2.00 |
|
RBC (1012/L) |
--- |
4.92 ± 0.60 |
|
PLT (109/L) |
--- |
252 ± 95 |
|
C3(g/L) |
--- |
1.10 ± 0.28 |
|
C4(g/L) |
--- |
0.25 ± 0.09 |
|
MONO# (109/L) |
--- |
0.43 ± 0.16 |
|
LYMPH#(109/L) |
--- |
2.00 ± 0.61 |
|
NEUT#(109/L) |
--- |
4.98 ± 1.77 |
|
CRP: C-reactive protein, WBC: white blood cell, RBC: red blood cell, PLT: platelet, MONO#: monocyte, LYMPH#: lymphocyte, NEUT#: neutrophil, C3: complement 3, C4: complement 4.
The data are presented as mean ± SD.
p< 0.05 is considered of statistical significance.
Determination of rs2171513, rs1077667 and rs12609318 genotypes
Representative sequencing results are shown in Figures 1-3. Three genotype melting profiles of each SNP (rs2171513, rs1077667 and rs12609318) were clearly distinguished from the normalized melting curves. Additional PCR products were randomly selected from each of the three genotype melting profiles (Figure 4).
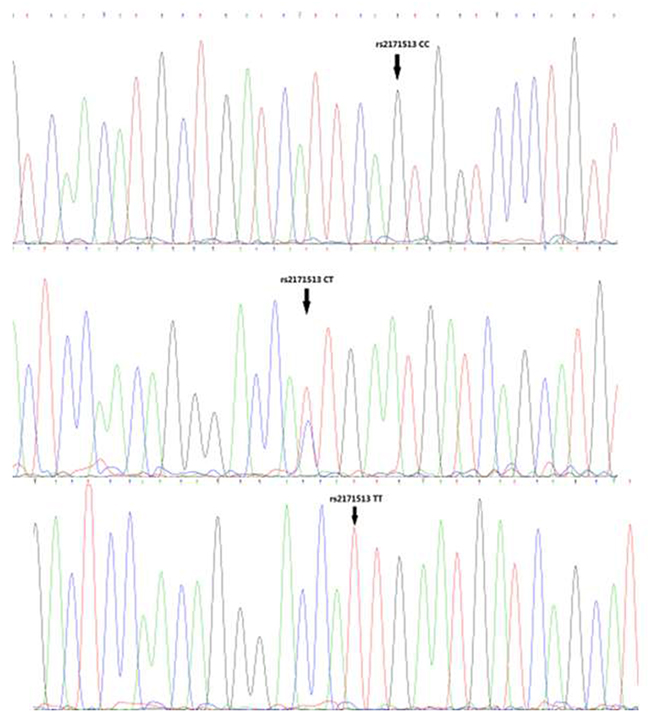
Figure 1: Representative sequencing results of rs2171513.
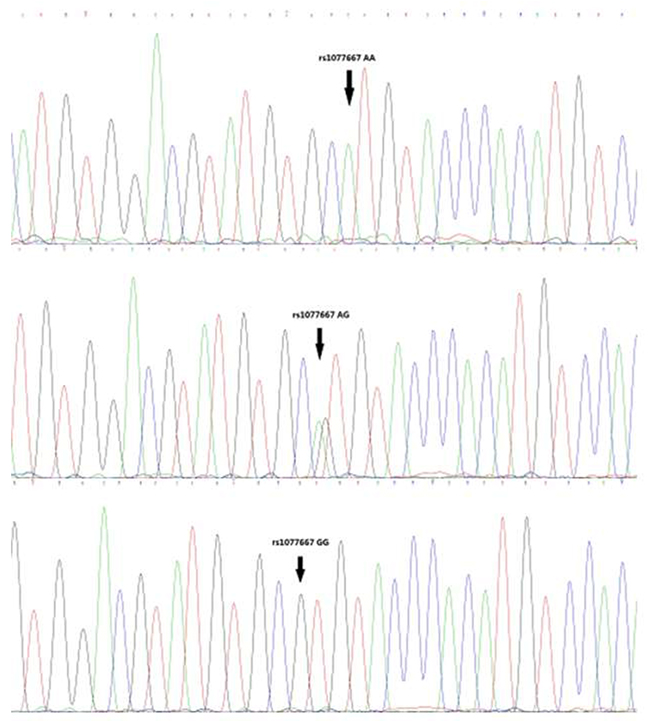
Figure 2: Representative sequencing results of rs1077667.
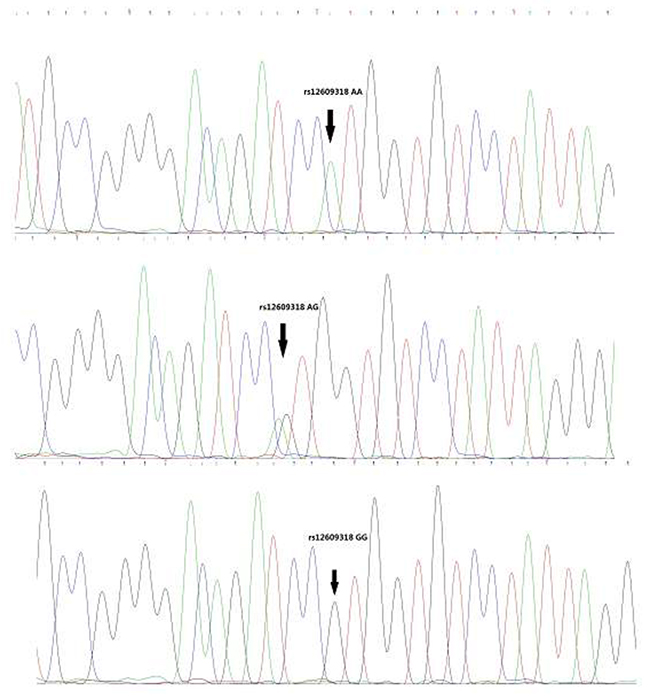
Figure 3: Representative sequencing results of rs12609318.
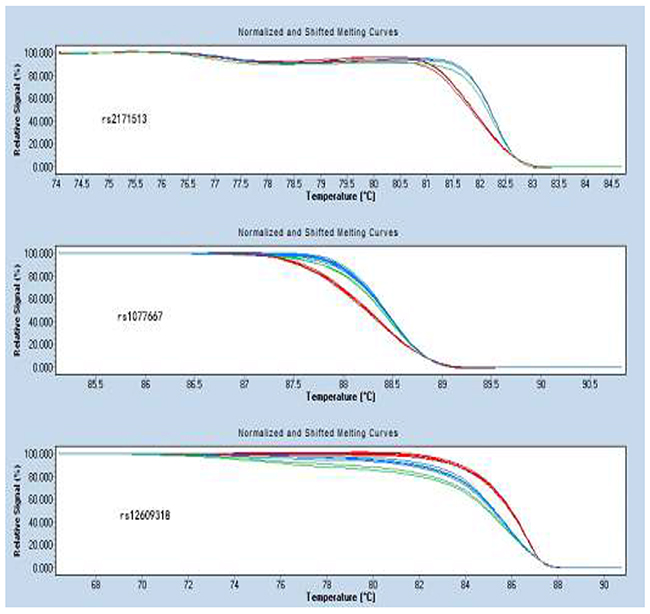
Figure 4: Normalized and shifted melting curves of rs2171513, rs1077667 and rs12609318.
rs1077667 has association with the susceptibility to AS in both genotype and allele
Association was found between genotypes of rs1077667 and susceptibility to AS(p=4.00E-06, power = 98%). The frequency of AA genotype is significantly lower in controls than that in AS patients [OR (95% CI) = 0.578 (0.460-0.726)]. As for alleles, the frequency of A allele ofrs1077667 is lower in the controls (controls vs. patients 37.1% vs. 50.1%, p =4.59E-08, OR=0.740, 95%CI=[0.663, 0.827]) (Table 2).
Table 2: Genotype and allele distributions of rs2171513, rs1077667, and rs12609318
Parameter |
Controls (n = 387) |
AS patients (n = 497) |
p-value |
OR (95%CI) |
|---|---|---|---|---|
rs2171513 C/T |
||||
HWE |
0.003 |
5.99678E-07 |
|
|
Genotype |
||||
CC |
217(56.07%) |
256 |
0.114 |
1.00 |
CT |
130(33.59%) |
167 |
NS |
0.949(0.793- 1.136) |
TT |
40(10.34%) |
74 |
|
0.694(0.490 - 0.983) |
alleles |
||||
C |
564 |
679 |
0.037 |
1.00 |
T |
210 |
315 |
|
0.856 (0.739 - 0.992) |
rs1077667 G>A |
||||
HWE |
0.0006 |
4.00E-06 |
|
|
Genotype |
||||
GG |
169(43.67%) |
154 |
0.000004 |
1.00 |
GA |
149(38.50%) |
188 |
|
0.852 (0.733 - 0.992) |
AA |
69(17.83%) |
155 |
|
0.578 (0.460 - 0.726) |
alleles |
||||
G |
487 |
496 |
4.59E-08 |
1.00 |
A |
287 |
498 |
|
0.740 (0.663 - 0.827) |
rs12609318 A>G |
||||
HWE |
0.001 |
0.097 |
|
|
Genotype |
||||
AA |
92(23.77%) |
115 |
0.146 |
1.00 |
GA |
228(58.91%) |
267 |
|
1.019 (0.926 - 1.122) |
GG |
67(17.31%) |
115 |
|
0.843 (0.674 - 1.054) |
alleles |
||||
A |
412 |
497 |
0.178 |
1.00 |
G |
362 |
497 |
|
0.935 (0.848 - 1.031) |
p< 0.05 is considered of statistical significance.
T allele of rs2171513 associated with susceptibility to AS
The dominant model of rs2171513 (CC + CT vs. TT) showed significant difference between patients and controls(p = 0.045, OR=1.053, 95%CI =[1.002, 1.107], power = 83%) and less T allele exists in patients (27.13% vs. 31.69%, p = 0.037, OR = 0.856, 95%CI=[0.739, 0.992]). However, no significant difference was found in the distribution of genotype (p = 0.114) or recessive model (p = 0.48) (Tables 2 and 6).
The GG genotype of rs12609318 relates with the onset of AS
The dominant model of rs12609318 showed significant difference between patients and controls(p = 0.034, OR = 1.076, 95%CI [1.007, 1.150], power = 48%), though neither genotype nor allele showed statistically significant difference (p = 0.146 and 0.178, respectively) (Tables 2 and 6).
Clinical indexes of AS patients
AS patients were divided into three groups according to the three genotypes of each SNP. All the clinical indexes including C-reactive protein (CRP), white blood cell (WBC), red blood cell (RBC), platelet (PLT), monocyte, lymphocyte, neutrophil, complement 3 and 4 (C3 and C4) levels data did not show any significant differences among three genotypes (all p> 0.05) (Tables 3-5).
Table 3: BTLA rs2171513 genotypes and clinical indexes in AS patients
Parameters |
rs2171513 |
p-value |
||
|---|---|---|---|---|
CC |
CT |
TT |
||
CRP |
22.58(2.66, 23.70) |
21.05(3.09, 24.60) |
20.05(3.09, 23.30) |
0.833 |
WBC |
7.74 ± 2.09 |
7.61 ± 2.07 |
7.48 ± 1.55 |
0.722 |
C3 |
1.12 ± 0.27 |
1.09 ± 0.31 |
1.07 ± 0.27 |
0.813 |
C4 |
0.24 ± 0.08 |
0.26 ± 0.10 |
0.24 ± 0.09 |
0.814 |
RBC |
4.88 ± 0.58 |
4.99 ± 0.64 |
4.91 ± 0.54 |
0.304 |
PLT |
248 ± 94 |
257 ± 102 |
251 ± 82 |
0.525 |
Monocyte |
0.44 ± 0.17 |
0.42 ± 0.15 |
0.43 ± 0.14 |
0.485 |
Lymphocyte |
2.06 ± 0.62 |
1.93 ± 0.59 |
1.98 ± 0.59 |
0.070 |
Neutrophil |
5.03 ± 1.85 |
4.97 ± 1.87 |
4.82 ± 1.25 |
0.863 |
The data are presented as mean ± SD.
The data of CRP are presented as mean (lower quartile, upper quartile).
p< 0.05 is considered of statistical significance.
Table 4: BTLA rs1077667 genotypes and clinical indexes in AS patients
Parameters |
rs1077667 |
p-value |
||
|---|---|---|---|---|
GG |
GA |
AA |
||
CRP |
23.17(2.79, 24.10) |
20.63(2.60, 26.43) |
17.67(2.54, 18.7) |
0.570 |
WBC |
7.80 ± 2.15 |
7.45 ± 1.98 |
7.76 ± 1.86 |
0.2 |
C3 |
1.10 ± 0.31 |
1.15 ± 0.29 |
1.05 ± 0.24 |
0.506 |
C4 |
0.23 ± 0.08 |
0.27 ± 0.10 |
0.24 ± 0.09 |
0.185 |
RBC |
4.98 ± 0.59 |
4.88 ± 0.64 |
4.90 ± 0.54 |
0.135 |
PLT |
250 ± 91 |
255 ± 99 |
250 ± 95 |
0.902 |
Monocyte |
0.43 ± 0.15 |
0.42 ± 0.16 |
0.45 ± 0.16 |
0.334 |
Lymphocyte |
2.07 ± 0.64 |
1.98 ± 0.63 |
1.96 ± 0.55 |
0.431 |
Neutrophil |
5.06 ± 1.88 |
4.86 ± 1.72 |
5.03 ± 1.71 |
0.652 |
The data are presented as mean ± SD.
p< 0.05 is considered of statistical significance.
Table 5: BTLA rs12609318 genotypes and clinical indexes in AS patients
Parameters |
rs12609318 |
p-value |
||
|---|---|---|---|---|
AA |
GA |
GG |
||
CRP |
20.77(5.25, 17.20) |
21.58(2.72, 25.40) |
18.47(2.49, 22.00) |
0.553 |
WBC |
7.79 ± 2.23 |
7.51 ± 1.91 |
7.85 ± 1.94 |
0.273 |
C3 |
1.08 ± 0.29 |
1.14 ± 0.30 |
1.04 ± 0.25 |
0.507 |
C4 |
0.25 ± 0.09 |
0.25 ± 0.10 |
0.23 ± 0.07 |
0.728 |
RBC |
4.88 ± 0.60 |
4.92 ± 0.62 |
4.95 ± 0.54 |
0.864 |
PLT |
258 ± 93 |
256 ± 100 |
236 ± 82 |
0.205 |
Monocyte |
0.44 ± 0.17 |
0.43 ± 0.15 |
0.44 ± 0.17 |
0.807 |
Lymphocyte |
2.01 ± 0.59 |
2.01 ± 0.61 |
1.99 ± 0.63 |
0.965 |
Neutrophil |
5.16 ± 1.96 |
4.86 ± 1.67 |
5.07 ± 1.79 |
0.460 |
The data are presented as mean ± SD.
p< 0.05 is considered of statistical significance.
Table 6: Association between rs2171513 C/T, rs1077667 G>A and rs12609318 A>G genotypes
SNP |
Controls |
Patients |
p-value |
OR (95%CI) |
|---|---|---|---|---|
rs2171513 |
||||
CC+CT |
347 |
423 |
0.045 |
1.053 (1.002 - 1.107) |
TT |
40 |
74 |
|
|
rs1077667 |
||||
GG+GA |
318 |
342 |
0.000006 |
1.194 (1.108 - 1.287) |
AA |
69 |
155 |
|
|
rs12609318 |
||||
AA+GA |
320 |
382 |
0.034 |
1.076 (1.007 - 1.150) |
GG |
67 |
115 |
|
|
Recessive |
||||
rs2171513 |
||||
TT+CT |
170 |
241 |
0.48 |
0.948(0.817 - 1.100) |
CC |
217 |
256 |
|
|
rs1077667 |
||||
AA+GA |
218 |
343 |
0.000102 |
0.816 (0.734 - 0.907) |
GG |
169 |
154 |
|
|
rs12609318 |
||||
GG+GA |
295 |
382 |
0.825 |
0.992 (0.921 - 1.068) |
AA |
92 |
115 |
|
|
p< 0.05 is considered of statistical significance.
DISCUSSION
In this case-control study of AS among adults from a Chinese Han population, we indicated that the associations between those four SNPs and the susceptibility to AS. We found the frequency of the AA genotype of rs1077667 in LIGHT gene is higher in AS patients than in controls (p = 4.00E-06), and the frequency of A allele is also higher in the patients (37.1% vs. 50.1%, p =4.59E-08). Meanwhile, there was a correlation between the TT genotype of rs2171513 in BTLA gene and the susceptibility to AS in the dominant model (p = 0.045), and the T allele is of a higher ratio in the patients (p = 0.037). The dominant model of rs12609318 in LIGHT gene was also found a statistical significant difference (p = 0.034). The frequency data of our control group matches up with the data shown in HapMap though they are both not in HWE (p < 0.05) (Figures 1-3).
AS is a complicated polygenic disease correlating with multiple genetic mutations. And here in this study, we found rs1077667 associated with the susceptibility to AS. Significant difference was found in the distribution of genotypes of rs1077667 (p = 4.00E-06), which indicated that people with AA genotype of rs1077667 had more probability to get AS. As for alleles (p = 4.59E-08), we can do a reasonable speculation that A allele is highly likely to participate in the pathological process of AS. The dominant model and recessive model both showed statistically significant difference between patients and controls (p = 6.00E-06 and 0.000102, respectively), which supported our speculation.
LIGHT has two different forms, membrane-bound form and soluble form. Although the mechanism of transformation between the two different forms is still not clear, membrane-bound LIGHT is showed to play an important role in the survival of CD4+ memory T-cell and act as a co-stimulatory molecule, but not as strong as CD28 [13]. Besides, previous studies showed that level of serum-soluble LIGHT is always higher in patients than in controls. The association between rs1077667 and LIGHT level is pointed out that rs1077667 AA carriers have the highest LIGHT level, Thus we got the conclusion that the mutation from G allele to A allele leads to over expression of LIGHT and activated the inflammatory process which leads to the development of AS [7]. And the mutation of rs12609318 may act the similar way.
As for BTLA, T allele of rs2171513 appears to be more in the AS patients than controls (p = 0.037, OR = 0.856, 95%CI = [0.739, 0.992]), that may due to the mutant related to the repression of HVEM-BTLA complex, which has been shown to decrease T cell activity in vivo and limit homeostatic expansion of CD4+ and CD8+ T cells [14, 15]. The dominant model (AA + GA vs. GG)of rs12609318 shows statistical significance (p = 0.034, OR = 1.076, 95%CI = [1.007, 1.150]),which indicated that the AA and GA genotypes are associated with the hazard of AS.
In this study, we found three SNPs rs2171513, rs1077667 and rs12609318 correlated with the susceptibility to AS. But how those mutations of SNPs acted in the transcription process remained unknown and our laboratory did not have the access to this part of research. And more research for further exploration of the molecular mechanism should be done. As for rs2171513 and rs12609318, although their genotypes and alleles did not show statistical significance in our study, it might due to the limitation by the shortage of sample size.
In conclusion, in this study we found SNPs rs2171513, rs1077667 and rs12609318 are associated with the susceptibility to AS. But further studies with a larger sample size are necessary to enhance the power. Moreover, the explanation of how exactly the expression level was influenced need more studies and experiments. Many a little makes a mickle, each step we head forward will give us a better view of AS.
MATERIALS AND METHODS
Study subjects
This study was approved by the Institutional Review Board of Sichuan University. All participants provided their written informed consent to participate in this study. A total of 497 AS patients were diagnosed by rheumatologists according to New York clinical criteria in West China Hospital of Sichuan University [16]. And 387 gender-, age-, and ethnicity-matched healthy controls were enrolled in this study during Jan. 1 2014 to Nov. 1 2014. C-reactive protein (CRP), white blood cell (WBC), red blood cell (RBC), platelet (PLT), monocyte, lymphocyte, neutrophil, complement 3 and 4 (C3 and C4) levels were collected when patients were recruited. All study subjects were of Han ethnicity and lived in the west of China.
Genomic DNA extraction
Blood samples (3 mL) were collected in EDTA-coated tubes, and genomic DNA was isolated from whole blood samples using the whole blood DNA kit (Roche Diagnostics; Penzberg, Bavaria, Germany). DNA was extracted from 200μL of the whole blood, according to the manufacturer’s protocol. The extracted DNA was assessed for purity, yield, and concentration on a spectrophotometer (Bio-RAD; Hercules, CA, USA). Purity was monitored by the A260/A280 ratio. DNA was diluted to 10 ng/μL for working solutions, and isolated DNA was stored at -20°C. The details of methods were illustrated in the former study [17].
Polymerase chain reaction and high-resolution melting method
The rs2171513 C>T in BTLA gene,rs1077667 G>A and rs12609318 A>G in the LIGHT gene were assessed. The SNPs we selected are those haven’t been studied, and more than 5% people are of wild type to be more representative. Polymerase chain reaction (PCR) and melting curve analyses were performed under the same conditions in a 96-well plate on the Light Cycler 480 (Roche Diagnostics). The primers were designed to a small fragment surrounding the polymorphisms and avoided the presence of other sequence variations in the primer region. The rs2171513 C/T PCR primers were 5’-CCGAACTCAAGACTGGCAAGA-3’ (forward) and 5’-GACCCAAGCACTAACATGAACATT -3’ (reverse). The rs1077667 G>A PCR primers were 5’-ATGCCCAACACCATACCCCT-3’ (forward) and 5’-AGACAAAGACAGACAACGTGAATAC-3’ (reverse). The rs12609318 A>G PCR primers were 5’-TCCTTCCTTTCAATCAGCAAGC-3’ (forward) and 5’- ACAGCTTTGTAATGTTTGCCAATT -3’ (reverse). Reaction mixtures contained 1.0 μL purified genomic DNA (10 ng/μL), 0.5 μL forward primer, 0.5 μL reverse primer, 1.4 μL 20×EVA-GREEN, 0.5 μLdNTP (10 mM), 0.2 μL Hot Star Taq® Plus DNA polymerase, 2 μL 10× buffer, and 1 μL 50 mM MgCl2. Real-time PCR was performed with the following conditions: an initial denaturation step at 95°C for 15 min, continued with 50 cycles of 95°C for 10 s, 60°C for 15 s, and 72°C for 20 s. After the amplification phase, a melting curve analysis was performed at 95°C for 1 min, 40°C for 1 min, 65°C for 1 s, and finally slow heating at 0.01°C/s to 95°C.
HRM analysis
Collected data were analyzed by the Light Cycler 480 Gene Scanning software v1.2 (Roche Diagnostics). Software programs used the following analysis method: normalization by selecting linear regions before and after the melting transition, temperature shifting by selecting the threshold, then automatic grouping by calculation. The exact same setting of the normalization was used for all experiments. And all methods were performed in accordance with the relevant guidelines and regulations.
Statistical analysis
The Hardy-Weinberg equilibrium (HWE) for rs2171513 C>T, rs1077667 G>A and rs12609318 A>G were tested by the χ2 test. The difference of the frequency distribution was analyzed by the χ2 test. A difference of p < 0.05 was considered statistically significant. The difference in data for clinical features and pathology grading among different genotypes was analyzed using the Kruskal–Wallis tests. All analyses above were performed with SPSS software (version 19.0, SPSS; Chicago, IL, USA). Statistical power analysis was done with Quanto software (version 1.2.4; University of Southern California; Los Angeles, CA, USA) to determine the power to detect the association of rs2171513 C>T, rs1077667 G>A and rs12609318 A>G alleles with susceptibility to AS at the designated significance level.
ACKNOWLEDGMENTS AND FUNDING
We are grateful to the participating AS patients and their families. This research was sponsored by the National Natural Science Foundation of China (Nos. 81301496, and 81601830) and Science & Technology Department of Sichuan Province (Nos. 2017FZ0070, and 2017SZ0150).
CONFLICTS OF INTEREST
The authors declare that they have no conflicts of interest.
REFERENCES
1. Braun J, Sieper J. Ankylosing spondylitis. Lancet. 2007; 369: 1379-1390.
2. International Genetics of Ankylosing Spondylitis Consortium (IGAS), Cortes A, Hadler J, Pointon JP, Robinson PC, Karaderi T, Leo P, Cremin K, Pryce K, Harris J, Lee S, Joo KB, Shim SC, et al. Identification of multiple risk variants for ankylosing spondylitis through high-density genotyping of immune-related loci. Nat Genet. 2013; 45: 730-738.
3. Australo-Anglo-American Spondyloarthritis Consortium (IGAS), Reveille JD, Sims AM, Danoy P, Evans DM, Leo P, Pointon JJ, Jin R, Zhou X, Bradbury LA, Appleton LH, Davis JC, Diekman L, et al. Genome-wide association study of ankylosing spondylitis identifies non-MHC susceptibility loci. Nat Genet. 2010; 42: 123-127.
4. Hreggvidsdottir HS, Noordenbos T, Baeten DL. Inflammatory pathways in spondyloarthritis. Mol Immunol. 2014; 57: 28-37.
5. Granger SW, Rickert S. LIGHT-HVEM signaling and the regulation of T cell-mediated immunity. Cytokine Growth Factor Rev. 2003; 14: 289-296.
6. Mauri DN, Ebner R, Montgomery RI, Kochel KD, Cheung TC, Yu GL, Ruben S, Murphy M, Eisenberg RJ, Cohen GH, Spear PG, Ware CF. LIGHT, a new member of the TNF superfamily, and lymphotoxin alpha are ligands for herpesvirus entry mediator. Immunity. 1998; 8: 21-30.
7. Malmestrom C, Gillett A, Jernas M, Khademi M, Axelsson M, Kockum I, Mattsson N, Zetterberg H, Blennow K, Alfredsson L, Wadenvik H, Lycke J, Olsson T, Olsson B. Serum levels of LIGHT in MS. Mult Scler. 2013; 19: 871-876.
8. Watanabe N, Gavrieli M, Sedy JR, Yang JF, Fallarino F, Loftin SK, Hurchla MA, Zimmerman N, Sim J, Zang XX, Murphy TL, Russell JH, Allison JP, Murphy KM. BTLA is a lymphocyte inhibitory receptor with similarities to CTLA-4 and PD-1. Nat Immunol. 2003; 4: 670-679.
9. Haroon N, Tsui FW, O’Shea FD, Chiu B, Tsui HW, Zhang H, Marshall KW, Inman RD. From gene expression to serum proteins: biomarker discovery in ankylosing spondylitis. Ann Rheum Dis. 2010; 69: 297-300.
10. Roberts AR, Vecellio M, Chen L, Ridley A, Cortes A, Knight JC, Bowness P, Cohen CJ, Wordsworth BP. An ankylosing spondylitis-associated genetic variant in the IL23R-IL12RB2 intergenic region modulates enhancer activity and is associated with increased Th1-cell differentiation. Ann Rheum Dis. 2016; 75: 2150-2156.
11. Liu J, Lian Z, Xiao Y, Shi LL, Chai W, Wang Y. Analysis of clinical indexes and RUNX3, TBKBP1, PPARGC1B polymorphisms in Chinese Han patients with ankylosing spondylitis. Genet Test Mol Biomarkers. 2015; 19: 37-43.
12. Namipashaki A, Razaghi-Moghadam Z, Ansari-Pour N. The essentiality of reporting hardy-Weinberg equilibrium calculations in population-based genetic association studies. Cell J. 2015; 17: 187-192.
13. Wang J, Fu YX. The role of LIGHT in T cell-mediated immunity. Immunol Res. 2004; 30: 201-214.
14. Shui JW, Steinberg MW, Kronenberg M. Regulation of inflammation, autoimmunity, and infection immunity by HVEM-BTLA signaling. J Leukoc Biol. 2011; 89: 517-523.
15. Oki M, Watanabe N, Owada T, Oya Y, Ikeda K, Saito Y, Matsumura R, Seto Y, Iwamoto I, Nakajima H. A functional polymorphism in B and T lymphocyte attenuator is associated with susceptibility to rheumatoid arthritis. Clin Dev Immunol. 2011; 2011: 305656.
16. van der Linden S, Valkenburg HA, Cats A. Evaluation of diagnostic criteria for ankylosing spondylitis. A proposal for modification of the New York criteria. Arthritis Rheum. 1984; 27: 361-368.
17. Xu HY, Wang ZY, Chen JF, Wang TY, Wang LL, Tang LL, Lin XY, Zhang CW, Chen BC. Association between ankylosing spondylitis and the miR-146a and miR-499 polymorphisms. PLoS One. 2015; 10: e0122055.