
INTRODUCTION
In 2012, an estimated 1,824,700 new lung cancer (LC) cases occurred worldwide, accounting for approximately 13% of overall cancer diagnosis [1]. LC was the most common malignancy and the first leading cause of cancer-related death among males in 2012; in addition, it was the second cancer-related death among females [1]. Thus, exploration of potential heredity factors that might affect the risk of LC, especially non-small-cell LC (NSCLC), which was the most common subtype of cases, attracted our interest. We focused on the costimulatory molecules of immunoglobulin superfamily which regulate T-cell activation and proliferation.
Cytotoxic T-lymphocyte antigen-4 (CTLA-4), a member of the immunoglobulin superfamily, is also known as CD152. In generally, CTLA-4 is expressed on activated T cells and negatively regulate the proliferation and the activation of T cells [2–4]. CTLA-4 competes with CD28 and binds to B7.1 and B7.2 which are costimulatory molecules expressed on antigen-presenting cells. In addition, the affinity between CTLA-4 and B7 molecules is higher than that of CD28 with B7 molecules [5, 6]. The interaction of CTLA-4–B7 leads to the repression of T cells at the G1 phase and the down-regulated expression of interleukin-2 (IL-2) and IL-2 receptor [7]. This interaction can also induce activated T cells to FAS-independent apoptosis, and then further restrain T lymphocytes.
CTLA-4, a immunoregulatory molecule, is encoded by a gene on chromosome 2q33. A number of single-nucleotide polymorphisms (SNPs) in CTLA-4 gene have been established. Song et al. reported that CTLA-4 +49A>G polymorphism was a prognostic predictor for advanced NSCLC [8]. In addition, Antczak et al. found that CTLA-4 expression was significantly correlated with CTLA-4 TT genotype (-318C/T). Recently, several case-control studies focused on the relationship of CTLA-4 SNPs with the risk of NSCLC [8–12]. However, due to the limited sample size and the number of study, the association between CTLA-4 SNPs and NSCLC susceptibility was not well understood. The objective of this case-control study was to extensively explore the relationship of CTLA-4 rs16840252 C>T, rs231775 G>A, rs3087243 G>A and rs733618 T>C polymorphisms with susceptibility to NSCLC.
RESULTS
Demographic characteristics
This case-control study comprised 521 NSCLC cases and 1,030 control subjects. The NSCLC patients comprised 287 males and 234 females, while the non-cancer control subjects were 588 males and 442 females. The mean age and SD in the NSCLC patient was 59.76 ± 10.71 years and that was 60.34 ± 9.11 years in controls. Gender and age were well-matched between the groups (P = 0.453 and P = 0.843, respectively, Table 1). All 521 confirmed cases of NSCLC were sporadic. The genotyping successful rates were shown in Table 2 and they ranged from 99.81% to 99.94%. The values of MAF in control subjects were very similar to the data for Chinese (Table 2). The genotype frequencies of CTLA-4 rs16840252 C>T, rs231775 G>A, rs3087243 G>A and rs733618 T>C polymorphisms in controls reached Hardy-Weinberg equilibrium (HWE).
Table 1: Distribution of selected demographic variables and risk factors in NSCLC cases and controls
Variable |
Overall Cases (n = 521) |
Overall Controls (n = 1,030) |
Pa |
|---|---|---|---|
n (%) |
n (%) |
||
Age (years) |
59.76 ±10.71 |
60.34 ± 9.11 |
0.268 |
Age (years) |
0.843 |
||
< 60 |
238 (45.68) |
476 (46.21) |
|
≥ 60 |
283 (54.32) |
554 (53.79) |
|
Sex |
0.453 |
||
Male |
287 (55.09) |
588 (57.09) |
|
Female |
234 (44.91) |
442 (42.91) |
|
Smoking status |
< 0.001 |
||
Never |
317 (60.84) |
828 (80.39) |
|
Ever |
204 (39.16) |
202 (19.61) |
|
Alcohol use |
< 0.001 |
||
Never |
444 (85.22) |
949 (92.14) |
|
Ever |
77 (14.78) |
81 (7.86) |
|
BMI (kg/m2) |
23.00 (±3.03) |
23.84 (±3.06) |
< 0.001 |
BMI (kg/m2) |
|||
< 24 |
337 (64.68) |
547 (53.11) |
< 0.001 |
≥ 24 |
184 (35.32) |
483 (46.89) |
|
Lymph node status |
|||
Positive |
200 (38.39) |
||
Negative |
314 (60.27) |
||
Unknown |
7 (1.34) |
||
TMN stage |
|||
I + II |
315 (60.46) |
||
III + IV |
206 (39.54) |
||
Type of NSCLC |
|||
Adenocarcinoma |
415 (79.65) |
||
Squamous cell carcinoma |
85 (16.31) |
||
Others |
21 (4.03) |
a Two-sided χ2 test and student t test;
Bold values are statistically significant (P < 0.05);
BMI, body mass index.
NSCLC: non-small-cell lung cancer
Table 2: Primary information for CTLA-4polymorphisms (rs3087243 G>A, rs16840252 C>T, rs733618 T>C and rs231775 G>A)
Genotyped SNPs |
CTLA-4rs3087243 G>A |
CTLA-4rs16840252 C>T |
CTLA-4rs733618 T>C |
CTLA-4rs231775 G>A |
|---|---|---|---|---|
Chromosome |
2 |
2 |
2 |
2 |
Function |
nearGene-3 |
nearGene-5 |
nearGene-5 |
missense |
Chr Pos (NCBI Build 38) |
203874196 |
203866796 |
203866221 |
203867991 |
MAFa for Chinese in database |
0.183 |
0.122 |
0.390 |
0.314 |
MAF in our controls (n =1,040) |
0.182 |
0.121 |
0.407 |
0.300 |
P value for HWEb test in our controls |
0.532 |
0.146 |
0.314 |
0.950 |
Genotyping method |
SNPscan |
SNPscan |
SNPscan |
SNPscan |
% Genotyping value |
99.94% |
99.94% |
99.94% |
99.81% |
aMAF: minor allele frequency;
bHWE: Hardy–Weinberg equilibrium.
Association of CTLA-4 rs16840252 C>T, rs231775 G>A, rs3087243 G>A and rs733618 T>C Polymorphisms with NSCLC
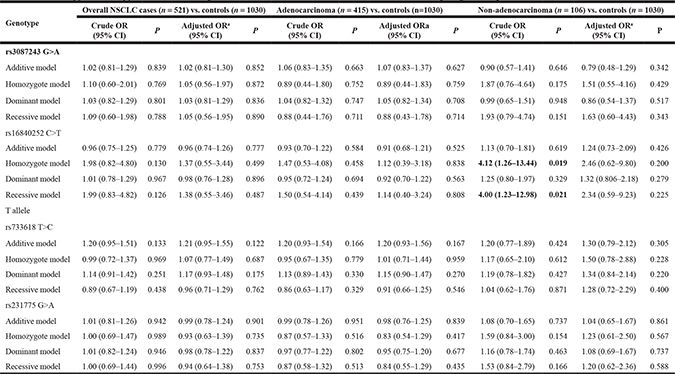
Table 3 demonstrated the detailed frequencies of CTLA-4 rs16840252 C>T, rs231775 G>A, rs3087243 G>A and rs733618 T>C genotypes. Results of the single locus analyses were summarized in Table 4. We found no statistically significant difference in CTLA-4 genotype distribution among NSCLC patients and non-cancer controls. The similar findings were observed in the logistic regression analyses.
Table 3: The frequencies of CTLA-4 rs3087243 G>A, rs16840252 C>T, rs733618 T>C and rs231775 G>A polymorphisms in different NSCLC subgroups
Genotype |
NSCLC Cases |
Adenocarcinoma |
Non-adenocarcinoma |
Controls (n = 1,030) |
||||
|---|---|---|---|---|---|---|---|---|
n |
% |
n |
% |
n |
% |
n |
% |
|
rs3087243 G>A |
||||||||
GG |
344 |
66.03 |
273 |
65.78 |
71 |
66.98 |
686 |
66.67 |
GA |
160 |
30.71 |
131 |
31.57 |
29 |
27.36 |
312 |
30.32 |
AA |
17 |
3.26 |
11 |
2.65 |
6 |
5.66 |
31 |
3.01 |
A allele |
194 |
18.62 |
153 |
18.43 |
41 |
19.34 |
374 |
18.17 |
rs16840252 C>T |
||||||||
CC |
400 |
76.78 |
323 |
77.83 |
77 |
72.64 |
791 |
76.87 |
CT |
111 |
21.31 |
86 |
20.72 |
25 |
23.58 |
228 |
22.16 |
TT |
10 |
1.92 |
6 |
1.45 |
4 |
3.77 |
10 |
0.97 |
T allele |
131 |
12.57 |
98 |
11.81 |
33 |
15.57 |
248 |
12.05 |
rs733618 T>C |
||||||||
TT |
172 |
33.01 |
138 |
33.25 |
34 |
32.08 |
370 |
35.96 |
TC |
267 |
51.25 |
214 |
51.57 |
53 |
50.00 |
481 |
46.74 |
CC |
82 |
15.74 |
63 |
15.18 |
19 |
17.92 |
178 |
17.30 |
C allele |
431 |
41.36 |
340 |
40.96 |
91 |
42.92 |
837 |
40.67 |
rs231775 G>A |
||||||||
GG |
254 |
48.85 |
206 |
49.76 |
48 |
45.28 |
504 |
49.03 |
GA |
219 |
42.12 |
175 |
42.27 |
44 |
41.51 |
431 |
41.93 |
AA |
47 |
9.04 |
33 |
7.97 |
14 |
13.21 |
93 |
9.05 |
A allele |
313 |
30.10 |
241 |
29.11 |
72 |
33.96 |
617 |
30.01 |
Table 4: Logistic regression analyses of association between CTLA-4 polymorphisms and risk of NSCLC
a Adjusted for age, sex, smoking status, alcohol use and BMI status
In a stratified analysis by cancer type of NSCLC, logistic regression analyses indicated that there was no difference in genotype distribution of CTLA-4 rs231775 G>A, rs16840252 C>T, rs3087243 G>A and rs733618 T>C polymorphisms among different NSCLC types and controls (Table 4).
Association of CTLA-4 rs16840252 C>T, rs231775 G>A, rs3087243 G>A and rs733618 T>C Polymorphisms with NSCLC in a stratification analysis
Tables 5–7 summarized the genotype frequencies of CTLA-4 rs3087243 G>A, rs16840252 C>T and rs231775 G>A polymorphisms in the stratified analyses by gender, age, BMI, drinking and smoking status. We found no difference in genotype distribution of CTLA-4 rs16840252C>T, rs231775 G>A and rs3087243 G>A polymorphisms among NSCLC cases and the control subjects in any subgroup.
Table 5: Stratified analyses between CTLA-4 rs3087243 G>A polymorphism and NSCLC risk by sex, age, BMI, smoking status and alcohol consumption
Variable |
CTLA-4 rs3087243 G>A (case/control)a |
Adjusted ORb (95% CI); P |
|||||
|---|---|---|---|---|---|---|---|
GG |
GA |
AA |
additive model |
homozygote model |
Dominant model |
Recessive model |
|
Sex |
|||||||
Male |
184/387 |
94/178 |
9/22 |
1.16 (0.84–1.61); P: 0.381 |
0.76 (0.33–1.75); P: 0.513 |
1.11 (0.81–1.52); P: 0.531 |
0.72 (0.31–1.66); P: 0.442 |
Female |
160/299 |
66/134 |
8/9 |
0.89 (0.62–1.28); P: 0.541 |
1.66 (0.62–4.46); P: 0.312 |
0.94 (0.67–1.33); P: 0.734 |
1.72 (0.65–4.59); P: 0.277 |
Age |
|||||||
< 60 |
162/320 |
72/142 |
4/13 |
1.09 (0.76–1.55); P: 0.653 |
0.67 (0.21–2.20); P: 0.514 |
1.05 (0.74–1.49); P: 0.785 |
0.66 (0.20–2.13); P: 0.483 |
≥ 60 |
182/366 |
88/170 |
13/18 |
1.00 (0.72–1.39); P: 0.987 |
1.33 (0.62–2.86); P: 0.459 |
1.04 (0.76–1.42); P: 0.825 |
1.33 (0.63–2.84); P: 0.456 |
Smoking status |
|||||||
Never |
207/556 |
100/249 |
10/22 |
1.06 (0.79–1.41); P: 0.708 |
1.21 (0.55–2.65); P: 0.632 |
1.07 (0.81–1.42); P: 0.647 |
1.19 (0.55–2.58); P: 0.665 |
Ever |
137/130 |
60/63 |
7/9 |
0.90 (0.58–1.39); P: 0.630 |
0.77 (0.27–2.14); P: 0.610 |
0.88 (0.58–1.34); P: 0.556 |
0.79 (0.29–2.19); P: 0.653 |
Alcohol consumption |
|||||||
Never |
292/636 |
138/285 |
14/27 |
1.01 (0.78–1.31); P: 0.927 |
1.04 (0.52–2.06); P: 0.916 |
1.01 (0.79–1.30); P: 0.918 |
1.03 (0.52–2.04); P: 0.926 |
Ever |
52/50 |
22/27 |
3/4 |
0.96 (0.46–1.99); P: 0.911 |
0.76 (0.15–3.91); P: 0.747 |
0.93 (0.46–1.87); P: 0.842 |
0.77 (0.15–3.90); P: 0.756 |
BMI (kg/m2) |
|||||||
< 24 |
223/350 |
104/178 |
10/18 |
0.91 (0.67–1.24); P: 0.546 |
0.95 (0.42–2.18); P: 0.911 |
0.91 (0.68–1.23); P: 0.546 |
0.98 (0.43–2.23); P: 0.967 |
≥ 24 |
121/336 |
56/134 |
7/13 |
1.21 (0.82–1.78); P: 0.343 |
1.13 (0.42–3.06); P: 0.806 |
1.20 (0.83–1.74); P: 0.342 |
1.07 (0.40–2.86); P: 0.985 |
a The genotyping was successful in 521 (100.00%) NSCLC cases, and 1029 (99.90%) controls for CTLA-4 rs3087243 G>A; b Adjusted for age, sex, BMI, smoking status and alcohol consumption (besides stratified factors accordingly) in a logistic regression model.
Table 6: Stratified analyses between CTLA-4 rs16840252 C>T polymorphism and NSCLC risk by sex, age, BMI, smoking status and alcohol consumption
Variable |
CTLA-4 rs16840252 C>T (case/control)a |
Adjusted ORb (95% CI); P |
|||||
|---|---|---|---|---|---|---|---|
CC |
CT |
TT |
Additive model |
Homozygote model |
Dominant model |
Recessive model |
|
Sex |
|||||||
Male |
214/462 |
65/121 |
8/4 |
1.23 (0.85–1.78); P: 0.269 |
3.22 (0.90–11.54); P: 0.073 |
1.31 (0.92–1.87); P: 0.136 |
3.08 (0.86–10.99); P: 0.084 |
Female |
186/329 |
46/107 |
2/6 |
0.70 (0.47–1.04); P: 0.074 |
0.39 (0.07–2.04); P: 0.262 |
0.68 (0.46–1.00); P: 0.052 |
0.43 (0.08–2.24); P: 0.315 |
Age |
|||||||
< 60 |
177/367 |
56/102 |
5/6 |
1.08 (0.73–1.60); P: 0.701 |
1.27 (0.37–4.37); P: 0.702 |
1.09 (0.75–1.60); P: 0.652 |
1.25 (0.37–4.28); P: 0.722 |
≥ 60 |
223/424 |
55/126 |
5/4 |
0.84 (0.58–1.22); P: 0.366 |
1.49 (0.38–5.92); P: 0.570 |
0.87 (0.61–1.25); P: 0.448 |
1.55 (0.39–6.13); P: 0.534 |
Smoking status |
|||||||
Never |
245/631 |
70/188 |
2/8 |
0.94 (0.68–1.29); P: 0.704 |
0.46 (0.10–2.22); P: 0.333 |
0.91 (0.67–1.25); P: 0.579 |
0.47 (0.10–2.25); P: 0.340 |
Ever |
155/160 |
41/40 |
8/2 |
1.04 (0.64–1.71); P: 0.874 |
4.10 (0.84–19.97); P: 0.081 |
1.18 (0.74–1.90); P: 0.485 |
4.07 (0.84–19.72); P: 0.082 |
Alcohol consumption |
|||||||
Never |
343/731 |
91/210 |
10/7 |
0.96 (0.72–1.27); P: 0.759 |
2.04 (0.74–5.62); P: 0.167 |
1.00 (0.76–1.32); P: 0.996 |
2.06 (0.75–5.66); P: 0.162 |
Ever |
57/60 |
20/18 |
0/3 |
1.05 (0.50–2.23); P: 0.890 |
- |
0.90 (0.44–1.87); P: 0.785 |
- |
BMI(kg/m2) |
|||||||
< 24 |
256/410 |
74/127 |
7/9 |
0.98 (0.70–1.38); P: 0.901 |
1.02 (0.37–2.84); P: 0.974 |
0.98 (0.71–1.36); P: 0.906 |
1.02 (0.37–2.84); P: 0.967 |
≥ 24 |
144/381 |
37/101 |
3/1 |
0.94 (0.61–1.45); P: 0.773 |
5.70 (0.53–61.80); P: 0.152 |
0.99 (0.65–1.53); P: 0.977 |
5.77 (0.53–62.46); P: 0.149 |
aThe genotyping was successful in 521 (100.00%) NSCLC cases, and 1029 (99.90%) controls for CTLA-4 rs16840252 C>T; bAdjusted for age, sex, BMI, smoking status and alcohol consumption (besides stratified factors accordingly) in a logistic regression model.
Table 7: Stratified analyses between CTLA-4 rs231775 G>A polymorphism and NSCLC risk by sex, age, smoking status and alcohol consumption
Variable |
CTLA-4 rs231775 G>A (case/control)a |
Adjusted ORb (95% CI); P |
|||||
|---|---|---|---|---|---|---|---|
GG |
GA |
AA |
Additive model |
Homozygote model |
Dominant model |
Recessive model |
|
Sex |
|||||||
Male |
132/292 |
123/241 |
31/54 |
1.16 (0.85–1.60); P: 0.355 |
1.20 (0.71–2.02); P: 0.500 |
1.18 (0.87–1.60); P: 0.286 |
1.12 (0.68–1.85); P: 0.655 |
Female |
122/212 |
96/190 |
16/39 |
0.81 (0.58–1.14); P: 0.233 |
0.64 (0.34–1.20); P: 0.164 |
0.78 (0.56–1.08); P: 0.129 |
0.70 (0.38–1.29); P: 0.254 |
Age |
|||||||
< 60 |
114/237 |
103/195 |
21/43 |
1.13 (0.80–1.59); P: 0.485 |
1.01 (0.56–1.82); P: 0.980 |
1.11 (0.80–1.53); P: 0.550 |
0.95 (0.54–1.68); P: 0.863 |
≥ 60 |
140/267 |
116/236 |
26/50 |
0.89 (0.65–1.23); P: 0.487 |
0.88 (0.51–1.51); P: 0.640 |
0.90 (0.66–1.21); P: 0.469 |
0.93 (0.55–1.57); P: 0.781 |
Smoking status |
|||||||
Never |
155/407 |
137/346 |
24/73 |
0.98 (0.74–1.30); P: 0.893 |
0.82 (0.50–1.37); P: 0.454 |
0.96 (0.73–1.25); P: 0.734 |
0.83 (0.51–1.36); P: 0.461 |
Ever |
99/97 |
82/85 |
23/20 |
0.96 (0.63–1.45); P: 0.838 |
1.10 (0.57–2.15); P: 0.773 |
0.99 (0.67–1.46); P: 0.942 |
1.13 (0.59–2.13); P: 0.717 |
Alcohol consumption |
|||||||
Never |
218/470 |
183/397 |
42/80 |
0.95 (0.74–1.22); P: 0.696 |
1.04 (0.68–1.60); P: 0.842 |
0.97 (0.77–1.23); P: 0.791 |
1.07 (0.71–1.61); P: 0.751 |
Ever |
36/34 |
36/34 |
5/13 |
1.13 (0.56–2.29); P: 0.726 |
0.38 (0.12–1.20); P: 0.099 |
0.90 (0.47–1.74); P: 0.756 |
0.36 (0.12–1.08); P: 0.068 |
BMI(kg/m2) |
|||||||
< 24 |
162/249 |
148/238 |
27/58 |
0.99 (0.74–1.34); P: 0.966 |
0.69 (0.41–1.16); P: 0.160 |
0.93 (0.70–1.23); P: 0.590 |
0.69 (0.42–1.13); P: 0.144 |
≥ 24 |
92/255 |
71/193 |
20/35 |
0.94 (0.64–1.36); P: 0.732 |
1.50 (0.81–2.80); P: 0.200 |
1.04 (0.73–1.47); P: 0.848 |
1.56 (0.86–2.85); P: 0.146 |
aThe genotyping was successful in 520 (99.81%) NSCLC cases, and 1028 (99.81%) controls for CTLA-4 rs231775 G>A; bAdjusted for age, sex, BMI, smoking status and alcohol consumption (besides stratified factors accordingly) in a logistic regression model;
As shown in Table 8, the stratified analyses suggested CTLA-4 rs733618 vatiants were correlated with the development of NSCLC in ≥ 60 years subgroup (TC vs. TT: adjusted odds ratio (OR) = 1.45, 95% confidence intervals (CI) = 1.04–2.02, P = 0.030) and even drinking subgroup (TC vs. TT: adjusted OR = 2.27, 95% CI = 1.11–4.60, P = 0.024 and TC/CC vs. TT: adjusted OR = 2.26, 95% CI = 1.15–4.43, P = 0.018).
Table 8: Stratified analyses between CTLA-4 rs733618 T>C polymorphism and NSCLC risk by sex, age, smoking status and alcohol consumption
Variable |
CTLA-4 rs733618 T>C (case/control)a |
Adjusted ORb (95% CI); P |
|||||
|---|---|---|---|---|---|---|---|
TT |
TC |
CC |
Additive model |
Homozygote model |
Dominant model |
Recessive model |
|
Sex |
|||||||
Male |
94/211 |
149/271 |
44/105 |
1.28 (0.91–1.79); P: 0.156 |
1.06 (0.67–1.67); P: 0.810 |
1.22 (0.88–1.67); P: 0.234 |
0.91 (0.61–1.38); P: 0.669 |
Female |
78/159 |
118/210 |
38/73 |
1.19 (0.83–1.70); P: 0.354 |
1.14 (0.70–1.85); P: 0.607 |
1.17 (0.84–1.65); P: 0.359 |
1.03 (0.67–1.59); P: 0.900 |
Age |
|||||||
< 60 |
81/163 |
114/226 |
43/86 |
1.01 (0.70–1.46); P: 0.948 |
1.05 (0.66–1.69); P: 0.836 |
1.02 (0.72–1.44); P: 0.911 |
1.04 (0.68–1.59); P: 0.847 |
≥ 60 |
91/207 |
153/255 |
39/92 |
1.45 (1.04–2.02); P: 0.030 |
1.09 (0.68–1.74); P: 0.729 |
1.35 (0.99–1.86); P: 0.061 |
0.87 (0.57–1.33); P: 0.530 |
Smoking status |
|||||||
Never |
106/295 |
165/380 |
46/152 |
1.24 (0.92–1.66); P: 0.155 |
0.91 (0.61–1.37); P: 0.654 |
1.15 (0.87–1.52); P: 0.340 |
0.80 (0.56–1.16); P: 0.242 |
Ever |
66/75 |
102/101 |
36/26 |
1.19 (0.77–1.83); P: 0.440 |
1.61 (0.88–2.97); P: 0.125 |
1.27 (0.84–1.93); P: 0.253 |
1.46 (0.84–2.53); P: 0.183 |
Alcohol consumption |
|||||||
Never |
149/331 |
225/449 |
70/168 |
1.12 (0.87–1.46); P: 0.387 |
0.99 (0.69–1.41); P: 0.944 |
1.08 (0.85–1.39); P: 0.520 |
0.92 (0.67–1.27); P: 0.615 |
Ever |
23/39 |
42/32 |
12/10 |
2.27 (1.11–4.60); P: 0.024 |
2.23 (0.81–6.13); P: 0.121 |
2.26 (1.15–4.43); P: 0.018 |
1.40 (0.56–3.54); P: 0.472 |
BMI (kg/m2) |
|||||||
< 24 |
112/212 |
173/250 |
52/84 |
1.29 (0.9–1.76); P: 0.113 |
1.18 (0.77–1.81); P: 0.459 |
1.26 (0.94–1.69); P: 0.131 |
1.02 (0.69–1.51); P: 0.932 |
≥ 24 |
60/158 |
94/231 |
30/94 |
1.11 (0.75–1.65); P: 0.610 |
0.95 (0.56–1.60); P: 0.847 |
1.07 (0.73–1.55); P: 0.744 |
0.89 (0.56–1.42); P: 0.631 |
a The genotyping was successful in 521 (100.00%) NSCLC cases, and 1029 (99.90%) controls for CTLA-4 rs733618 T>C; b Adjusted for age, sex, BMI, smoking status and alcohol consumption (besides stratified factors accordingly) in a logistic regression model.
SNP haplotypes
Using SHESIS online haplotype construction software [(http://analysis.bio-x.cn/myAnalysis.php), Bio-X Inc., Shanghai, China] [13], we constructed four haplotypes (Table 9). We found there was no difference in haplotype distribution among NSCLC cases and the control subjects (Table 9).
Table 9: CTLA4 haplotype frequencies (%) in cases and controls and risk of NSCLC
Haplotypes |
case (n = 1042) |
control (n = 2060) |
Crude OR (95% CI) |
P |
||
|---|---|---|---|---|---|---|
n |
% |
n (%) |
% |
|||
C G G C |
430 |
41.35 |
836 |
40.66 |
Reference |
|
C G G T |
285 |
27.40 |
595 |
28.94 |
0.93 (0.78–1.12) |
0.445 |
C A A T |
189 |
18.17 |
374 |
18.19 |
0.98 (0.80–1.21) |
0.869 |
T A G T |
123 |
11.83 |
239 |
11.62 |
1.00 (0.78–1.28) |
0.996 |
Others |
13 |
1.25 |
12 |
0.58 |
2.11 (0.95–4.66) |
0.060 |
With the order of CTLA4 rs16840252 C>T, rs231775 G>A, rs3087243 G>A and rs733618 T>C in gene position.
The power of the present study (α= 0.05)
For CTLA-4 rs733618 T>C, the power value was 0.629 in additive model among ≥ 60 years subgroup, and 0.651 in additive model and 0.692 in dominant model among even drinking subgroup.
DISCUSSION
In generally, immune escape may be an important mechanism in the development of malignancies. The costimulatory signal related SNPs, common variants among individuals, may play important roles in the development of human cancers. In the present study, we explored the effect of CTLA-4 tagging SNPs in NSCLC among Eastern Chinese Han population for the first time. We found that CTLA-4 tagging polymorphisms might be not correlated with the susceptibility of overall NSCLC. The results of haplotype analysis suggested that there was no difference in haplotype distribution among NSCLC cases and the control subjects. However, in the stratified analyses by age, sex, BMI, alcohol use and smoking status, we found that CTLA-4 rs733618 T>C polymorphism was associated with the development of NSCLC in ≥ 60 years and even drinking subgroups.
NSCLC is a multifactorial disease which results from the interaction between individual’s genetic backgrounds and environmental risk factors. Previous studies have demonstrated that CTLA-4 rs733618 T>C polymorphism decreases a transcription factor binding site for nuclear factor 1 and weaken CTLA-4 expression on cell surface [14, 15]. Accumulating evidences suggested that CTLA-4 rs733618 T>C polymorphism might be associated with the increased risk of systemic lupus erythematosus [16–19]. However, the relationship of CTLA-4 rs733618 T>C polymorphism with the development of cancer was conflicting. With an interest in the correlation of CTLA-4 rs733618 T>C polymorphism with cancer susceptibility, a case-control study explored the hypothesis that CTLA-4 rs733618 T>C polymorphism was associated with the etiology of NSCLC [10]; however, this study in an Iranian population established null association between CTLA-4 rs733618 T>C polymorphism and NSCLC. In the current study, we found that CTLA-4 rs733618 T>C polymorphism was associated with the development of NSCLC. In addition, a previous study in China conducted by Li et al., compared with the CTLA-4 rs733618 T allele, the C allele increased the risk of breast cancer [20]. Our findings might be supported by this study. To the best of our knowledge, the present case-control study was the first study to examine the potential relationship between CTLA-4 rs733618 T>C polymorphism and the development of NSCLC in Asians. However, due to the limited sample size, these potential association should be explained with very caution. In the future, more case-control studies with detailed lifestyle and environmental factors data should be conducted to explore these potential association.
We should acknowledge some limitations in this case-control study. Firstly, the NSCLC patients and control subjects were enrolled from local hospitals in Eastern China and might not fully represent the general Chinese Han population. Secondly, the moderate sample size of NSCLC cases might limit the statistical power to obtain a real assessment, especially in the stratified analyses. Further well-designed fine-mapping studies with large sample sizes are needed to confirm our findings. Thirdly, the clinical information on metastasis and survival of NSCLC could not be derived till now, which restricted further explores on the potential role of CTLA-4tagging polymorphisms in NSCLC progression and prognosis. Fourthly, the information about family cancer history was not collected. Finally, due to lack of the information about individual’s lifestyle, further determination for the interactions of gene-gene and gene-environment were not carried out. In consideration of the complex pathological process of NSCLC, these gene and environmental risk factors should not be ignored.
In summary, the present case-control study highlights that CTLA-4 rs733618 T>C polymorphism was associated with the development of NSCLC in ≥ 60 years and even drinking subgroups. In addition, a larger population-based fine-mapping study as well as detailed functional assessment are necessary to confirm or refute our findings.
MATERIALS AND METHODS
Study population and patient selection
A total of 521 Eastern Chinese Han population with NSCLC were included in this study. These NSCLC patients were diagnosed from January 2014 to December 2016 at the Affiliated People’s Hospital of Jiangsu University (Zhenjiang, China) and the Affiliated Union Hospital of Fujian Medical University (Fuzhou, China). Diagnosis of NSCLC was confirmed via histopathological examinations after operation or bronchoscope check. The selection criteria of NSCLC cases were: (1) sporadic NSCLC cases; (2) NSCLC patients without any treatment and (3) Eastern Chinese Han population. And the corresponding major exclusion criteria were: (1) autoimmune disease history; (2) NSCLC cases who received prior chemoradiotherapy and targeted threapy and (3) a history of another malignancy. Meanwhile, a total of 1,030 non-cancer controls were enrolled when they attended a routine physical examination in the Physical Examination Center of these hospitals. Additionally, the criteria for non-cancer controls selection was: (1) cancer-free subjects; (2) without autoimmune disease; (3) sex and gender matched to NSCLC patients; (4) unrelated subjects and (5) Eastern Chinese Han population. During recruitment, all study subjects signed the written informed consents following the Declaration of Helsinki. The information of risk factors and demographics was obtained by a pre-structured questionnaire. NSCLC cases and controls were well-matched in terms of age and sex (Table 1). Subjects who smoked at least one cigarette per day over 1 year were considered as ‘ever smokers’ [21], and those who drinked no less than three times a week for more than 6 months were defined as ‘ever drinkers’ [21]. The Ethical Committee of Fujian Medical University approved the study protocols (No. 2017KY019).
Selection of CTLA-4 tagging SNPs
The CTLA-4 tagging SNPs were selected through the Genome Variation Server (GVS) data (http://gvs.gs.washington.edu/GVS147/). The major included criterion were: (a) P value of HWE ≥ 0.05, (b) minor allele frequency (MAF) ≥ 0.05 (c) pairwise linkage disequilibrium (LD) r2 threshold of 0.8 between SNPs (r2 > 0.8) and (d) the call rate ≥ 95 % in the CHB cohort were included [22]. Finally, CTLA-4 rs3087243 G>A, rs16840252 C>T, rs733618 T>C and rs231775 G>A polymorphisms were eligible for study. Table 2 summarizes the information of the selected SNPs.
DNA extraction and genotyping
Two milliliters blood sample was donated by each enrolled subject and stored in Ethylenediamine tetraacetic acid (EDTA)-anticoagulation tube. DNA was elaborately extracted from lymphocytes by using the Promega kit (Promega, Madison, USA). We extracted DNA according to the manufacturer’s instruction (www.promega.com/protocols/). The genotypes of CTLA-4 rs16840252 C>T, rs231775 G>A, rs3087243 G>A and rs733618 T>C polymorphisms were evaluated using a custom-by-design 48-Plex SNPscan Kit (Genesky Biotechnologies Inc., Shanghai, China) as presented in previous studies [23, 24]. Briefly, we first denatured 150ng DNA sample at 98°C for 5 min. The ligation reaction was performed in an ABI 2720 thermal cycler. A 48-plex fluorescence PCR reaction was carried out for each ligation product. Then, in an ABI 3730XL sequencer, the obtained PCR products were separated and detected by using capillary electrophoresis. The raw data were analyzed by GeneMapper 4.1 software (Applied Biosystems, USA). A 4% randomly selected DNA sample was reciprocally verified by another laboratory technician, and the reproducibility was 100%.
Statistical analysis
Statistical analysis of this case-control study was done using the SAS 9.4 Statistical Package for Windows (SAS Institute, Cary, NC). A P < 0.05 (two–tailed) was accepted as the level of significance. The results of continuous variables were presented as mean ± standard deviation (SD). The mean values of age between NSCLC patients and non-cancer controls were calculated using the Student’s t-test. The deviation of HWE in controls was analyzed using an online Pearson’s two-sided χ2 test (http://ihg.gsf.de/cgi-bin/hw/hwa1.pl) [25]. The differences in smoking, drinking, demographic variables and the frequencies of genotypes between NSCLC cases and controls were also determined by χ2 test. The crude/adjusted ORs and the corresponding 95% CIs were harnessed to assess the relationship of CTLA-4 rs16840252 C>T, rs231775 G>A, rs3087243 G>A and rs733618 T>C polymorphism genotypes with NSCLC risk. SHESIS online haplotype construction software [(http://analysis.bio-x.cn/myAnalysis.php), Bio-X Inc., Shanghai, China] was used to obtain the haplotypes [13]. The power value of this study was calculated by Power and Sample Size software (http://biostat.mc.vanderbilt.edu/twiki/bin/view/Main/PowerSampleSize) [26].
ACKNOWLEDGMENTS
We appreciate all subjects who participated in this study. We wish to thank Dr. Yan Liu (Genesky Biotechnologies Inc., Shanghai, China) for technical support.
CONFLICTS OF INTEREST
The authors have no potential financial conflicts of interest.
GRANT SUPPORT
This study was supported in part by Young and Middle-aged Talent Training Project of Health Development Planning Commission in Fujian Province (2016-ZQN-25 and 2014-ZQN-JC-11), Program for New Century Excellent Talents in Fujian Province University (NCETFJ-2017B015), Medical Innovation Project of Fujian Province (2014-CX-15 and 2014-CX-18), Nursery Garden Project of Fujian Medical University (2015MP020) and Science and Technology Project of Fujian Province (2060203).
REFERENCES
1. Torre LA, Bray F, Siegel RL, Ferlay J, Lortet-Tieulent J, Jemal A. Global cancer statistics, 2012. CA Cancer J Clin. 2015; 65:87–108.
2. Hodi FS, Mihm MC, Soiffer RJ, Haluska FG, Butler M, Seiden MV, Davis T, Henry-Spires R, MacRae S, Willman A, Padera R, Jaklitsch MT, Shankar S, et al. Biologic activity of cytotoxic T lymphocyte-associated antigen 4 antibody blockade in previously vaccinated metastatic melanoma and ovarian carcinoma patients. Proc Natl Acad Sci USA. 2003; 100:4712–4717.
3. Walunas TL, Lenschow DJ, Bakker CY, Linsley PS, Freeman GJ, Green JM, Thompson CB, Bluestone JA. CTLA-4 can function as a negative regulator of T cell activation. Immunity. 1994; 1:405–413.
4. van der Merwe PA, Bodian DL, Daenke S, Linsley P, Davis SJ. CD80 (B7-1) binds both CD28 and CTLA-4 with a low affinity and very fast kinetics. J Exp Med. 1997; 185:393–403.
5. Sharpe AH, Freeman GJ. The B7-CD28 superfamily. Nat Rev Immunol. 2002; 2:116–126.
6. Alegre ML, Frauwirth KA, Thompson CB. T-cell regulation by CD28 and CTLA-4. Nat Rev Immunol. 2001; 1:220–228.
7. Appleman LJ, Berezovskaya A, Grass I, Boussiotis VA. CD28 costimulation mediates T cell expansion via IL-2-independent and IL-2-dependent regulation of cell cycle progression. J Immunol. 2000; 164:144–151.
8. Song B, Liu Y, Liu J, Song X, Wang Z, Wang M, Zhu Y, Han J. CTLA-4 +49A>G polymorphism is associated with advanced non-small cell lung cancer prognosis. Respiration. 2011; 82:439–444.
9. Karabon L, Pawlak E, Tomkiewicz A, Jedynak A, Passowicz-Muszynska E, Zajda K, Jonkisz A, Jankowska R, Krzakowski M, Frydecka I. CTLA-4, CD28, and ICOS gene polymorphism associations with non-small-cell lung cancer. Hum Immunol. 2011; 72:947–954.
10. Khaghanzadeh N, Erfani N, Ghayumi MA, Ghaderi A. CTLA4 gene variations and haplotypes in patients with lung cancer. Cancer Genet Cytogenet. 2010; 196:171–174.
11. Sun T, Zhou Y, Yang M, Hu Z, Tan W, Han X, Shi Y, Yao J, Guo Y, Yu D, Tian T, Zhou X, Shen H, et al. Functional genetic variations in cytotoxic T-lymphocyte antigen 4 and susceptibility to multiple types of cancer. Cancer Res. 2008; 68:7025–7034.
12. Antczak A, Pastuszak-Lewandoska D, Gorski P, Domanska D, Migdalska-Sek M, Czarnecka K, Nawrot E, Kordiak J, Brzezianska E. Ctla-4 expression and polymorphisms in lung tissue of patients with diagnosed non-small-cell lung cancer. Biomed Res Int. 2013; 2013:576486.
13. Shi YY, He L. SHEsis, a powerful software platform for analyses of linkage disequilibrium, haplotype construction, and genetic association at polymorphism loci. Cell Res. 2005; 15:97–98.
14. Geng R, Song F, Yang X, Sun P, Hu J, Zhu C, Zhu B, Fan W. Association between cytotoxic T lymphocyte antigen-4 +49A/G, -1722T/C, and -1661A/G polymorphisms and cancer risk: a meta-analysis. Tumour Biol. 2014; 35:3627–39.
15. Jones KA, Kadonaga JT, Rosenfeld PJ, Kelly TJ, Tjian R. A cellular DNA-binding protein that activates eukaryotic transcription and DNA replication. Cell. 1987; 48:79–89.
16. Zhu JM, Li BK, Chen GM, Feng CC, Cen H, Fan YG, Wang B, Pan HF, Ye DQ. CTLA-4 -1722T/C polymorphism and systemic lupus erythematosus susceptibility: a meta-analysis involving ten separate studies. Immunol Invest. 2013; 42:91–105.
17. Chen SL, Deng F, Jiang F, Liu JJ, Meng W. [Correlation between CTLA-4 gene polymorphism and systemic lupus erythematosus: a meta-analysis]. [Article in Chinese]. Xi Bao Yu Fen Zi Mian Yi Xue Za Zhi. 2012; 28:1320–23.
18. Liu J, Zhang H. -1722T/C polymorphism (rs733618) of CTLA-4 significantly associated with systemic lupus erythematosus (SLE): a comprehensive meta-analysis. Hum Immunol. 2013; 74:341–347.
19. Zhai JX, Zou LW, Zhang ZX, Fan WJ, Wang HY, Liu T, Ren Z, Dai RX, Ye D. CTLA-4 polymorphisms and systemic lupus erythematosus (SLE): a meta-analysis. Mol Biol Rep. 2013; 40:5213–5223.
20. Li D, Zhang Q, Xu F, Fu Z, Yuan W, Li D, Pang D. Association of CTLA-4 gene polymorphisms with sporadic breast cancer risk and clinical features in Han women of northeast China. Mol Cell Biochem. 2012; 364:283–290.
21. Tang W, Zhang S, Qiu H, Wang L, Sun B, Yin J, Gu H. Genetic variations in MTHFR and esophageal squamous cell carcinoma susceptibility in Chinese Han population. Med Oncol. 2014; 31:915.
22. Carlson CS, Eberle MA, Kruglyak L, Nickerson DA. Mapping complex disease loci in whole-genome association studies. Nature. 2004; 429:446–452.
23. Zheng L, Yin J, Wang L, Wang X, Shi Y, Shao A, Tang W, Ding G, Liu C, Chen S, Gu H. Interleukin 1B rs16944 G>A polymorphism was associated with a decreased risk of esophageal cancer in a Chinese population. Clin Biochem. 2013; 46:1469–1473.
24. Yin J, Wang L, Shi Y, Shao A, Tang W, Wang X, Ding G, Liu C, Chen S, Gu H. Interleukin 17A rs4711998 A>G polymorphism was associated with a decreased risk of esophageal cancer in a Chinese population. Dis Esophagus. 2014; 27:87–92.
25. Tang W, Wang Y, Chen S, Lin J, Chen B, Yu S, Chen Y, Gu H, Kang M. Investigation of Cytotoxic T-lymphocyte antigen 4 Polymorphisms in Gastric Cardia Adenocarcinoma. Scand J Immunol. 2016; 83:212–218.
26. Tang W, Qiu H, Ding H, Sun B, Wang L, Yin J, Gu H. Association between the STK15 F31I polymorphism and cancer susceptibility: a meta-analysis involving 43,626 subjects. PLoS One. 2013; 8:e82790.