
INTRODUCTION
Colorectal cancer (CRC) is believed to develop through the accumulation of genetic alterations that deregulate cell growth [1–3]. Sporadic and germline p53 mutations have been detected in multiple solid tumors including CRC [4]. However, only a subset of these mutant alleles has been proven to cause tumor progression and poor clinical outcomes [5, 6]. Missense point mutations that disrupt p53 functional domains result in its inactivation and are associated with chemoresistance and poor patient survival [7].
Germline mutations (single nucleotide polymorphisms [SNP]) have been reported in the coding region [8–11] and also in the intronic regions of p53 [12–20] with cancer risk. Among all these, codon 47 and 72 polymorphisms of p53 have been well characterized [9, 21]. The codon 72 polymorphism is a common alteration in the general population that results in either an arginine (R72) or a proline (P72) residue at position 72 in the proline-rich domain (residues 64–92) of the p53 protein, resulting in a marked change in its protein structure [10]. It has been reported that this region is required for the growth suppression and apoptosis mediated by p53 [22, 23].
Previous studies, in vivo and in vitro, have highlighted the functional difference between the P72 and R72 variants [21–24] of p53 such as different binding to components of the transcriptional machinery and different activation of transcription, but they did not differ in their ability to bind DNA. It has been reported that there was a significant association between the P72 and risk of cancer [25, 26], although the results with regard to most cancer diseases, including CRC remain inconclusive.
P72 was found to be preferentially mutated and associated with poor prognosis of CRC [26–29]. Furthermore, when compared with other known p53 polymorphisms, the P72 exhibits a higher level of frequency and correlates with cancer progression [30, 31]. However, its mechanistic role in tumor progression is unknown. Therefore, in this study, we evaluated the functional role of this frequently occurring polymorphism in CRC.
RESULTS
P72 phenotype of p53 induces cell survival and endothelial cell tubular formation in CRC
This study demonstrated that there was a significant increased cell survival in cells that express P72wt phenotype (p,.02) or mutant phenotypes (p < .05) compared to cells that express R72wt phenotype (Figure 1A and 1B). The P72wt or mutant phenotypes induce Human umbilical vein endothelial cells (HUVEC) to form networks of multiple tube-like structures, while conditioned medium from R72wt expressing Caco2 cells did not support tubular formation (Figure 1C). Morphological changes in Caco2 cells were analyzed at 12 h after transfection, and R72wt expressing Caco2 cells exhibited cellular shrinkage and irregular shape or growth suppression (data not shown).
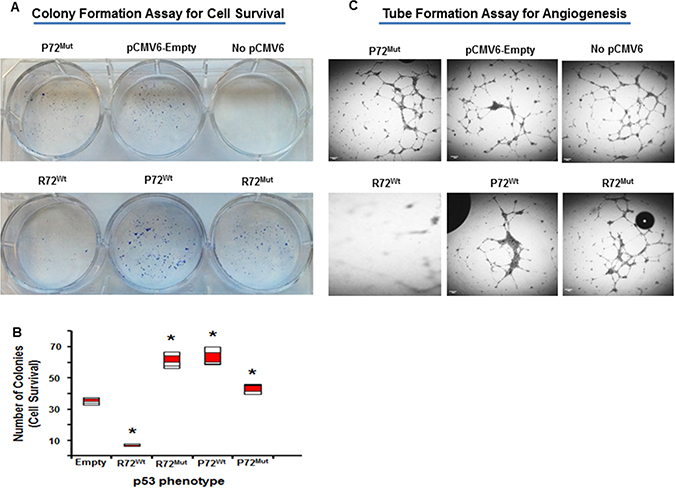
Figure 1: P72 phenotype of p53 induces cell survival and endothelial cell tubular formation. Increased cell survival in cells that express P72wt phenotype or mutant phenotypes compared to cells that express R72wt phenotype (A and B). Conditioned medium of P72wt or mutant phenotypes expressing cells induce HUVEC to form networks of multiple tube-like structures, while conditioned medium of R72wt expressing cells did not support tubule formation (C).
P72 phenotype is associated with abundance of tumor promoting phenotypes in CRC
Based on our recent findings that P72 expression in CRC has been found to be associated with CRC aggressiveness [29], we hypothesized that P72wt could induce expression of tumor promoting phenotypes in CRC. To evaluate expression of these phenotypes in cell based model, we analyzed the expression of the commonly used tumor markers phosphorylated NF-kB (p-NF-kB), phosphorylated STAT (p-STAT), CXCR4 and phosphorylated extracellular signal-regulated kinase (p-ERK) MAP kinase, by immunofluorescence. As shown in Figure 2, the expression of p-NF-kB, p-STAT, CXCR4 and p-ERK MAP kinase was found to be higher in the P72wt or mutant phenotypes cell model than in the vector-control or R72wt cell model.
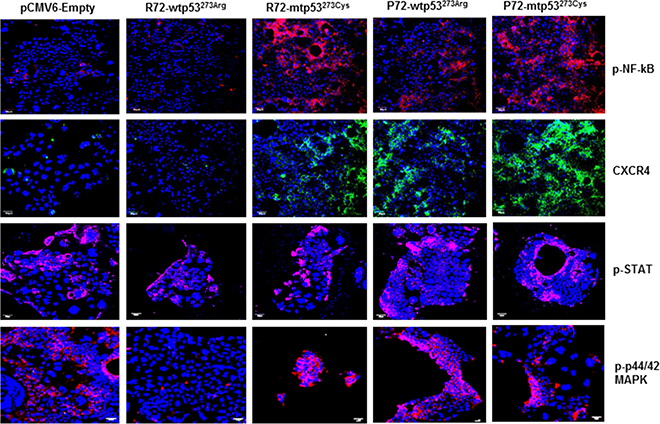
Figure 2: P72 phenotype of p53 is associated with abundance of tumor promoting phenotypes. The expression of p-NF-kB, p-STAT, CXCR4 and p-ERK was found to be higher in the cell model of P72wt or mutant phenotypes than in the vector-control or R72wt cell models.
P72 phenotype promotes EMT process in CRC
We next evaluated the effect of P72 phenotype on the development of EMT process. EMT is a phenotypic conversion that facilitates development of neoplasia, and is associated with tumor progression and metastasis [32]. During this process E-cadherin (Epithelial marker) is down regulated and vimentin, fibronectin, CD44 and phosphorylated glycogen synthase kinase-3β [p-GSK-3 β] (Mesenchymal markers) are up regulated. P72wt or mutant phenotype expressing cells analyzed via western blot analysis displayed decreased expression of the epithelial signature E-cadherin and increased expression of the mesenchymal signature vimentin, fibronectin, CD44 and p-GSK-3 β (Figure 3A and 3B). This pattern is more mesenchymal and less epithelial in nature. These results indicate that P72wt or mutant phenotypes could induce tumor progression through promoting the EMT process.
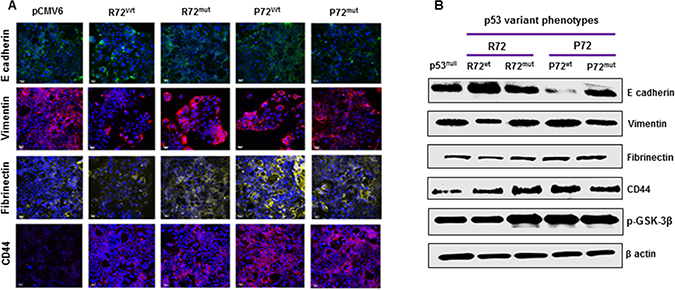
Figure 3: P72 phenotype promotes EMT process (A and B). P72wt or mutant phenotype expressing cells displayed decreased expression of the epithelial signature E-cadherin and increased expression of the mesenchymal signature vimentin, fibrinectin, CD44 and p-GSK-3β.
P72 phenotype promotes MAP kinase signaling pathway in CRC
The MAP kinase signaling is frequently activated in several cancers including CRC [33]. The activation of MAP kinase and the subsequent phosphorylation and activation of its downstream targets play an important role in promoting cell growth, proliferation and metastasis in cancer [34]. Molecular analyses revealed that P72wt or mutant phenotypes effectively induced the activation of p38 MAP kinase pathway. Up-regulation of phosphorylated SEK1/MKK4, upstream kinase of p38 MAPK (Figure 4A) has been found to be associated with P72wt or mutant phenotypes. Activation SEK1/MKK4 was accompanied by up-regulation of phosphorylated-MAPKAPK-2 (p-MAPKAPK-2) and phosphorylated-Hsp27 (p-HSP27), and phosphorylated-CREB (p-CREB) downstream targets of p38 MAPK (Figure 4A).
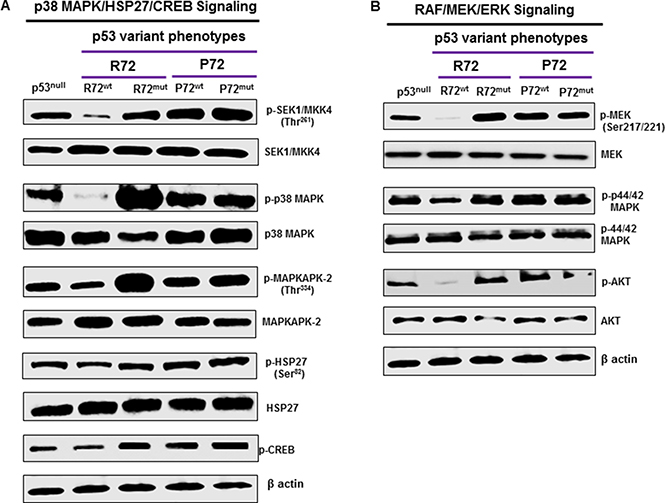
Figure 4: P72 phenotype promotes p38MAPK and RAF/MEK/ERK signaling. Molecular analyses revealed that P72wt or mutant phenotypes effectively induced the activation of p38 MAPK and RAF/MEK/ERK signaling (A and B). Up-regulation of phosphorylated SEK1/MKK4, upstream kinase of p38 MAPK has been found to be associated with P72wt or mutant phenotypes (A). Activation SEK1/MKK4 was accompanied by up-regulation of p-MAPKAPK-2, p-Hsp27 and p-CREB downstream targets of p38 MAPK (A). Suppression of RAF/MEK/ERK activation was significantly higher in cells that express P72wt or mutant phenotypes compared to cells that express R72wt phenotype. This suppression was accompanied by down-regulation of p-Akt (B).
P72 phenotype promotes RAF/MEK/ERK signaling pathway in CRC
Raf kinases are well characterized as key regulators of the MEK/ERK pathway [35] and activated through the RAF/MEK/ERK pathway. This pathway has an important role in cancer progression [36]. Activation of key proteins in the RAF/MEK/ERK pathway was determined by western blot analysis to assess the effect of P72wt or mutant phenotypes of p53 on this signaling pathway in CRC cells. Suppression of RAF/MEK/ERK activation was significantly higher in cells that express R72wt phenotype compared to cells that express P72wt or mutant phenotypes. This suppression was accompanied by down-regulation of phosphorylated Akt [p-Akt] (Figure 4B), a downstream target of RAF/MEK/ERK.
High frequency of codon 72 polymorphism of p53 in CRC
Analysis of p53 at codon 72 for the status of variant forms by genotyping revealed a higher frequency of Arg/Pro phenotypes (18/34, 53%) than Arg/Arg (9 of 34, 26%) or Pro/Pro (7 of 34, 21%) in these CRC; however, in this study homozygous Pro/Pro was observed more frequency compared to other previous studies (data not shown). Sequencing analysis of p53 at codon 72 for the status of variant forms by genotyping revealed that SW480 and WiDr tumors demonstrated homozygous for Pro/Pro, whereas HT29 and LS174T tumors demonstrated homozygous for Arg/Arg. The correlation of p53 codon 72 polymorphism statuses in cell line derived tumors based on molecular or clinical features is shown in Tables 1 and 2.
Table 1: Genetic or clinical features of 4 CRC cell lines
Sample ID |
p53codon 72 |
P53 Mut |
MSI St |
cMyc |
KRAS |
CIN |
Clinical Stage |
Race |
|---|---|---|---|---|---|---|---|---|
SW480 |
Pro/Pro |
R273H |
MSS |
+ |
G12V |
+ |
II B |
Caucasian |
WiDr |
Pro/Pro |
R273H |
MSS |
–a |
Wt |
+ |
–a |
- |
LS174T |
Arg/Arg |
Wt |
MSI |
+ |
G12D |
- |
IIB |
Caucasian |
HT29 |
Arg/Arg |
R273H |
MSS |
+ |
Wt |
+ |
–a |
Caucasian |
Abbreviations: Codon 72, p53 phenotype of codon 72 polymorphism; Pro/Pro, homozygous for proline phenotype at codon 72 of p53; Arg/Arg, homozygous for arginine phenotype at codon 72 of p53; p53 Mut, p53 mutational status. Wt, p53 wild type; MSI St, microsatellite instability status; MSS, microsatellite stable; MSI, microsatellite instability; –a, No publication on WiDr information on cMyc and clinical stage was reported; However WiDr and HT 29 are identical cell lines although status of codon 72 of p53 is different; CIN, chromosomal instability pathway. Genetic or clinical features of all these cell lines obtained from published source.
Table 2: Phenotypic expression of different markers in 4 CRC cell lines
Sample ID |
p53codon 72 |
P53 Mut |
WAF1% |
MDM2% |
BAX% |
V14_3_3_s |
AIP% |
GADD45% |
NOXA% |
P53R2% |
|---|---|---|---|---|---|---|---|---|---|---|
SW480 |
Pro/Pro |
R273H/P309S |
43.57 |
103.74 |
180.39 |
179.76 |
136.41 |
97.42 |
182.03 |
165.94 |
WiDr |
Pro/Pro |
R273H |
1.01 |
0.00 |
2.42 |
0.00 |
0.00 |
0.00 |
0.00 |
15.97 |
LS174T |
Arg/Arg |
Wt |
–a |
–a |
–a |
–a |
–a |
–a |
–a |
–a |
HT29 |
Arg/Arg |
R273H |
1.01 |
0.00 |
2.42 |
0.00 |
0.00 |
0.00 |
0.00 |
15.97 |
Abbreviations: Codon 72, p53 phenotype of codon 72 polymorphism; Pro/Pro, homozygous for proline phenotype at codon 72 of p53; Arg/Arg, homozygous for arginine phenotype at codon 72 of p53; p53 Mut, p53 mutational status. Wt, p53 wild type; –a, No publication on LS174T information on phenotype was reported; However WiDr and HT 29 are identical cell lines although status of codon 72 of p53 is different. Phenotypic expression of different markers for all these cell lines obtained from published source.
CREB is progressively expressed in advanced disease
The expression of phospho-CREB in paired primary and metastatic lesions of CRC obtained from xenografts was compared. The expression of phospho-CREB was substantially higher in metastatic tumors than in the corresponding non-metastatic tumors (Figures 5A and 6A). This suggests that phospho-CREB is progressively expressed as malignant disease becomes more advanced, thus there appears to be a direct association with tumor progression and metastasis.
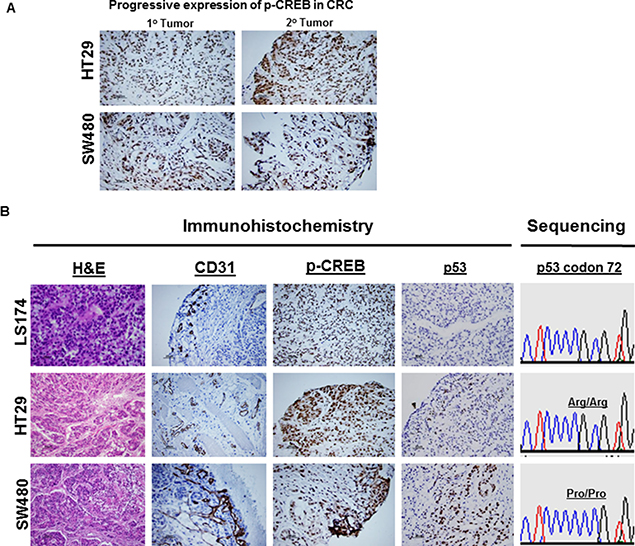
Figure 5: CREB expression in tumor xenografts by IHC. IHC confirmed the presence of CREB expression in CRC (HT29) and (SW480) (A). Compared to primary CRC lesion, the expression of CREB was markedly increased in metastatic CRC lesions (A). IHC confirmed the expression status of CD31, CREB, and p53 in CRC (HT29) and (SW480) (B). Compared to R72 CRC, the expression of CD31 (tumor angiogenesis) or CREB was markedly increased in P72 CRC. Sequencing analysis revealed that LS174T or HT29 tumors exhibit homozygous for Arg/Arg, whereas SW480 tumor exhibits homozygous for Pro/Pro (B). IHC analysis revealed that LS174T tumor was found to be negative for p53 expression (p53 wild type) (B), whereas HT29 or SW480 tumors were found to be positive for p53 expression (p53 mutants) (B).
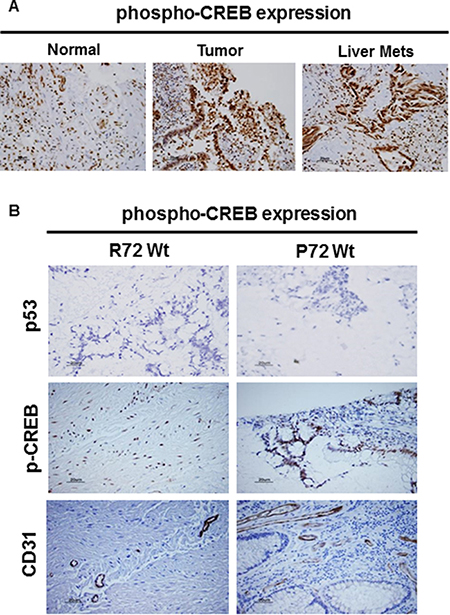
Figure 6: CREB expression in CRC by IHC. Immunostaining confirmed the presence of CREB expression in CRC (A). Compared to normal, the expression of CREB was markedly increased in primary CRC lesion or metastatic CRC lesions (A). (B) IHC confirmed the expression status of CD31, CREB, and p53 in CRC (B). Compared to R72 CRC, the expression of CD31 (tumor angiogenesis) or CREB was markedly increased in P72 CRC. IHC analysis revealed that tumors were found to be negative for p53 expression (p53 wild type) (B).
P72 phenotype promotes activation of CREB and angiogenesis in tumor xenografts and CRC tissues
CREB has been found to be a critical regulator of cell differentiation and involved in tumor progression and prognosis, supporting its role as a proto-oncogene [37] CREB can be activated through phosphorylation by a number of kinases, including Akt, p90Rsk, protein kinase A, and calcium/calmodulin-dependent kinases and controls genes that promotes tumor progression including Egr-1, Bcl-2 family members, and cyclins. Over-activation of CREB was observed in cancer tissues from patients with prostate cancer [38–41], non-small-cell lung cancer [42] and acute leukemia [43], while down-regulation of CREB in several distinct cancer cell lines resulted in inhibition of cell proliferation and induction of apoptosis, suggesting that CREB may be a promising target for cancer therapy [44]. Given the potential roles of CREB in tumorigenesis, tumor xenografts and CRC tissues were then used to study whether P72 phenotype of p53 associated with its activation. We observed that the tumors expressing P72 exhibited increased CREB activation (Figures 5B and 6B). Furthermore, it was also found that tumors with P72 had well established vascularity, while R72 tumors had poor vascularization. Indeed, the mean MVD was higher in tumors from P72 than in R72 tumors (Figures 5B and 6B).
DISCUSSION
This study demonstrated that there was a significant increased cell survival in cells that express P72wt phenotype or mutant phenotypes compared to cells that express R72wt phenotype. The P72wt or mutant promoted the formation of networks of multiple tube-like structures and well established vascularity. The mean MVD was higher in tumors from P72 than R72. R72wt expressing Caco2 cells exhibited cellular shrinkage and irregular shape or growth suppression. Western blot analyses revealed that P72wt or mutant phenotypes effectively induced the activation of p38 MAPK/HSP/CREB pathway. Tumors expressing P72 exhibited increased CREB activation. The expression of phospho-CREB was substantially higher in metastatic tumors than in the corresponding primary tumors. Furthermore, suppression of RAF/MEK/ERK activation was significantly higher in cells that express R72wt phenotype compared to cells that express P72wt or mutant phenotypes. This suppression was accompanied by down-regulation of phosphorylated Akt [p-Akt]. The expression of P72wt or mutant phenotypes displayed decreased expression of E cadherin (loss of epithelial nature) and/or an increased expression of vimentin, fibrinectin, CD44 and p-GSK-3β (gain of mesenchymal nature).
The p53 gene, like the Rb gene, is a tumor suppressor gene, and involved in suppressing tumor progression [45]. Mutations in p53 are found in several cancers including CRC [46, 4], and contribute to the complex network of molecular events leading to development of tumor promoting phenotype [47]. More than 85% of known cancer-related p53 mutations are missense mutations which result in the disruption of p53 conformation [48, 29]. These consequences might contribute to tumor progression and to a poor prognosis. In agreement with these results, the present study shows a significant increased cell survival in cells that express P72wt phenotype or mutant phenotypes compared to cells that express R72wt phenotype. The P72wt or mutant phenotypes induce the formation of networks of multiple tube-like structures related to tumor angiogenesis. Immunostaining analyses revealed that P72wt or mutant phenotypes effectively induced the activation of NF-kB, STAT phenotypes and expression of CXCR4 and CD44 phenotypes. Activation or expression of these phenotypes is the most common event in solid human cancers, including CRC and it is found to be associated with tumor progression and an independent predictor of poor survival in tumors [49–52]. Thus, it is important to explore new drugs that target P72wt or mutant phenotypes which could have a profound impact as a therapeutic agent to suppress tumor progression.
We have shown that P72wt phenotype exhibited an increased incidence of p53 mutations, specifically of the disruptive type, and was associated with nodal metastasis and short overall survival [29]. This suggests that P72 may induce cellular events that favor tumor progression in CRC. The p38MAPK and RAF/MEK/ERK signaling are two of the most important molecular mechanisms that are associated with tumor angiogenesis and cancer cell survival [53, 54]. Increased expression of proteins that are associated with p38MAPK and RAF/MEK/ERK signaling induces tumor viability or metastasis through enhanced proliferation of cells by activating molecular pathways [55], such as accelerating vascularization by activating VEGF [56]. We demonstrate here that the expression of P72wt or mutant phenotypes in CRC cells is associated with increased activation of p38MAPK kinase and RAF/MEK/ERK signaling. Increased expression of p38MAPK and RAF/MEK/ERK signaling correlates with increased tumor angiogenesis, cell survival, and tumor growth rate, which impairs patient survival in diverse cancers [33]. CREB has been found to be a critical regulator of cell differentiation and involved in tumor progression and prognosis, supporting its role as a proto-oncogene [37]. CREB has been found to be activated by a number of kinases, and controls a gene that promotes tumor progression. Activation of CREB has been observed in cancers of prostate [38], breast [39], non-small-cell lung [46] and acute leukemia [43]. It has been shown that down-regulation of CREB in cancer cells resulted in inhibition of cell proliferation and induction of apoptosis, suggesting that CREB may be a promising target for cancer therapy [44]. Since P72wt of p53 is the most commonly expressed phenotype in cancer and correlated with p38 MAPK/HSP27/CREB signaling, targeting of P72wt of p53 by an appropriate therapeutic agent may be a means of controlling the tumor progression.
EMT, the change from an epithelial phenotype into a mesenchymal phenotype, is an important characteristic of cancer stem cells [37, 57, 58]. EMT phenotype has been found to be associated with p53 mutations that demonstrate gain of oncogenic function [59]. The present study demonstrated a significant association between P72wt or mutant phenotypes and induction of EMT. Therefore, P72wt or mutant phenotypes might be a key regulators of the EMT process through which it could activate signals associated with tumor progression. This data strongly suggest that P72wt or mutant phenotypes are potential targets in the inhibition of tumor angiogenesis and oncogenic EMT process in CRC.
Although additional studies will be warranted to elucidate the molecular mechanisms that are associated with P72wt or mutant phenotypes of p53, our results suggest that the P72 polymorphism of p53 in CRC is a gain of function alteration leading to activation of tumor promoting phenotype. The possibility of P72 blockade may be considered in patients with CRC that are unresponsive to conventional treatments. This is the subject of ongoing research in this area that will be further addressed in future communications.
MATERIALS AND METHODS
Cell culture, transfection and colony formation assay
CRC cell line Caco2, which does not express p53 was obtained from American Type Culture Collection (ATCC, Manassas, VA, USA). We maintained these cells at 37°C with 8% CO2 in Dulbecco Modified Eagle Medium with 4500 mg/L of D-glucose, 4 mM glutamine, 1 mM sodium pyruvate, 100 U/mL of penicillin, 100 μg/mL of streptomycin, 10 μg/mL of transferrin, 10 mM 4-(2-hydroxyethyl)-1-piperazineethanesulfonic acid (pH 7.4), and 3.7 g/L of sodium bicarbonate, supplemented with 10% fetal bovine serum. All studies were performed on the cells within 15 passages. Plasmids (pCMV6) that express different phenotypes of p53 [p53 wild type (wt) at codon 72 (R72wt), R72wt with mutation at codon 273 cysteine (R72273Cys), p53 mutation at codon 72 (P72wt) and P72wt with mutation at codon 273 (P72273Cys)] were constructed. Other CRC cell lines also used in this study (Tables 1 and 2).
Caco2 cells were transiently transfected with pCMV control vector or pCMV-p53 wt or mutant phenotypes expressing vector using TurboFect transfection reagent (Fisher Thermo Scientific, Waltham, MA, USA) for the indicated times according to the manufacturer’s instructions. Briefly, 1 ×10⁵ cells were seeded into six-well plates containing medium and incubated overnight. For each well, 4 μg DNA (pCMV or pCMV-p53wt or p53mut) was mixed with 100 μL of RPMI-1640. The mixture was then combined with a solution of 2 μL of TurboFect transfection reagent (Fisher Thermo Scientific, Waltham, MA, USA). After a 20-min incubation period at room temperature, the mixture was applied to the cells in final volume of 2 ml. After transfection, the expression of p53 phenotypes was confirmed by western blot analysis. Clones resistant to geneticin were assessed for cell survival; colonies were stained with 0.5% crystal violet and counted.
Tube formation assay
After thawing Matrigel (EMD Millipore, Billerica, MA, USA) on ice the 96-well plate coated with 50 μL Matrigel in each well was then incubated at 37oC for 30-min to allow the Matrigel to polymerize. To examine the effect of p53 phenotype on tumor cell-induced tube formation of HUVECs (ATCC), a conditioned medium was collected from R72wt or mutant phenotypes transfected Caco2 cells as indicated and used as the growth medium for HUVECs. A total of 1 × 10⁴ HUVECs were seeded into each well that had conditioned medium. Cells were then incubated for 8 h to allow the formation of tube-like structures. There are three parameters by which capillary structure formation can be considered: capillary length, number of capillaries or branched tubes.
Western analysis
After post transfection, Caco2 cells were prepared for western blot by incubating with lysis solution (1.0% Nonidet P-40; 50 mM Tris-HCl; pH 7.5; 20 mM EDTA buffer) (Sigma-Aldrich, St. Louis, MO, USA) at room temperature for 5-min. The lysates were centrifuged for 20-min at 12,000 rpm at 4°C. The supernatants were collected and stored at −70°C. Protein concentrations were determined with the Bradford assay kit (Bio-Rad Laboratories, Hercules, CA, USA). Portions of each sample (20 μl) were separated by SDS-PAGE on a 4–20% Tris-HCl Criterion precast gel (Bio-Rad Laboratories) and electrophoretically transferred to polyvinylidene difluoride (PVDF) membranes (Life Technologies, Grand Island, NY, USA). The membranes were washed in 1× Tris-buffered saline (TBS) for 5-min, and then blocked with 5% nonfat milk in 1× TTBS (1× TBS and 0.1% Tween 20) for 1 h by shaking at room temperature. For detection of expression status of protein in lysates, a rabbit polyclonal anti-human specific antibody was used. This was accomplished by shaking the membranes at 4oC overnight, as directed by the manufacturer, followed by application of horseradish peroxidase (HRP)-conjugated goat anti-rabbit antibody. Protein bands were detected by SuperSignal West Femto Maximum Sensitivity Substrate Reagent (Fisher Scientific, Pittsburgh, PA, USA), followed by exposure on Odyssey Fc Dual-Mode Imaging System (LICOR, Lincoln, NE, USA). Images were scanned into Adobe Photoshop 5.0.2. After detection of specific protein, the blots were stripped and hybridized with a polyclonal rabbit anti-β-actin, then probed with the HRP-conjugated anti-rabbit antibody for normalization. Details of all antibodies used in this study are shown in Table 3.
Table 3: Details of primary antibody used in this study
S. No |
Antibody |
Catalog# |
Host |
Clonality |
Company |
Dilutions* |
Dilutions¶ |
|---|---|---|---|---|---|---|---|
1 |
CXCR4 |
NB600-786 |
Rabbit |
Polyclonal |
Novus Bio |
1:500 |
1:1000 |
2 |
β-actin |
4967S |
Rabbit |
Polyclonal |
CST |
- |
1:1000 |
3 |
VEGF-A |
Sc-507 |
Rabbit |
Polyclonal |
SCB |
1:500 |
1:1000 |
4 |
CD31 |
Ab28364 |
Rabbit |
Polyclonal |
abcam |
1:200 |
- |
5 |
E-cadherin |
Sc-7870 |
Rabbit |
Polyclonal |
SCB |
1:200 |
1:1000 |
6 |
Vimentin |
3932S |
Rabbit |
Polyclonal |
CST |
1:500 |
1:1000 |
7 |
Fibrinectin |
F3648 |
Rabbit |
Polyclonal |
Sigma-Aldrich |
- |
1:1000 |
8 |
GSK3-3β |
9323P |
Rabbit |
Monoclonal |
CST |
- |
1:1000 |
9 |
p53 |
628202 |
Mouse |
Monoclonal |
BioLegend |
1:200 |
1:1000 |
10 |
Akt |
9271 |
Rabbit |
Polyclonal |
CST |
1:25 |
1:1000 |
11 |
Erk |
9106 |
Mouse |
Monoclonal |
CST |
1;100 |
1:1000 |
12 |
CREB |
9198 |
Rabbit |
Monoclonal |
CST |
1:200 |
1:200 |
13 |
Hsp27 |
9709P |
Rabbit |
Monoclonal |
CST |
- |
1:200 |
14 |
Stat3 |
9145 |
Rabbit |
Monoclonal |
CST |
1:100 |
- |
15 |
MapKaPK-2 |
3007P |
Rabbit |
Monoclonal |
CST |
- |
1:200 |
16 |
SEK1/MKK4 |
9156 |
Rabbit |
Polyclonal |
CST |
- |
1:1000 |
17 |
p38 MAPK |
9211 |
Rabbit |
Polyclonal |
CST |
- |
1:1000 |
18 |
MEK |
9121 |
Rabbit |
Polyclonal |
CST |
- |
1:1000 |
IHC; Immunohistochemistry, IF; Immunofluorescence, WB; Western Blot, Novus Bio; Novus Biologicals, CST; Cell Signaling Technology, SCB; Santa Cruz Biotechnology, *; Dilutions for IHC/IF, ¶; Dilutions for WB.
Immunofluorescence
Caco2 cells were prepared by plating cells (1 × 10⁵) on glass slides with poly-D-lysine (Becton Dickinson, Franklin Lakes, NJ, USA) and then allowing cells to attach overnight. After 48 h of post transfection, cells were subsequently washed with 1xPBS and fixed with formalin free Zinc fixative (Becton Dickinson) for 30-min and washed again. Cells were then permeabilized with 1 × PBS containing 0.1% Triton X-100 for 5-min and washed with 1 × PBS. For immunofluorescence analysis, blocking was performed for cells, with 200 μL of serum blocking solution (Zyagen, San Diego, CA, USA) followed by incubation at room temperature for 60-min in a humidified chamber. The slides of the samples were incubated with 200 μL (2 μg/mL) of rabbit polyclonal anti-human specific antibody for overnight at 4°C at room temperature. Samples were washed 3 times with 1xPBS for 5-min each then incubated with 200 μL of biotinylated secondary antibody solution (Zyagen) for 30 min at room temperature. After washing with 1xPBS, samples were covered with 200 μL of streptavidin-FITC conjugate solution (Zyagen) and incubated for 30-min at room temperature. Samples were washed 3 times again with 1 × PBS, then counterstained with 4′, 6-Diamidino-2-Phenylindole, Dilactate (DAPI) solution (Zyagen) for 2-min. Samples were washed 3 times with 1 × PBS for 5-min each and covered with coverslip on to slides using anti-fade fluorescent mounting medium (Zyagen). Confocal images were acquired using the Olympus FluoView FV1000 Confocal Laser Scanning Microscope (Olympus America) configured on a fully automated inverted Ix81microscope using a 40× UPLFLN oil (NA1.3) objective. Negative control without primary antibody for each phenotype was used to show its specificity.
Animals and tumor xenografts
Severe combined immunodeficient female (SCID) mice were purchased from Taconic Farm (Taconic, NY, USA) at four weeks of age and quarantined for one week prior to use. The mice were inoculated with 2-D cultures of CRC (HT29, SW480, WiDr and LS174T) cells to establish primary tumors (tumor xenografts). All food, water, and bedding were sterilized by autoclaving. The mice resided in micro-filtered cages in a room designated for immune compromised mice. On a daily basis the animals were evaluated regarding health status and tumor growth. Body weight, nutritional intake, general activity level, and ruffling of the mice coats were used to determine the health status. All surgical procedures were done under the laminar flow hood and with strictly sterile protocols. A liquid sterilant, exspor (Alcide Co., Norwalk, CT, USA), was used to sanitize the researcher’s gloves and the mouse coat at the site of planned surgery. All surgical procedures were conducted in accordance with the guidelines and under approvals of MSU's IACUC. Tumor xenografts were stored in liquid nitrogen and used for molecular analysis based on codon 72 polymorphism of p53.
Metastasis model
SCID mouse model was used to establish the hepatic metastatic lesion as reported in our earlier version [60]. Hepatic metastasis was produced injecting HT29 and SW480 cells, these lines derived from a primary carcinoma of the colon, into the spleen with the cell count (1 × 10⁶ cells/0.1 cc). Briefly, splenic injections were done by having the spleens extracorporeally injected under direct vision and then replacing the spleen in its usual anatomical location. Livers were removed from mice at necropsy. The number of gross lesions in the liver was counted by use of a magnification lens. These lesions and corresponding primary tumors were used to assess progressive expression status of phospho-CREB.
CRC tissue procurement and immunocytochemistry
CRC specimens are collected directly from pathology immediately following surgical resection. These specimens are collected under a protocol approved by the IRB of Michigan State University and Morehouse School of Medicine. Sequencing analysis for codon 72 polymorphism of p53 was performed using genomic DNA purified from CRCs and corresponding normal tissue specimens or tumor xenografts of parent CRC cells as previously described [29].
Histological staining and immunocytochemistry (IHC) were performed as previously described [31]. Paraffin blocks for tumors were prepared with standard histopathology methods. Briefly, tumors were collected, washed twice in 1xPBS, and fixed in formalin free Zinc fixative for 30-min, then washed again. These structures were subsequently embedded in paraffin blocks and sectioned at 5 micron thickness. Deparaffinization of tissue sections was performed with xylene followed by rehydration through a series of ethanol solutions (100%, 95%, 80% and 50%). Sections from tumors were evaluated for phenotypic expression of various cancer critical proteins. The technique used for this was IHC, as previously described [31] using antibodies that exhibit high specificity and affinity. In brief, tissue sections, 5-μ thick, from tissue blocks that are representative of benign and malignant tumor components were incubated with specific 1° antibodies for p53, phospho-CREB and CD31, followed by 2° antibodies and 3′, 3-diaminobenzidine to detect the antigen and antibody complex. After IHC staining, the sections were counterstained with hematoxylin. Appropriate positive and negative control slides was included in each staining run and maintained for quality control. IHC staining was evaluated manually by at least two investigators (Drs. Bumpers and Katkoori). Staining was analyzed in the uninvolved mucosa and in the tumor components by assessing ≥ 500 cells. A semiquantitative immunostaining scoring system (ISS) was utilized as previously reported [61–63]. The slides were evaluated under blinded conditions and estimated the proportion of cells stained on a scale of 0 to +3 (< 5% = 0, 5–25% = +1, 25–50% = +2 and > 50% = +3). The scores derived were combined to obtain the mean ISS. Categorization of cases into low- and high-expressers of, p53, phospho-CREB and CD31 (binarization) was accomplished by pooling cases with IHC scores “0 and +1” and “+2 and +3”, respectively. A chi-square test was used to compare the distribution of phenotypic expression of phospho-CREB.
Tumor angiogenesis on tumor xenografts developed from parent CRC cells (HT29, SW480, and LS174T) or sections of patient tissue specimens as previously described [60] was performed based on immunostaining of endothelial marker (CD31). Microvessel density (MVD) was determined by light microscopy in areas of invasive tumor containing the highest numbers of microvessels per area. Individual microvessel counts were made on a 200× field within the areas of most intense tumor neovascularization.
Statistical analysis
Statistical analysis was performed using the Student’s two-tailed t-test, for comparisons. Differences were deemed statistically significant at p ≤ 0.05.
CONFLICTS OF INTEREST
None.
REFERENCES
1. Vogelstein B, Fearon ER, Hamilton SR, Kern SE, Preisinger AC, Leppert M, Nakamura Y, White R, Smits AM, Bos JL. Genetic alterations during colorectal-tumor development. N Engl J Med. 1988; 319:525–32.
2. Popat S, Houlston RS. A systematic review and meta-analysis of the relationship between chromosome 18q genotype, DCC status and colorectal cancer prognosis. Eur J Cancer. 2005; 41:2060–2070.
3. Jass JR, Young J, Leggett BA. Evolution of colorectal cancer: change of pace and change of direction. J Gastroenterol Hepatol. 2002; 17:17–26.
4. Greenblatt MS, Bennett WP, Hollstein M, Harris CC. Mutations in the p53 tumor suppressor gene: clues to cancer etiology and molecular pathogenesis. Cancer Res. 1994; 54: 855–78.
5. Børresen-Dale AL, Lothe RA, Meling GI, Hainaut P, Rognum TO, Skovlund E. TP53 and long-term prognosis in colorectal cancer: mutations in the L3 zinc-binding domain predict poor survival. Clin Cancer Res. 1998; 4:203–10.
6. Joerger AC, Fersht AR. Structure-function-rescue: the diverse nature of common p53 cancer mutants. Oncogene. 2007; 26:2226–42.
7. Aas T, Børresen AL, Geisler S, Smith-Sørensen B, Johnsen H, Varhaug JE, Akslen LA, Lønning PE. Specific P53 mutations are associated with de novo resistance to doxorubicin in breast cancer patients. Nat Med. 1996; 2: 811–4.
8. Vos M, Adams CH, Victor TC, van Helden PD. Polymorphisms and mutations found in the regions flanking exons 5 to 8 of the TP53 gene in a population at high risk for esophageal cancer in South Africa. Cancer Genet Cytogenet. 2003; 140:23–30.
9. Felley-Bosco E, Weston A, Cawley HM, Bennett WP, Harris CC. Functional studies of a germ-line polymorphism at codon 47 within the p53 gene. Am J Hum Genet. 1993; 53:752–9.
10. Matlashewski GJ, Tuck S, Pim D, Lamb P, Schneider J, Crawford LV. Primary structure polymorphism at amino acid residue 72 of human p53. Mol Cell Biol. 1987; 7:961–3.
11. Carbone D, Chiba I, Mitsudomi T. Polymorphism at codon 213 within the p53 gene. Oncogene. 1991; 6:1691–2.
12. Buchman VL, Chumakov PM, Ninkina NN, Samarina OP, Georgiev GP. A variation in the structure of the protein-coding region of the human p53 gene. Gene. 1988; 70: 245–52.
13. Futreal PA, Barrett JC, Wiseman RW. An Alu polymorphism intragenic to the TP53 gene. Nucleic Acids Res. 1991; 19:6977.
14. Oliva MR, Saez GT, Latres E, Cordon-Cardo C. A new polymorphic site in intron 2 of TP53 characterizes LOH in human tumors by PCR-SSCP. Diagn Mol Pathol. 1995; 4: 54–8.
15. Lazar V, Hazard F, Bertin F, Janin N, Bellet D, Bressac B. Simple sequence repeat polymorphism within the p53 gene. Oncogene. 1993; 8:1703–5.
16. Chumakov PM, Jenkins JR. BstNI/NciI polymorphism of the human p53 gene (TP53). Nucleic Acids Res. 1991; 19:6969.
17. McDaniel T, Carbone D, Takahashi T, Chumakov P, Chang EH, Pirollo KF, Yin J, Huang Y, Meltzer SJ. The MspI polymorphism in intron 6 of p53 (TP53) detected by digestion of PCR products. Nucleic Acids Res. 1991; 19:4796.
18. Prosser J, Condie A. Biallelic ApaI polymorphism of the human p53 gene (TP53). Nucleic Acids Res. 1991; 19: 4799.
19. Graf J, Merk B, Maurer U, Müller E, Bergmann L. Identification of novel polymorphisms in intron 7 of the human p53 gene in acute myeloid leukemia and healthy donors. Leuk Lymphoma. 2001; 41:655–8.
20. Graziani D, Romagnoli S, Cassani B, Alfano RM, Roncalli M, Coggi G. An Ava I polymorphism in the TP53 gene. Mol Cell Probes. 1999; 13:393–5.
21. Dumont P, Leu JI, Della Pietra AC 3rd, George DL, Murphy M. The codon 72 polymorphic variants of p53 have markedly different apoptotic potential. Nat Genet. 2003; 33: 357–65.
22. Frank AK, Leu JI, Zhou Y, Devarajan K, Nedelko T, Klein-Szanto A, Hollstein M, Murphy ME. The codon 72 polymorphism of p53 regulates interaction with NF-{kappa} B and transactivation of genes involved in immunity and inflammation. Mol Cell Biol. 2011; 31: 1201–13.
23. Jeong BS, Hu W, Belyi V, Rabadan R, Levine AJ. Differential levels of transcription of p53-regulated genes by the arginine/proline polymorphism: p53 with arginine at codon 72 favors apoptosis. FASEB J. 2010; 24:1347–53.
24. Pim D, Banks L. p53 polymorphic variants at codon 72 exerts different effects on cell cycle progression. Int J Cancer. 2004; 108:196–9.
25. Zeng XT, Luo W, Geng PL, Guo Y, Niu YM, Leng WD. Association between the TP53 codon 72 polymorphism and risk of oral squamous cell carcinoma in Asians: a meta-analysis. BMC Cancer. 2014; 14:469.
26. Shao Y, Tan W, Zhang S. P53 gene codon 72 polymorphism and risk of esophageal squamous cell carcinoma: a case/control study in a Chinese population. Dis Esophagus. 2008; 21:139–43.
27. Langerød A, Bukholm IR, Bregård A, Lønning PE, Andersen TI, Rognum TO, Meling GI, Lothe RA, Børresen-Dale AL. The TP53 codon 72 polymorphism may affect the function of TP53 mutations in breast carcinomas but not in colorectal carcinomas. Cancer Epidemiol Biomarkers Prev. 2002; 11:1684–8.
28. Hu Y, McDermott MP, Ahrendt SA. The p53 codon 72 proline allele is associated with p53 gene mutations in non-small cell lung cancer. Clin Cancer Res. 2005; 11:2502–9.
29. Katkoori VR, Jia X, Shanmugam C, Wan W, Meleth S, Bumpers H, Grizzle WE, Manne U. Prognostic significance of p53 codon 72 polymorphism differs with race in colorectal adenocarcinoma. Clin Cancer Res. 2009; 15: 2406–16.
30. Lung FW, Lee TM, Shu BC, Chang FH. p53 codon 72 polymorphism and susceptibility malignancy of colorectal cancer in Taiwan. J Cancer Res Clin Oncol. 2004; 130:728–32.
31. Katkoori VR, Shanmugam C, Jia X, Vitta SP, Sthanam M, Callens T, Messiaen L, Chen D, Zhang B, Bumpers HL, Samuel T, Manne U. Prognostic significance and gene expression profiles of p53 mutations in microsatellite-stable stage III colorectal adenocarcinomas. PLoS One. 2012; 7:e30020.
32. Kalluri R, Weinberg RA. The basics of epithelial-mesenchymal transition. J Clin Invest. 2009; 119:1420–8.
33. Dhillon AS, Hagan S, Rath O, Kolch W. MAP kinase signalling pathways in cancer. Oncogene. 2007; 26: 3279–90.
34. Santen RJ, Song RX, McPherson R, Kumar R, Adam L, Jeng MH, Yue W. The role of mitogen-activated protein (MAP) kinase in breast cancer. J Steroid Biochem Mol Biol. 2002; 80:239–56.
35. Lavoie H, Therrien M. Regulation of RAF protein kinases in ERK signalling. Nat Rev Mol Cell Biol. 2015; 16:281–98.
36. McCubrey JA, Steelman LS, Chappell WH, Abrams SL, Wong EW, Chang F, Lehmann B, Terrian DM, Milella M, Tafuri A, Stivala F, Libra M, Basecke J, et al. Roles of the Raf/MEK/ERK pathway in cell growth, malignant transformation and drug resistance. Biochim Biophys Acta. 2007; 1773:1263–84.
37. Sakamoto KM, Frank DA. CREB in the pathophysiology of cancer: implications for targeting transcription factors for cancer therapy. Clin Cancer Res. 2009; 15:2583–7.
38. Wu D, Zhau HE, Huang WC, Iqbal S, Habib FK, Sartor O, Cvitanovic L, Marshall FF, Xu Z, Chung LW. cAMP-responsive element-binding protein regulates vascular endothelial growth factor expression: implication in human prostate cancer bone metastasis. Oncogene. 2007; 26: 5070–7.
39. Chhabra A, Fernando H, Watkins G, Mansel RE, Jiang WG. Expression of transcription factor CREB1 in human breast cancer and its correlation with prognosis. Oncol Rep. 2007; 18:953–8.
40. Abramovitch R, Tavor E, Jacob-Hirsch J, Zeira E, Amariglio N, Pappo O, Rechavi G, Galun E, Honigman A. A pivotal role of cyclic AMP-responsive element binding protein in tumor progression. Cancer Res 2004; 64:1338–46.
41. Meyuhas R, Pikarsky E, Tavor E, Klar A, Abramovitch R, Hochman J, Lago TG, Honigman A. A Key role for cyclic AMP-responsive element binding protein in hypoxia-mediated activation of the angiogenesis factor CCN1 (CYR61) in Tumor cells. Mol Cancer Res 2008; 6:1397–409.
42. Seo HS, Liu DD, Bekele BN, Kim MK, Pisters K, Lippman SM, Wistuba II, Koo JS. Cyclic AMP response element-binding protein overexpression: a feature associated with negative prognosis in never smokers with non-small cell lung cancer. Cancer Res. 2008; 68:6065–73.
43. Shankar DB, Cheng JC, Kinjo K, Federman N, Moore TB, Gill A, Rao NP, Landaw EM, Sakamoto KM. The role of CREB as a proto-oncogene in hematopoiesis and in acute myeloid leukemia. Cancer Cell. 2005; 7:351–62.
44. Daniel P, Filiz G, Brown DV, Hollande F, Gonzales M, D'Abaco G, Papalexis N, Phillips WA, Malaterre J, Ramsay RG, Mantamadiotis T. Selective CREB-dependent cyclin expression mediated by the PI3K and MAPK pathways supports glioma cell proliferation. Oncogenesis. 2014; 3:e108.
45. Rivlin N, Brosh R, Oren M, Rotter V. Mutations in the p53 Tumor Suppressor Gene: Important Milestones at the Various Steps of Tumorigenesis. Genes Cancer. 2011; 2: 466–74. http://doi.org/10.1177/1947601911408889.
46. Baker SJ, Fearon ER, Nigro JM, Hamilton SR, Preisinger AC, Jessup JM, vanTuinen P, Ledbetter DH, Barker DF, Nakamura Y, White R, Vogelstein B. Chromosome 17 deletions and p53 gene mutations in colorectal carcinomas. Science. 1989; 244:217–21.
47. van Oijen MG, Slootweg PJ. Gain-of-function mutations in the tumor suppressor gene p53. Clin Cancer Res. 2000; 6: 2138–45.
48. Freed-Pastor WA, Prives C. Mutant p53: one name, many proteins. Genes Dev. 2012; 26:1268–86.
49. Gasparian AV, Yao YJ, Kowalczyk D, Lyakh LA, Karseladze A, Slaga TJ, Budunova IV. The role of IKK in constitutive activation of NF-kappaB transcription factor in prostate carcinoma cells. J Cell Sci. 2002; 115:141–51.
50. Frank DA. Transcription factor STAT3 as a prognostic marker and therapeutic target in cancer. J Clin Oncol. 2013; 31:4560–1.
51. Teicher BA, Fricker SP. CXCL12 (SDF-1)/CXCR4 pathway in cancer. Clin Cancer Res. 2010; 16:2927–31.
52. Zavrides HN, Zizi-Sermpetzoglou A, Panousopoulos D, Athanasas G, Elemenoglou I, Peros G. Prognostic evaluation of CD44 expression in correlation with bcl-2 and p53 in colorectal cancer. Folia Histochem Cytobiol. 2005; 43:31–6.
53. Olsson AK, Dimberg A, Kreuger J, Claesson-Welsh L. VEGF receptor signalling - in control of vascular function. Nat Rev Mol Cell Biol. 2006; 7:359–71.
54. Dufraine J, Funahashi Y, Kitajewski J. Notch signaling regulates tumor angiogenesis by diverse mechanisms. Oncogene. 2008; 27:5132–7.
55. Yu T, Wu Y, Helman JI, Wen Y, Wang C, Li L. CXCR4 promotes oral squamous cell carcinoma migration and invasion through inducing expression of MMP-9 and MMP-13 via the ERK signaling pathway. Mol Cancer Res. 2011; 9:161–72.
56. Sun X, Charbonneau C, Wei L, Yang W, Chen Q, Terek RM. CXCR4-targeted therapy inhibits VEGF expression and chondrosarcoma angiogenesis and metastasis. Mol Cancer Ther. 2013; 12:1163–70.
57. Liu X, Liao W, Yuan Q, Ou Y, Huang J. TTK activates Akt and promotes proliferation and migration of hepatocellular carcinoma cells. Oncotarget. 2015; 6:34309–20. http://doi.org/10.18632/oncotarget.5295.
58. May CD, Sphyris N, Evans KW, Werden SJ, Guo W, Mani SA. Epithelial-mesenchymal transition and cancer stem cells: a dangerously dynamic duo in breast cancer progression. Breast Cancer Res. 2011; 13:202.
59. Dong P, Karaayvaz M, Jia N, Kaneuchi M, Hamada J, Watari H, Sudo S, Ju J, Sakuragi N. Mutant p53 gain-of-function induces epithelial-mesenchymal transition through modulation of the miR-130b-ZEB1 axis. Oncogene. 2013; 32:3286–95.
60. Katkoori VR, Basson MD, Bond VC, Manne U, Bumpers HL. Nef-M1, a peptide antagonist of CXCR4, inhibits tumor angiogenesis and epithelial-to-mesenchymal transition in colon and breast cancers. Oncotarget. 2015; 6: 27763–77. http://doi.org/10.18632/oncotarget.4615.
61. Manne U, Weiss HL, Myers RB, Danner OK, Moron C, Srivastava S, Grizzle WE. Nuclear accumulation of p53 in colorectal adenocarcinoma: prognostic importance differs with race and location of the tumor. Cancer. 1998; 83: 2456–67.
62. Mooney CZ, Duval RD. Bootstrapping: a non-parametric approach to statistical inference. Sage; Newbury Park (CA): 1993.
63. Cox DR. Regression models and life tables. J Roy Stat Soc. 1972; 34:187–220.