
INTRODUCTION
As one of the most common type of hematological malignancies, acute myeloid leukemia (AML) is clinically, cytogenetically, and molecularly heterogeneous disease [1]. Despite intensive treatments with chemotherapy drugs and/or hematopoietic stem cell transplantation, less than half of AML patients are long time survivors [1, 2]. Cytogenetic abnormalities play vital roles in the pathogenesis of AML, and also provide powerful prognostic information [3]. Recently, molecular biological alterations including gene mutations and abnormal gene expression have been found as potential prognostic biomarkers in AML [4]. Therefore, identification of novel biomarkers could give us better understanding of the process of leukemogenesis, and are helpful to design effective therapeutic strategies for the patients with AML.
Inhibitor of DNA binding (ID) proteins are functional inhibitors of the basic helix-loop-helix, ETS and paired box transcription factors and thereby inhibit the transcription of lineage-specific and cell cycle-inhibitory genes that control the timing of cell fate determination and differentiation in stem and progenitor cells during normal development [5]. Dysregulation of ID proteins is frequent events in various human cancers and has a direct role in cancer initiation, maintenance, progression and drug resistance [5]. ID gene family is composed of four members (ID1, ID2, ID3 and ID4), and each member plays a different role in carcinogenesis [5]. Our previous study showed that ID1 overexpression was associated with higher risk karyotype classification and was a prognostically adverse indicator in young AML excluded M3 subtypes (non-M3-AML) patients [6]. In addition, ID4 acted as a tumor suppressor in AML and epigenetic dysregulation of ID4 independently affected clinical outcome in patients with AML [7].
Herein, we explored ID2 expression and its clinical significance in AML patients. Overexpression of ID2 was a frequent event in AML patients, and was associated with higher karyotype risks. Moreover, high bone marrow (BM) ID2 expression predicts poor chemotherapy response and prognosis in AML patients.
RESULTS
ID2 expression in AML
From real-time quantitative PCR (RQ-PCR) analysis, ID2 mRNA level in AML patients (median: 1.259, range: 0.000-27.387) was significantly higher than controls (median: 0.171, range: 0.000-2.684), which showed that ID2 expression was significantly up-regulated in all AML (P<0.001, Figure 1). Additionally, up-regulation of ID2 expression was also observed in non-M3-AML and cytogenetically normal AML (CN-AML) (both P<0.001, Figure 1). Moreover, ID2 expression was positively associated with ID1 (R=0.420, P<0.001, n=145) and ID4 (R=0.245, P=0.001, n=145) expression in AML patients.
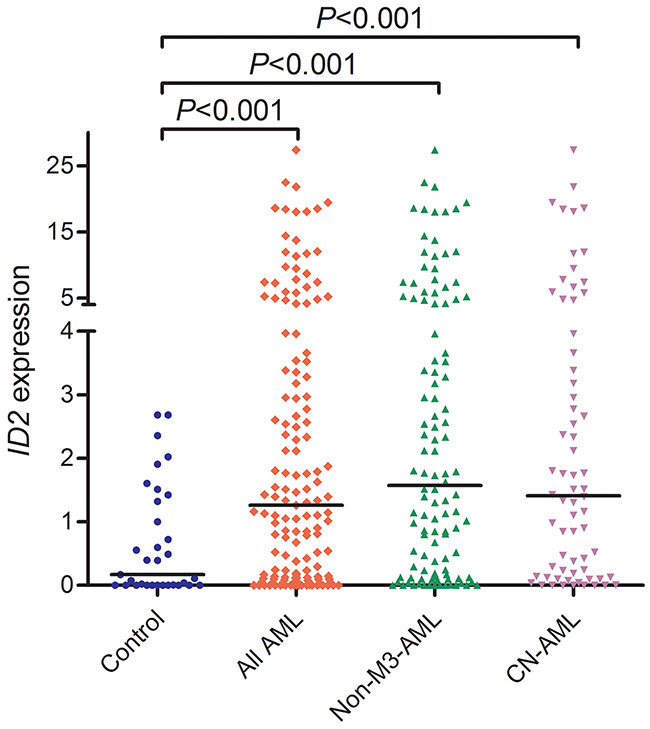
Figure 1: ID2 expression in controls, whole-cohort AML, non-M3-AML, and CN-AML patients.
Discriminative capacity of ID2 expression
By receiver operating characteristic curve (ROC) analysis, ID2 expression with an area under the ROC curve (AUC) value of 0.707 [95% confidence interval (CI): 0.617-0.797] might serve as a potential biomarker for distinguishing AML form controls (P<0.001, Figure 2A). Moreover, the discriminative capacity of ID2 expression was also observed among non-M3-AML (AUC=0.745, 95% CI: 0.658-0.832, P<0.001, Figure 2B) and CN-AML (AUC=0.724, 95% CI: 0.623-0.825, P<0.001, Figure 2C) patients.
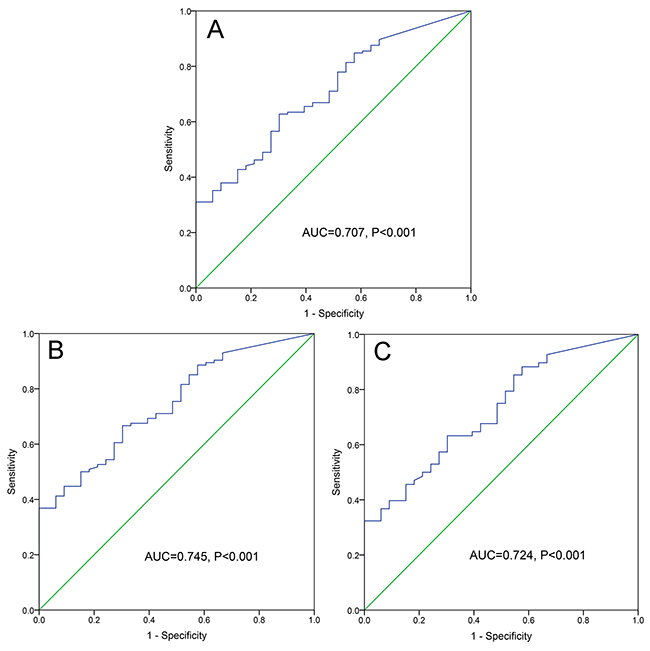
Figure 2: ROC curve analysis of ID2 expression for discriminating AML patients form controls. (A) whole-cohort AML patients; (B) non-M3-AML patients. (C) CN-AML patients.
Correlation of ID2 expression with clinical characteristics
In order to analyze clinical relevance of ID2 expression in AML, the whole-cohort AML patients were divided into two groups (ID2high and ID2low) by the cut-off value (defined due to the sensitivity+specificity-1 was the highest value) based on ROC analysis. The comparison of clinical manifestations and laboratory features between ID2high and ID2low groups of AML patients was presented in Table 1. ID2high patients had significantly older age (P=0.001) and a tendency of higher white blood cells (P=0.068). Significant differences were also observed in the distributions of French-American-British (FAB) and World Health Organization (WHO) classifications (P=0.009 and 0.016, respectively). High ID2 expression occurred with the lowest frequency in M3 or t(15;17) subtype (4/31, 13%), which was lower than M0/M1/M2 subtypes (25/64, 39%) (P=0.010) and M0/M1/M2/M4/M5/M6 subtypes (51/114, 45%) (P=0.001). Moreover, among the karyotype classifications, ID2high patients occurred with the highest frequency in poor karyotype (10/17, 59%), lower in intermediate karyotype (35/83, 42%), and the lowest in favorable karyotype (7/40, 18%) (P=0.004).
Table 1: Comparison of clinical manifestations and laboratory features between the AML patients with low and high ID2 expression
Patient’s parameters |
ID2low (n=90) |
ID2high (n=55) |
P value |
|---|---|---|---|
Sex, male/female |
51/39 |
33/22 |
0.731 |
Median age, years (range) |
51 (18-87) |
65 (18-93) |
0.001 |
Median WBC, ×109/L (range) |
7.5 (0.3-528.0) |
20.7 (1.1-197.7) |
0.068 |
Median hemoglobin, g/L (range) |
75 (34-138) |
75 (32-142) |
0.349 |
Median platelets, ×109/L (range) |
39 (3-264) |
50 (4-447) |
0.195 |
Median BM blasts, % (range) |
43.5 (1.0-109.0) |
47.8 (6.0-94.5) |
0.489 |
FAB classifications |
0.009 |
||
M0 |
1 (1%) |
0 (0%) |
|
M1 |
7 (8%) |
3 (5%) |
|
M2 |
31 (34%) |
22 (40%) |
|
M3 |
27 (30%) |
4 (7%) |
|
M4 |
14 (16%) |
17 (31%) |
|
M5 |
7 (8%) |
8 (15%) |
|
M6 |
3 (3%) |
1 (2%) |
|
WHO classifications |
0.001 |
||
AML with t(8;21) |
6 (7%) |
3 (5%) |
|
AML with t(15;17) |
27 (30%) |
4 (7%) |
|
AML with minimal differentiation |
1 (1%) |
0 (0%) |
|
AML without maturation |
7 (8%) |
3 (5%) |
|
AML with maturation |
25 (28%) |
19 (35%) |
|
Acute myelomonocytic leukemia |
14 (16%) |
18 (33%) |
|
Acute monoblastic/monocytic leukemia |
7 (8%) |
7 (13%) |
|
Acute erythroid leukemia |
3 (3%) |
1 (2%) |
|
Karyotypic classifications |
0.004 |
||
Favorable |
33 (37%) |
7 (13%) |
|
Intermediate |
48 (53%) |
35 (64%) |
|
Poor |
7 (8%) |
10 (18%) |
|
No data |
2 (2%) |
3 (5%) |
|
Karyotypes |
0.009 |
||
normal |
40 (44%) |
27 (49%) |
|
t(8;21) |
6 (7%) |
3 (5%) |
|
t(15;17) |
27 (30%) |
4 (7%) |
|
complex |
6 (7%) |
9 (16%) |
|
others |
9 (10%) |
9 (16%) |
|
No data |
2 (2%) |
3 (5%) |
|
Gene mutations |
|||
CEBPA* (+/-) |
13/68 |
4/47 |
0.194 |
NPM1 (+/-) |
9/72 |
6/45 |
1.000 |
FLT3-ITD (+/-) |
7/74 |
10/41 |
0.107 |
c-KIT (+/-) |
2/79 |
2/49 |
0.640 |
N/K-RAS (+/-) |
6/75 |
4/47 |
1.000 |
IDH1/2 (+/-) |
3/78 |
6/45 |
0.088 |
DNMT3A (+/-) |
5/76 |
6/45 |
0.335 |
U2AF1 (+/-) |
3/78 |
2/49 |
1.000 |
CR (+/-) |
43/31 (58%) |
14/38 (27%) |
0.001 |
AML: acute myeloid leukemia; WBC: white blood cells; BM: bone marrow; FAB: French-American-British; WHO: World Health Organization; CR: complete remission. *: single and double CEBPA mutations.
Association of ID2 expression with genetic mutations
As was shown in Table 1, ten gene mutations (Table 1) were detected in 132 patients with available DNA. We did not observe the significant association of ID2 expression with the tested gene mutations, besides that high ID2 expression tended to be associated with IDH1/2 and FLT3-ITD mutations (P=0.088 and 0.107, respectively).
Correlation of ID2 expression with chemotherapy response
Follow-up data for complete remission (CR) rate after induction chemotherapy was obtained in 126 patients. ID2high patients had significantly lower CR rate than ID2low patients in whole-cohort AML (Table 1) and non-M3-AML [25% (12/36) vs 46% (25/29), P=0.039]. Moreover, for CN-AML, ID2high patients tended to have lower CR rate than ID2low patients [57% (20/15) vs 31% (8/18), P=0.068].
Association of ID2 expression with clinical outcome
Follow-up data for overall survival (OS) was obtained in 124 patients. Cases with high ID2 expression had significantly shorter OS than those with low ID2 expression among whole-cohort AML (P<0.001, Figure 3A) and non-M3-AML (P=0.015, Figure 3B). However, among CN-AML, although ID2high patients showed shorter OS than ID2low patients, the P did not attach statistical significance (P=0.155, Figure 3C).
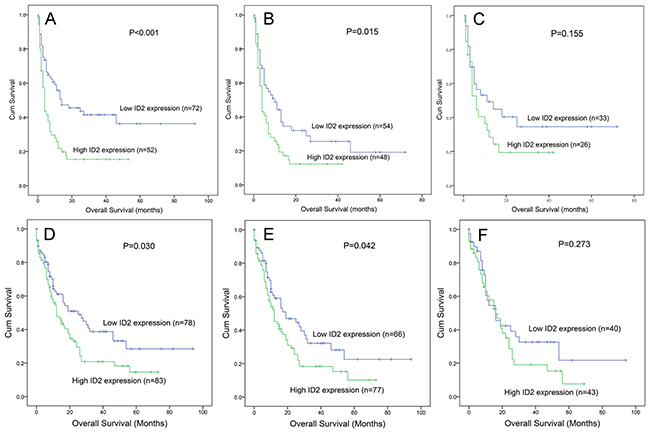
Figure 3: The impact of ID2 expression on overall survival in AML patients. (A-C) among our cohort. (D-F) data from TCGA databases. (A and D) whole-cohort AML patients; (B and E) non-M3-AML patients; (C and F) CN-AML patients.
We further performed Cox regression analyses (univariate and multivariate analyses) to determine the prognostic value of ID2 expression in AML. The univariate analysis included the variables showed in Table 2, whereas the multivariate analysis included variables with P<0.100 in univariate analysis. After adjusting for other covariates, ID2 expression acted as an independent prognostic biomarker in whole-cohort AML and non-M3-AML (Table 2) but not in CN-AML (data not shown).
Table 2: Univariate and multivariate analyses of prognostic factors for overall survival in AML patients
Univariate analysis |
Multivariate analysis |
|||
|---|---|---|---|---|
hazard ratio (95% CI) |
P value |
hazard ratio (95% CI) |
P value |
|
Whole-cohort AML |
||||
ID2 expression |
2.133 (1.380-3.295) |
0.001 |
1.889 (1.185-3.010) |
0.008 |
Age |
2.576 (1.650-4.020) |
<0.001 |
1.754 (1.090-2.820) |
0.020 |
WBC |
2.375 (1.526-3.698) |
<0.001 |
1.824 (1.148-2.899) |
0.011 |
Karyotype classifications |
2.220 (1.689-2.918) |
<0.001 |
1.791 (1.316-2.437) |
<0.001 |
CEBPA mutation* |
0.891 (0.391-2.032) |
0.784 |
||
NPM1 mutation |
1.599 (0.822-3.108) |
0.166 |
||
FLT3-ITD mutation |
0.891 (0.459-1.728) |
0.732 |
||
C-KIT mutation |
1.155 (0.283-4.718) |
0.841 |
||
DNMT3A mutation |
1.376 (0.662-2.860) |
0.393 |
||
N/K-RAS mutations |
1.351 (0.587-3.112) |
0.479 |
||
U2AF1 mutation |
3.020 (1.200-7.598) |
0.019 |
2.545 (0.972-6.660) |
0.057 |
IDH1/2 mutations |
2.600 (1.239-5.456) |
0.012 |
2.329 (1.033-5.254) |
0.042 |
Non-M3-AML |
||||
ID2 expression |
1.697 (1.082-2.663) |
0.021 |
1.774 (1.101-2.859) |
0.019 |
Age |
1.940 (1.229-3.063) |
0.004 |
1.589 (0.979-2.580) |
0.061 |
WBC |
1.787 (1.135-2.815) |
0.012 |
1.720 (1.701-2.762) |
0.025 |
Karyotype classifications |
1.929 (1.394-2.669) |
<0.001 |
1.774 (1.259-2.499) |
0.001 |
CEBPA mutation* |
0.730 (0.320-1.667) |
0.455 |
||
NPM1 mutation |
1.238 (0.633-2.418) |
0.533 |
||
FLT3-ITD mutation |
1.077 (0.553-2.100) |
0.827 |
||
C-KIT mutation |
0.945 (0.231-3.866) |
0.937 |
||
DNMT3A mutation |
1.092 (0.524-2.276) |
0.814 |
||
N/K-RAS mutations |
1.045 (0.451-2.418) |
0.918 |
||
U2AF1 mutation |
2.698 (1.069-6.810) |
0.036 |
2.913 (1.111-7.636) |
0.030 |
IDH1/2 mutations |
2.121 (1.006-4.474) |
0.048 |
2.433 (1.072-5.524) |
0.034 |
AML: acute myeloid leukemia; CI: confidence interval; WBC: white blood cells; *: double CEBPA mutations. Variables including age (≤60 vs. >60 years), WBC (≥30×109 vs. <30×109 /L), ID2 expression (lower vs. higher), and gene mutations (mutant vs. wild-type). Multivariate analysis includes variables with P<0.100 in univariate analysis.
Validation of the prognostic value of ID2 expression by TCGA databases
To validate the prognostic value of ID2 expression in AML, we searched and analyzed an independent assessment in AML patients from The Cancer Genome Atlas (TCGA) databases. By the median level of ID2 expression set as the cut-off value, patients with higher ID2 expression showed a significantly shorter OS among both whole-cohort AML (P=0.030, Figure 3D) and non-M3-AML (P=0.042, Figure 3E). Nevertheless, no significant difference was observed between the two groups for OS time among CN-AML (P=0.273, Figure 3F).
ID2 expression in the surveillance of AML
We next observed the dynamic change of ID2 expression in the follow-up of three paired AML patients in different stages. Although the limited samples for detection, our data indicated that ID2 expression at CR phase was decreased than at the time of diagnosis, and was increased at the time of relapse (Figure 4).
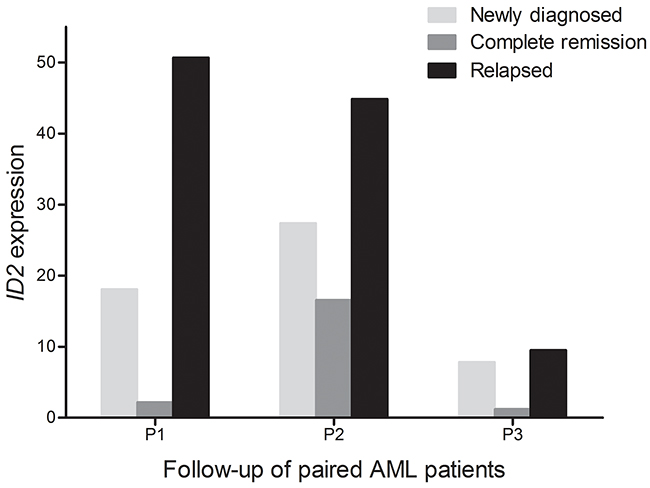
Figure 4: Dynamic change of ID2 expression in the three paired AML patients of different stages (newly diagnosis, complete remission, and relapse time).
DISCUSSION
ID2 plays dual roles in different cancer types which may attribute to tissue-specific patterns of expression in different tissues and organs in tumourigenesis [4]. In lymphoid malignancies, although Nilsson et al. argued that ID2 was dispensable for MYC-induced lymphomagenesis [8], a recent study reported that ID2 and ID3 proteins had a pro-survival function in chronic lymphocytic leukemia cells and also highlighted these proteins as potential determinants of the pathobiology of chronic lymphocytic leukemia [9]. In myeloid malignancies, ID1 and ID2 were lowly expressed in acute promyelocytic leukemia (APL) cells (NB4) and were rapidly induced upon all-trans retinoic acid (ATRA) treatment [10]. However, ID2 was highly expressed in acute monocytic leukemia cells (THP-1) and was reduced by ATRA treatment [11]. Moreover, May et al reported that ID2 and ID3 proteins seemed to be involved in the granulopoietic maturation [12]. Similarly, our study also found that high ID2 expression was less occurred in M3/t(15:17), and the low differentiated subtypes (M0/M1/M2) had a significantly higher frequency of high ID2 expression than the highly differentiated subtype (M3).
In this study, we first identified that ID2 overexpression was a frequent event in BMMNCs of de novo AML patients, and found it could act as a potential biomarker contributing to the diagnosis according to ROC curve analyses. When analyzed the clinical relevance of ID2 expression in AML patients, we found the significant correlation of ID2 overexpression with older age. The possible reason was that increasing age was associated with accumulation of aberrant gene expression. In addition, consistent with our previous study regarding ID1 expression in the different risk groups of AML [5], we also observed the increased frequency of ID2 overexpression with the rising risk of karyotype. Taken together, these results suggested that the role of ID1 and ID2 in the process of leukemogenesis may be dependent on the context of different cytogenetics.
Significantly, a negative effect of ID2 overexpression on CR rate was observed among whole-cohort AML, non-M3-AML and CN-AML patients, which indicated that ID2 overexpression was associated with poor induction chemotherapy response, and ID2 expression might play a crucial role in affecting leukemia cell chemosensitivity in AML. However, the underlying mechanism of ID2 expression mediated chemosensitivity in AML remains poorly investigated. A recent study reported that decreased ID2 expression enhanced chemosensitivity to semustine, teniposide, and temozolomide in the U87 cell line by promoting apoptosis of glioblastoma cells [13]. Accordingly, further functional studies are needed to determine the underlying molecular mechanism of ID2 in regulating chemosensitivity to cytarabine, daunorubicin, etc. in leukemia cells.
The impact of ID2 expression on clinical outcome has been revealed in human cancers. Although Stighall et al disclosed that high ID2 protein expression was associated with a favorable prognosis in primary breast cancer [14], a majority of investigations showed an adverse effect of ID2 overexpression on clinical outcome in diverse cancer types. For instance, in breast cancer, another independent study reported both ID1 and ID2 overexpression were related to the advanced tumor stage, shorter OS and disease free survival [15]. In glioma, the increased ID2 expression was closely associated with tumor grades, and correlated with shorter OS time [13]. Furthermore, Liu et al disclosed that overexpression of ID2 was an unfavorable prognosis factor and promoted cell proliferation in nasopharyngeal carcinoma [16]. Our data also observed that high ID2 expression was an independent prognostic biomarker in whole-cohort AML and non-M3-AML patients. Importantly, the results were further validated by TCGA data online available. Interestingly, recent studies showed ID2 functioned as a negative regulator of leukemia stem cell potential in MLL-rearranged AML, and ID2 overexpression suppressed MLL-rearranged and t(8;21) AML [17, 18]. Clinically, low expression of ID2 or of an ID2 gene signature was associated with poor prognosis in not only MLL-rearranged but also t(8;21) AML patients [17, 18]. However, in this study, we could not further analyze the impact of ID2 expression on MLL-rearranged and t(8;21) AML due to the limited samples. Through the above results, we deduced that ID2 might play different roles during leukemogenesis which may depend on cytogenetics. In addition, both our data and the TCGA dataset did not show the prognostic impact of ID2 expression on OS among CN-AML patients, which may due the limited samples in CN-AML, or the specific association of ID2 expression with cytogenetic abnormalities. In addition, our data showed that ID2 expression might serve as a potential biomarker in disease surveillance in spite of the limited samples. Consequently, due to all the limitations, further studies are required to confirm our results before ID2 could be a potential molecular target for gene therapy against leukemia.
In summary, ID2 overexpression was a frequent event in AML patients, and was associated with higher karyotype risks. In spite of the association, high ID2 expression predicts poor chemotherapy response and prognosis in de novo AML patients.
MATERIALS AND METHODS
Study population
A total of 145 AML patients and 33 healthy donors were enrolled in this study approved by the Institutional Review Board of the Affiliated People’s Hospital of Jiangsu University. The FAB and the 2008 revised WHO criteria were utilized for the diagnosis and classification of AML patients [19, 20]. After written informed consent obtained from all participants, BM was collected from all the healthy donors and patients at newly diagnosis time, as well as three patients at time of CR and relapse. BM mononuclear cells (BMMNCs) obtained from participants were separated by Ficoll solution and washed twice with PBS.
Treatment
All the patients received chemotherapy as reported in our previous literature [7, 21]. For APL patients, induction therapy was oral ATRA together with daunorubicin in combination with cytarabine, and maintenance therapy was oral mercaptopurine, oral methotrexate, and oral ATRA over two years. For non-APL patients, induction therapy was one or two courses of daunorubicin combined with cytarabine, whereas subsequent consolidation treatment included high-dose cytarabine, mitoxantrone combined with cytarabine, homoharringtonine together with cytarabine, and etoposide in combination with cytarabine.
Cytogenetic and mutation analyses
Karyotypes were analyzed by conventional R-banding method and karyotype risk was classified according to reported previously [22]. Mutations in NPM1, C-KIT, DNMT3A, IDH1/2, N/K-RAS and U2AF1 were detected by high-resolution melting analysis as reported [23–29], whereas FLT3-ITD and CEBPA mutations were examined by DNA sequencing [30, 31].
RNA isolation and reverse transcription
Total RNA was isolated from the BMMNCs using Trizol reagent (Invitrogen, Carlsbad, CA, USA). cDNA was synthesized by reverse transcription using random hexamers as reported [32].
RQ-PCR
RQ-PCR was performed to detect ID2 and ABL1 mRNA level. The primer of ID2 expression were 5’-CTGGACTCGCATCCCACTAT-3’ (forward) and 5’-CACACAGTGCTTTGCTGTCA-3’ (reverse) as reported [33]. PCR reaction was consisted of cDNA 20 ng, 0.4 μM of primers, 10 μL of AceQ qPCR SYBR Green Master Mix together with 0.4 μL of ROX Reference Dye 2 (Vazyme Biotech Co., Piscataway, NJ, USA). PCR conditions were conducted at 95 °C for 5 min, followed by 40 cycles at 95 °C for 10 s, 65 °C for 30 s, 72 °C for 32 s, and 83 °C for 32 s. Housekeeping gene ABL1 detected as reported [34] was used to calculate the abundance of ID2 mRNA. Both positive [K562 cell lines samples, cultured in RPMI 1640 medium containing 10% fetal calf serum (ExCell Bio, Shanghai, China)] and negative controls (ddH2O) were included in each assay. Relative ID2 expression levels were calculated using 2-ΔΔCT method.
TCGA databases
ID2 mRNA expression (RNA Seq V2 RSEM) in a cohort of 200 AML patients [35] from TCGA databases were obtained via online website cBioPortal (http://www.cbioportal.org) [36, 37].
Statistical analyses
Statistical analyses were performed through SPSS 20.0 software package. Mann-Whitney’s U test and Pearson Chi-square/Fisher exact test was employed to compare the difference of continuous and categorical variables between two groups. ROC and AUC were conducted to assess the value of ID2 expression in distinguishing whole-cohort AML, non-M3-AML and CN-AML patients from controls. Kaplan-Meier and Cox regression analyses were performed to analyze the impact of ID2 expression on OS. For all analyses, a two-tailed P value less than 0.05 was determined as statistically significant.
Abbreviations
AML: acute myeloid leukemia; CR: complete remission; TCGA: The Cancer Genome Atlas; ID: Inhibitor of DNA binding; BM: bone marrow; RQ-PCR: real-time quantitative PCR; CN-AML: cytogenetically normal AML; ROC: receiver operating characteristic curve; AUC: an area under the ROC curve; CI: confidence interval; FAB: French-American-British; WHO: World Health Organization; OS: overall survival; APL: acute promyelocytic leukemia; ATRA: all-trans retinoic acid; BMMNCs: BM mononuclear cells.
Author contributions
Jun Qian and Jiang Lin conceived and designed the experiments; Jing-dong Zhou, Ting-juan Zhang and Xi-xi Li performed the experiments; Jing-dong Zhou and Ji-chun Ma analyzed the data; Wei Zhang, De-hong Wu, Xiang-mei Wen and Zi-jun Xu contributed clinical data collection; Jing-dong Zhou wrote the paper.
ACKNOWLEDGMENTS AND FUNDING
This work was supported by National Natural Science foundation of China (81270630), Special Funds of “Ke Jiao Qiang Wei” Project of Jiangsu Province, 333 Project of Jiangsu Province (BRA2016131), Six Talent Peaks Project in Jiangsu Province (2015-WSN-115), Medical Innovation Team of Jiangsu Province (CXTDB2017002), Postgraduate Research & Practice Innovation Program of Jiangsu Province (KYCX17_1821), China Postdoctoral Science Foundation funded project (2016M601748), Social Development Foundation of Zhenjiang (SH2015058, SH2016045, SH2016046), Social Development Foundation of Kunshan (KS1624), 2016 Medical Science and Technology Development Fund of Jiangsu University (JLY20160011), Key Medical Talent Program of Zhenjiang City.
CONFLICTS OF INTEREST
The authors stated that there are no conflicts of interest regarding the publication of this article.
REFERENCES
1. Estey E, Döhner H. Acute myeloid leukaemia. Lancet. 2006;368:1894-907.
2. Ferrara F. Unanswered questions in acute myeloid leukaemia. Lancet Oncol. 2004;5:443-50.
3. Avivi I, Rowe JM. Prognostic factors in acute myeloid leukemia. Curr Opin Hematol. 2005;12:62-7.
4. Mrozek K, Marcucci G, Paschka P, Whitman SP, Bloomfield CD. Clinical relevance of mutations and gene-expression changes in adult acute myeloid leukemia with normal cytogenetics: are we ready for a prognostically prioritized molecular classification? Blood. 2007;109:431-48.
5. Lasorella A, Benezra R, Iavarone A. The ID proteins: master regulators of cancer stem cells and tumour aggressiveness. Nat Rev Cancer. 2014;14:77-91.
6. Zhou JD, Yang L, Zhu XW, Wen XM, Yang J, Guo H, Chen Q, Yao DM, Ma JC, Lin J, Qian J. Clinical significance of up-regulated ID1 expression in Chinese de novo acute myeloid leukemia. Int J Clin Exp Pathol. 2015;8:5336-44.
7. Zhou JD, Zhang TJ, Li XX, Ma JC, Guo H, Wen XM, Zhang W, Yang L, Yan Y, Lin J, Qian J. Epigenetic dysregulation of ID4 predicts disease progression and treatment outcome in myeloid malignancies. J Cell Mol Med. 2017;21:1468-1481.
8. Nilsson JA, Nilsson LM, Keller U, Yokota Y, Boyd K, Cleveland JL. Id2 is dispensable for myc-induced lymphomagenesis. Cancer Res. 2004;64:7296-301.
9. Weiler S, Ademokun JA, Norton JD. ID helix-loop-helix proteins as determinants of cell survival in B-cell chronic lymphocytic leukemia cells in vitro. Mol Cancer. 2015;14:30.
10. Nigten J, Breems-de Ridder MC, Erpelinck-Verschueren CA, Nikoloski G, van der Reijden BA, van Wageningen S, van Hennik PB, de Witte T, Löwenberg B, Jansen JH. ID1 and ID2 are retinoic acid responsive genes and induce a G0/G1 accumulation in acute promyelocytic leukemia cells. Leukemia. 2005;19:799-805.
11. Wågsäter D, Sirsjö A, Dimberg J. Down-regulation of ID2 by all-trans retinoic acid in monocytic leukemia cells (THP-1). J Exp Clin Cancer Res. 2003;22:471-5.
12. May AM, Frey AV, Bogatyreva L, Benkisser-Petersen M, Hauschke D, Lübbert M, Wäsch R, Werner M, Hasskarl J, Lassmann S. ID2 and ID3 protein expression mirrors granulopoietic maturation and discriminates between acute leukemia subtypes. Histochem Cell Biol. 2014;141:431-40.
13. Zhao Z, He H, Wang C, Tao B, Zhou H, Dong Y, Xiang J, Wang L, Luo C, Lu Y, Yu X. Downregulation of Id2 increases chemosensitivity of glioma. Tumour Biol. 2015;36:4189-96.
14. Stighall M, Manetopoulos C, Axelson H, Landberg G. High ID2 protein expression correlates with a favourable prognosis in patients with primary breast cancer and reduces cellular invasiveness of breast cancer cells. Int J Cancer. 2005;115:403-11.
15. Wazir U, Jiang WG, Sharma AK, Newbold RF, Mokbel K. The mRNA expression of inhibitors of DNA binding-1 and -2 is associated with advanced tumour stage and adverse clinical outcome in human breast cancer. Anticancer Res. 2013;33:2179-83.
16. Liu Z, Chen J, Luo W, Yang H, Wu A, Zhen Y, Yu X, Wang H, Yao K, Li X, Fang W. Overexpressed DNA-binding protein inhibitor 2 as an unfavorable prognosis factor promotes cell proliferation in nasopharyngeal carcinoma. Acta Biochim Biophys Sin (Shanghai). 2012;44:503-12.
17. Ghisi M, Kats L, Masson F, Li J, Kratina T, Vidacs E, Gilan O, Doyle MA, Newbold A, Bolden JE, Fairfax KA, de Graaf CA, Firth M, et al. Id2 and E Proteins Orchestrate the Initiation and Maintenance of MLL-Rearranged Acute Myeloid Leukemia. Cancer Cell. 2016;30:59-74.
18. Deb G, Somervaille TC. Antagonizing Self-Renewal in Acute Myeloid Leukemia: ID2 Takes the Stage. Cancer Cell. 2016;30:5-7.
19. Bennett JM, Catovsky D, Daniel MT, Flandrin G, Galton DA, Gralnick HR, Sultan C. Proposed revised criteria for the classification of acute myeloid leukaemia. A report of the French-American-British Cooperative Group. Ann Intern Med. 1985;103:620-5.
20. Vardiman JW, Thiele J, Arber DA, Brunning RD, Borowitz MJ, Porwit A, Harris NL, Le Beau MM, Hellström-Lindberg E, Tefferi A, Bloomfield CD. The 2008 revision of the World Health Organization (WHO) classification of myeloid neoplasms and acute leukemia: rationale and important changes. Blood. 2009;114:937-51.
21. Li Y, Lin J, Yang J, Qian J, Qian W, Yao DM, Deng ZQ, Liu Q, Chen XX, Xie D, An C, Tang CY. Overexpressed let-7a-3 is associated with poor outcome in acute myeloid leukemia. Leuk Res. 2013;37:1642-7.
22. Grimwade D, Hills RK, Moorman AV, Walker H, Chatters S, Goldstone AH, Wheatley K, Harrison CJ, Burnett AK; National Cancer Research Institute Adult Leukaemia Working Group. Refinement of cytogenetic classification in acute myeloid leukemia: determination of prognostic significance of rare recurring chromosomal abnormalities among 5876 younger adult patients treated in the United Kingdom Medical Research Council trials. Blood. 2010;116:354-65.
23. Lin J, Yao DM, Qian J, Chen Q, Qian W, Li Y, Yang J, Wang CZ, Chai HY, Qian Z, Xiao GF, Xu WR. Recurrent DNMT3A R882 muta-tions in Chinese patients with acute myeloid leukemia and myelodysplastic syndrome. PLoS One. 2011;6:e26906.
24. Yang X, Qian J, Sun A, Lin J, Xiao G, Yin J, Chen S, Wu D. RAS mutation analysis in alarge cohort of Chinese patients with acute myeloid leukemia. Clin Biochem. 2013;46:579-83.
25. Qian J, Yao DM, Lin J, Qian W, Wang CZ, Chai HY, Yang J, Li Y, Deng ZQ, Ma JC, Chen XX. U2AF1 Mutations in Chinese patients with acute myeloid leukemia and myelodysplastic syndrome. PLoS One. 2012;7:e45760.
26. Lin J, Yang J, Wen XM, Yang L, Deng ZQ, Qian Z, Ma JC, Guo H, Zhang YY, Qian W, Qian J. Detection of SRSF2-P95 mutation by high-resolution melting curve analysis and its effect on prognosis in myelodysplastic syndrome. PLoS One. 2014;9:e115693.
27. Yang J, Yao DM, Ma JC, Yang L, Guo H, Wen XM, Xiao GF, Qian Z, Lin J, Qian J. The prognostic implication of SRSF2 mutations in Chinese patients with acute myeloid leukemia. Tumour Biol. 2016;37:10107-14.
28. Lin J, Yao DM, Qian J, Chen Q, Qian W, Li Y, Yang J, Wang CZ, Chai HY, Qian Z, Xiao GF, Xu WR. IDH1 and IDH2 mutation analysis in Chinese patients with acute myeloid leukemia and myelodysplastic syndrome. Ann Hematol. 2012;91:519-25.
29. Lin J, Qian J, Yao DM, Li Y, Yang J, Chen Q, Chai HY, Xiao GF, Xu WR. Rapid and reliable detection of IDH1 R132 mutations in acute myeloid leukemia using high-resolution melting curve analysis. Clin Biochem. 2011;44:779-83.
30. Wen XM, Lin J, Yang J, Yao DM, Deng ZQ, Tang CY, Xiao GF, Yang L, Ma JC, Hu JB, Qian W, Qian J. Double CEBPA mutations are prognostically favorable in non-M3 acute myeloid leukemia patients with wild-type NPM1 and FLT3-ITD. Int J Clin Exp Pathol. 2014;7:6832-40.
31. Wen XM, Hu JB, Yang J, Qian W, Yao DM, Deng ZQ, Zhang YY, Zhu XW, Guo H, Lin J, Qian J. CEBPA methylation and mutation in myelodysplastic syndrome. Med Oncol. 2015;32:192.
32. Zhou LY, Zhai LL, Yin JY, Vanessa ME, Zhou J, Zhang J, Tang X, Lin J, Qian J, Deng ZQ. Pseudogene BMI1P1 expression as a novel predictor for acute myeloid leukemia development and prognosis. Oncotarget. 2016;7:47376-86. https://doi.org/10.18632/oncotarget.10156.
33. Li K, Yao L, Chen L, Cao ZG, Yu SJ, Kuang XY, Hu X, Shao ZM. ID2 predicts poor prognosis in breast cancer, especially in triple-negative breast cancer, and inhibits E-cadherin expression. Onco Targets Ther. 2014;7:1083-94.
34. Zhou JD, Yao DM, Han L, Xiao GF, Guo H, Zhang TJ, Li XX, Yuan Q, Yang L, Lin J, Qian J. Low NKD1 expression predicts adverse prognosis in cytogenetically normal acute myeloid leukemia. Tumour Biol. 2017;39:1010428317699123.
35. Cancer Genome Atlas Research Network. Genomic and epigenomic landscapes of adult de novo acute myeloid leukemia. N Engl J Med. 2013;368:2059-74.
36. Cerami E, Gao J, Dogrusoz U, Gross BE, Sumer SO, Aksoy BA, Jacobsen A, Byrne CJ, Heuer ML, Larsson E, Antipin Y, Reva B, Goldberg AP, et al. The cBio cancer genomics portal: an open platform for exploring multidimensional cancer genomics data. Cancer Discov. 2012;2:401-4.
37. Gao J, Aksoy BA, Dogrusoz U, Dresdner G, Gross B, Sumer SO, Sun Y, Jacobsen A, Sinha R, Larsson E, Cerami E, Sander C, Schultz N, et al. Integrative analysis of complex cancer genomics and clinical profiles using the cBioPortal. Sci Signal. 2013;6:pl1.