
INTRODUCTION
Hydroxytyrosol (HT), 2-(3,4-dihydroxyphenyl)ethanol, a polyphenol found in olive oil, noted for its anti-inflammatory, antioxidant activity, has been reported to reduce proliferation of human cancer cells, particularly colon carcinoma cells [1–3], and to exert pro-apoptotic effects [4–6]. Epidemiological studies substantiated the association between olive oil consumption and cancer prevention [7, 8], and a plethora of studies highlighted the beneficial properties of olive oil polyphenols due to their protective activity on DNA damage, lipid peroxidation and ROS generation [9–11]. Recently, we described the inhibition of HT on HT-29 colon cancer cell proliferation, which leads to a reduction of tumor-mass growth in a mouse HT-29 xenograft model. We also uncovered a possible mechanism, as we found that HT markedly accelerates degradation of EGFR, by promoting phosphorylation of the docking site for Cbl, a component of the ubiquitin system [3].
These findings suggest the existence of causal relationship between the HT polyphenol and the EGFR burden, widely recognized as the main driver of colon cancer growth. To exploit this concept we designed a study to investigate the influence of HT on the anticancer efficacy of cetuximab, a monoclonal antibody against EGFR known to produce EGFR downregulation, and the ensuing tumor growth inhibition and cell apoptosis. Accordingly, we compared the effects exerted by exposure to HT and cetuximab as single agents and by the HT-cetuximab combination on HT-29 and WiDr colon cancer cells, examining functional parameters of tumor growth and clonogenic potential, as well as biochemical ones. Among the latter we analyzed: EGFR expression, cell cycle progression molecules, apoptosis and autophagy markers and genes.
The HT-cetuximab combination, containing a fraction (ca. 1/10) of the maximal effective dose of each single agent, produced a far greater anti-tumor effect, in terms of inhibition of cell proliferation and clonogenic potential. Similarly, we observed consistent changes of biochemical parameters, such as EGFR expression, cell cycle check-point proteins and apoptosis, and autophagy markers.
Moreover, normal colon cells and human keratinocytes were less susceptible to cell death and EGFR downregulation induced by the combo-treatment. Interestingly, a number of recent reports have described the enhancement exerted by other polyphenols (e.g. curcumin, resveratrol) on chemotherapeutic agents on cancer progression [12, 13].
The striking enhanced efficacy on tumor cells and reduced effects on normal cells of the compound combination mentioned above might have implication in designing chemotherapeutic regimen for advanced colon cancer patients.
RESULTS
Growth of colon cancer cells exposed to HT and cetuximab
First, we determined the sensitivity of HT-29 and WiDr cells towards HT (1 up to 300 μM) or cetuximab (0.01, up to 100 μg/ml) alone or in presence of epidermal growth factor (EGF) for 48 h. Cells treated with 0.1% FBS were used as basal control.
The MTT assay revealed that HT reduced cell viability at the highest concentration (300 μM, P<0.001) in basal conditions, while it reduced cell proliferation in EGF-treated cells in a concentration dependent manner (Figure 1A–1D). HT IC50 values were 136.7 and 163.4 μM in HT-29 and WiDr cell lines, respectively. Marked differences in sensitivity to cetuximab were observed in colon cancer cells primed with EGF, as HT-29 cell growth was reduced by high cetuximab concentrations (10-100 μg/ml; IC50 50.12 μM), while WiDr cells were unaffected by mAb at any concentration tested (compare Figure 1B with 1E). Cetuximab was ineffective on cell growth in control condition. High concentration of either HT (100-300 μM) or cetuximab (100 μg/ml) reduced the cell number compared to control condition, therefore useless for the scope of this work. In other experiments reported herein they were reduced to 10 μM and 1 μg/ml (HT and cetuximab, respectively) and served also for the HT-cetuximab combination (see below).
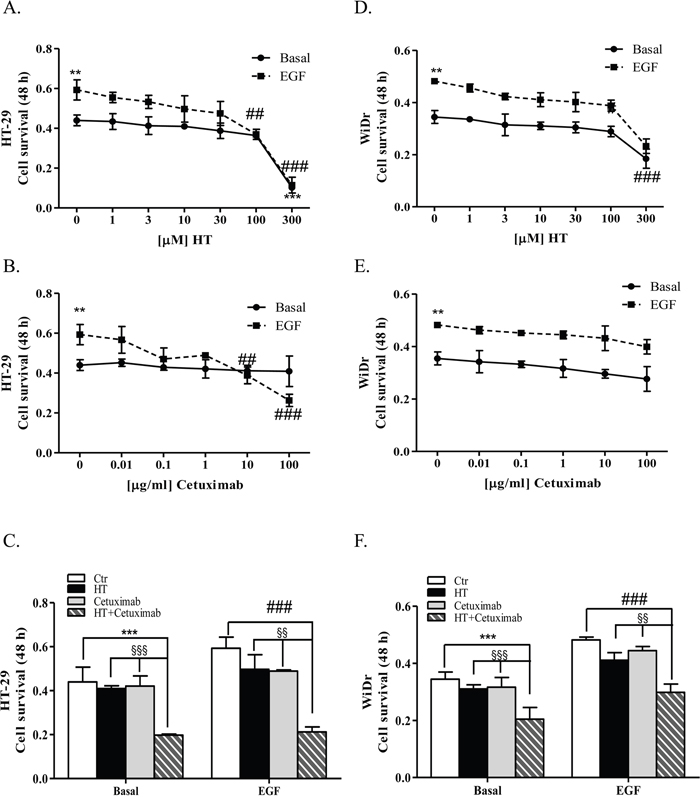
Figure 1: Low concentrations of HT and cetuximab reduce cell growth in colorectal cancer. HT-29 (A), and WiDr (D) cells were exposed to increasing HT concentrations in presence/absence of EGF (5 ng/ml) for 48 h. Cell viability values, reported as absorbance at 540 nm, were obtained by MTT assay. Numbers represent mean ± DS of three experiments run in triplicate ** P <0.01, *** P <0.001 vs. untreated cells. ## P <0.01, ### P <0.01 vs. EGF-treated cells. HT-29 (B), and WiDr (E) cells were exposed to increasing cetuximab concentrations in presence/absence of EGF (5 ng/ml). Values obtained as in A. Numbers represent mean ± DS of three experiments run in triplicate. ** P <0.01 vs. untreated cells ## P <0.01, ### P <0.001 vs. EGF-treated cells. HT-29 (C), and WiDr (F) cells were exposed to HT (10 μM) and/or cetuximab (1 μg/ml) in presence/absence of EGF (5 ng/ml) for 48 h. These concentrations were used throughout this work, unless otherwise noted. Values obtained as in A. *** P <0.001, vs. untreated cells. ### P <0.001 vs. EGF-treated cells. §§ P < 0.01. §§§ P <0.001, vs. HT or cetuximab (alone) treated cells.
Then, we tested the combination of HT (10 μM) with cetuximab (1 μg/ml) for its effect on HT-29 and WiDr cell proliferation ability. As we noted a significant growth inhibition of the combination either in basal condition or in EGF-treated cells (Figure 1C and 1F), we conclude that HT enhances efficacy of cetuximab on tumor cells.
HT and cetuximab reduce HT-29 and WiDr colony formation
We next analyzed HT (10 μM) and cetuximab (1 μg/ml) combination on cell growth by using the functional clonogenic assay, that more closely replicates the growth characteristics of tumors in vivo. As shown in Figure 2A and 2B, EGF induced colony formation in both HT-29 and WiDr cells. Combination of HT and cetuximab significantly reduced colony formation both in basal and in EGF-treated cells. In both cancer cell lines, a slight reduction of clonogenic potential was observed also in presence of cetuximab alone (Figure 2A and 2B), while HT per se promoted a slight reduction of WiDr cells colonies only (Figure 2A).
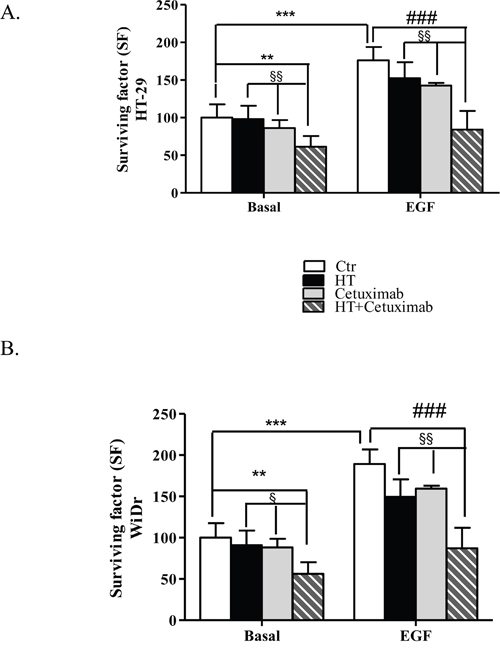
Figure 2: Combination of low concentrations of HT and cetuximab reduces colony formation of colorectal cancer cells. Colony formation capability of HT-29 (A), and WiDr (B) cells in response to HT (10 μM) and/or cetuximab (1μg/ml) in presence/absence of EGF (5 ng/ml). Colonies (>75 cells) with 50% efficiency were counted. Results are expressed as surviving factor (SF, see material and methods). ** P <0.01, *** P <0.001, vs. untreated cells. # P <0.05, ### P <0.001 vs. EGF-treated cells.§ P < 0.05. §§ P <0.01, vs. HT or cetuximab (alone) treated cells.
HT enhances cetuximab-mediated EGFR expression decline
Since reports from our and other laboratories showed that HT reduces EGFR expression [3] and cetuximab down-regulates EGFR levels in colon cancer cells [14], we investigated whether HT and cetuximab per se and in combination, when used at low concentrations, would affect EGFR expression in HT-29 and WiDr cells (Figure 3). Low concentration of HT and cetuximab did not reduce EGFR expression when administered per se, while induced a marked decline of EGFR levels when co-administered together, as assessed either by western blot or immunofluorescence (Figure 3A–3D). As expected, 8 h of treatment with high concentration of HT (100 μM) or cetuximab (10 μg/ml) reduced EGFR levels in both cell lines (Figure 3C and 3D; compare panels e and f vs panel a, and also Figure 3E and 3F) [3]. All together the data suggests that the combination of HT with cetuximab inhibits cell growth by targeting EGFR levels in colon cancer cells.
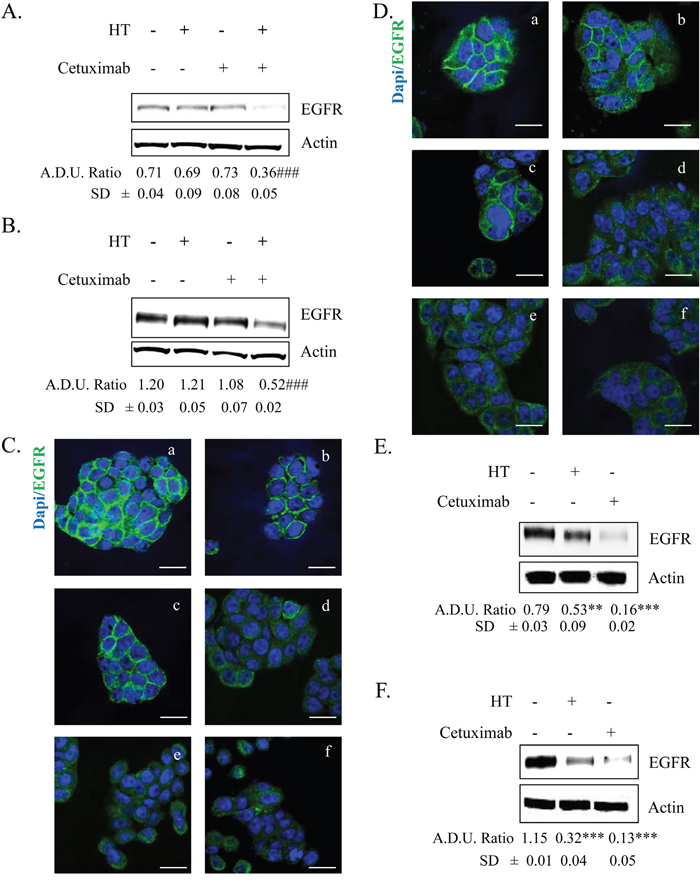
Figure 3: EGFR expression in colorectal cancer cells treated with HT and cetuximab alone or combined. HT-29 (A) and WiDr (B) cells were exposed to low concentration of HT or cetuximab alone or in combination for 8 h and EGFR proteins was analyzed by western blot. Images of immunostaining in HT-29 (C) and WiDr (D) for EGFR (green) and DAPI (blue) in tumor cells exposed to 10 % FBS (a), cetuximab 1 μg/ml (b), HT 10 μM (c), cetuximab 1 μg/ml + HT 10 μM (d), cetuximab 10 μg/ml (e), HT 100 μM (f). Confocal images were captured with Leica SP5 confocal using 63x objective, scale bars 20 μm. HT-29 (E) and WiDr (F) cells were exposed to high concentration of HT or cetuximab for 8 h and EGFR proteins were analyzed by western blot. β-actin has been used to normalized loading (in Figures 3 and 7). Quantification (termed analysis in Figures 3 and 7; arbitrary density unit, A.D.U.) has been reported. ** P <0.01; *** P <0.001 vs. untreated cells; ### P <0.001 vs single agents.
HT and cetuximab combination arrests colon cell cycle at G2 phase
In light of the cooperation observed between HT and cetuximab, we examined whether the growth inhibition might be attributed to cell cycle arrest. HT-29 and WiDr cells were treated (48 h) with EGF in the presence/absence of HT (10 μM) and cetuximab (1 μg/ml) per se or in combination, and labelled with propidium iodide (PI) to detect cell cycle progression by flow cytometry (Figure 4). Results showed that the treatment with HT or cetuximab did not affect the cells residing in the different phases of the cell cycle, while the combination of the two compounds caused a significant increase in the apoptotic cells represented by sub G0/G1 population (Figure 4A and 4B, and Supplementary Tables 1 and 2). Interestingly, in EGF-treated colon cancer cells, the HT-cetuximab combination challenge caused a significant increase in the sub G0/G1 population (Figure 4A and 4B, grey bars and Supplementary Tables 1 and 2), which was accompanied by accumulation of cells at G2/M- and by a decrease in those in S-phase (Figure 4A and 4B, black and dark grey bars, respectively, and Supplementary Tables 1 and 2). Detailed analysis revealed, in fact, that the co-treatment with HT and cetuximab induced a 3-fold and a 2-fold increase in the cells in sub G0/G1- and G2/M-phase, respectively, while it halved those in S phase (Supplementary Tables 1 and 2), suggesting DNA fragmentation and apoptosis process in colon cancer cells.
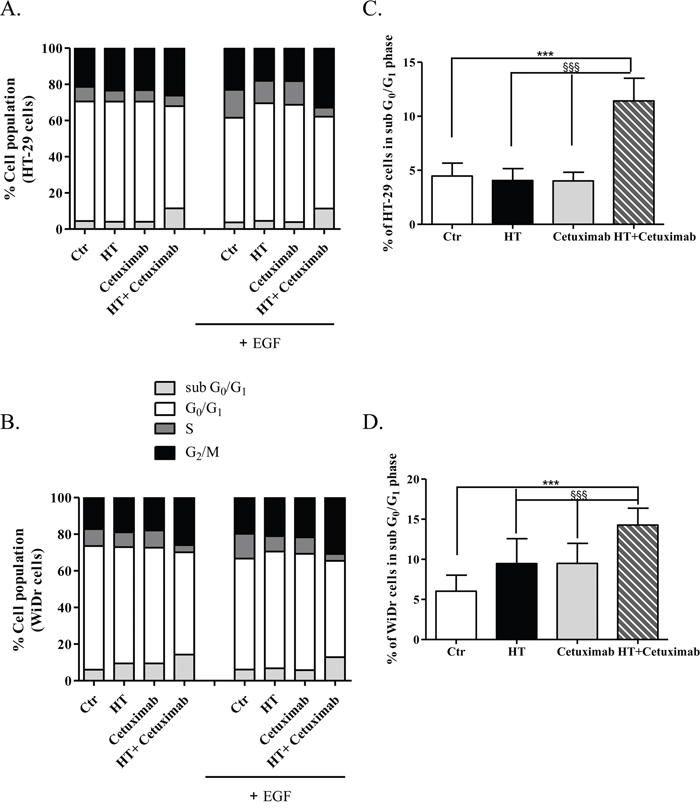
Figure 4: Cell cycle analysis in cancer cells treated with low concentration of HT and cetuximab combined. HT-29 (A), and WiDr (B) cells were exposed to HT or cetuximab alone or in combination in presence or absence of EGF for 48 h. The percentage of cells at each stage of the cell cycle was analyzed by flow cytometry after DNA staining with propidium iodide. Quantification of cells residing in G0 and G1 for HT-29 (C), and WiDr (D) are reported. Percent of HT-29- (C), and WiDr-cells (D) in sub Go/G1 phase. *** P <0.001, vs. untreated cells. §§§ P <0.001, vs. HT or cetuximab (alone) treated cells.
HT-cetuximab combination adversely affects cell cycle checkpoint proteins in colorectal cancer cells
Analysis of the cell regulator proteins, CDKs and CDKi expression, revealed that the HT-cetuximab combo induced a significant increase in CDKi p27 and p21 expression, known to be involved in either G1, or G2, or S phase arrest, while p18 expression (barely detectable in the WiDr line) was mostly unchanged in colon cancer cells (Figure 5A and 5D Supplementary Tables 3 and 4). Furthermore, the combination reduced cyclin D1, D3, E1, CDK2, CDK4 and CDK6 expression, cell cycle regulators that mediate the transition from G1 to S phase, and it decreased cyclin B1, a key regulator of cells entry into mitosis (transition from G2 to M phase) (Figure 5B, 5C, 5E and 5F and Supplementary Tables 5–8). Thus, the HT-cetuximab combination induces G1/S and G2/M phase cell cycle arrest by reducing the expression of cell cycle regulators. (Figure 5 and Supplementary Tables 3 and 4) Of note, the concomitant downregulation of D3 and CDK6, recently reported, might disrupt the cancer-specific metabolic pathways (pentose and serine), and therefore deprive the cells of pivotal molecules such as NADPH and glutathione [15].
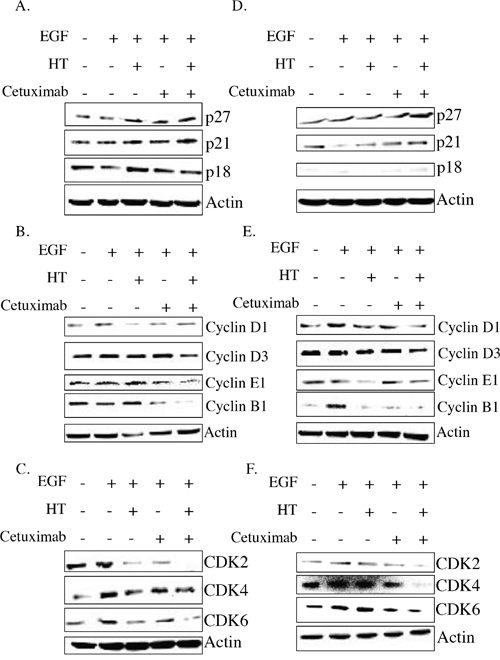
Figure 5: HT and cetuximab combination modulate the cell cycle checkpoint proteins in colorectal cancer cells. HT-29 (A, B, C), and WiDr (D, E, F) cells were exposed to HT or cetuximab, alone or in combination in presence of EGF for 48 h and the cell cycle checkpoint proteins were analyzed by western blot.
HT-cetuximab combination induces cell death by activating apoptosis and autophagy processes
The observed cell cycle arrest exerted by the combination provided a strong clue for studying the fate of colon cancer cells following exposure to the examined drugs. Accordingly, we investigated a number of apoptosis and autophagy markers with aim of determining the relevance of each process in the fate of cancer cells after the above treatment. Indeed, we found a robust increase of the apoptotic marker phosphatidylserine (immunostaining) solely in colon cancer cells exposed to HT-cetuximab combination, compared to control or to single agents per se (Figure 6A–6D). In contrast the levels of cleaved caspase-3 (Figure 6E and 6F) were unaffected. This clearly indicates that colon cancer cell death occurs in a caspase-3-independent way.
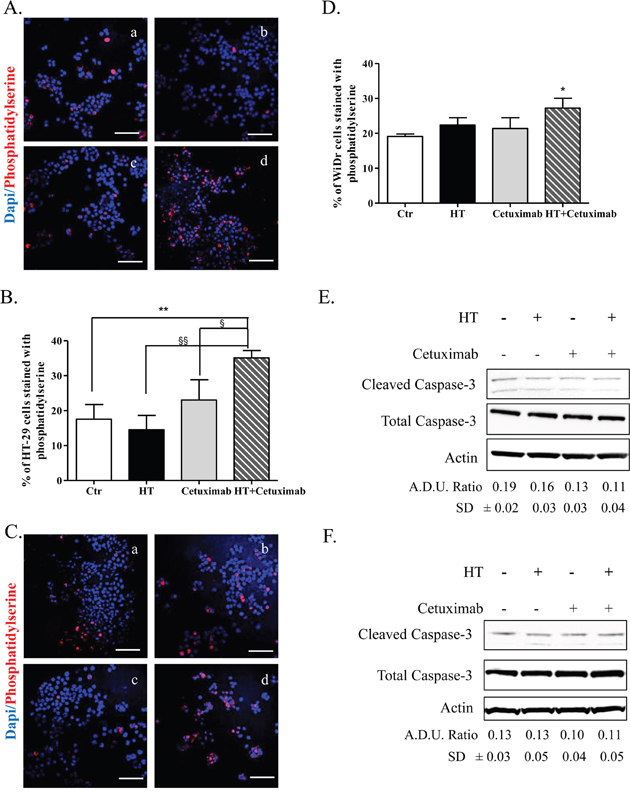
Figure 6: HT and cetuximab combination induces caspace3-independent apoptosis in colorectal cancer cells. Phosphatidylserine (red) and DAPI (blu) exposure, assessed by immunofluorescence, in HT-29 (A, C for quantification) and WiDr (B, D for quantification) cells treated for 48 h with 10% FBS (Ctr) (a), cetuximab 1 μg/ml (b), HT HT 10 μM (c) or cetuximab 1 μg/ml+ HT 10 μM. Confocal images were captured with Leica SP5 confocal using 40 x objective, scale bars 60 μm.*P<0.05; **P <0.01 vs. untreated cells; §P<0.05; §§P<0.01 vs. HT- or cetuximab-treated cells. HT-29 (E), and WiDr (F) cells were exposed to HT or cetuximab alone or in combination for 8 h and caspase-3 activity were analyzed by western blot. A.D.U.(cleaved caspase-3 vs. total caspase-3) has been reported.
Further insight was obtained by evaluating the cellular localization of AIF, an inducer of the caspase-independent pathway, which translocates to the nucleus in response to death stimuli. We found that the HT-cetuximab combination, but not the single agents per se, provoked AIF cytosolic and nuclear accumulation, while depriving mitochondria (Figure 7A and 7B). Immunofluorescence showed AIF an even granular distribution in cellular compartments, likely mitochondria, in control and single agent-treated cancer cells, contrasting with the striking nuclear accumulation in the combination–treated cells (Figure 8A and 8B). This suggest that the HT-cetuximab combination induces apoptosis in cancer cells via mitochondrial dysfunction, AIF translocation in nucleus and DNA fragmentation.
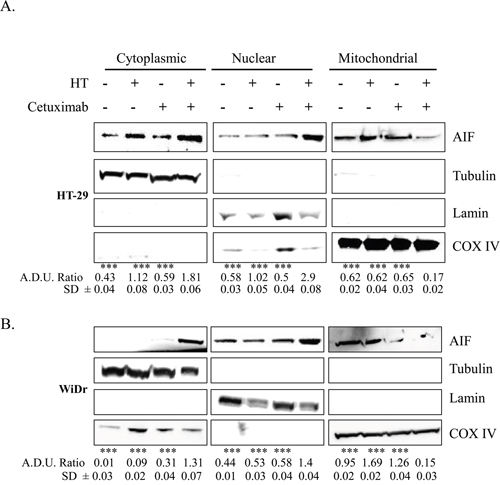
Figure 7: HT and cetuximab combination stimulates AIF release from the mitochondria to the cytoplasm and nuclear translocation. (A) HT-29 (upper panel) and (B) WiDr (bottom panel) cells were exposed to HT or cetuximab alone or in combination for 24 h. Cytoplasmic, nuclear, and mitochondrial fractions were analyzed for AIF, tubulin (cytosolic marker), COX IV (mitochondrial marker) and lamin (nuclear marker) expression and localization Cytoplasmic AIF fraction was normalized with tubulin, nuclear fraction with lamin and mitochondrial fraction with COX IV. ***P<0.001 vs.
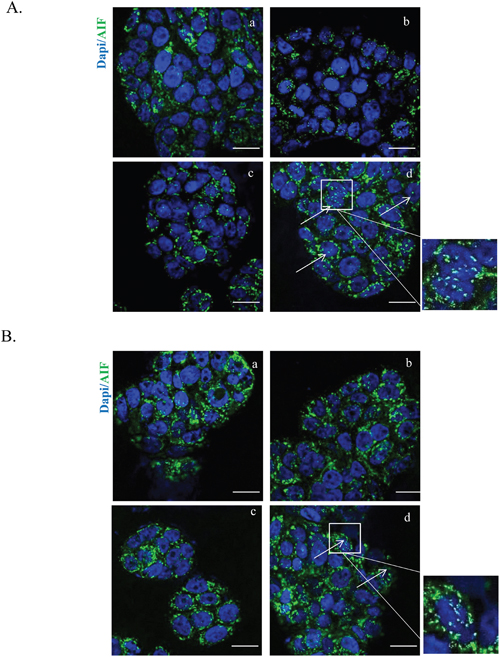
Figure 8: HT and cetuximab combination stimulates AIF release from the mitochondria to the cytoplasm and nuclear translocation evaluated by immunofluorescence. Images of immunostaining for AIF (green) and DAPI (blue) in HT-29 (A) and WiDr (B) cells treated with 10 % FBS (a), cetuximab 1 μg/ml (b), HT 10 μM (c) or cetuximab 1 μg/ml+ HT 10 μM (d). Arrows indicate nuclei with AIF translocation. Boxed areas are shown in detail above the pictures. Confocal images were captured with Leica SP5 confocal using 63x objective, scale bars 20 μm.
Assessment of autophagy markers such as the microtubule-associated protein light chain 3 in its processed form, LC-3II, and the autophagy related gene 7, Atg7, as well as Beclin-1 levels, which were consistently overexpressed in colorectal cancer cells treated with HT-cetuximab combination relative to control and single agent treatment (Figure 9A and B), provided evidence that autophagy contributes to the anti-proliferative activities and apoptotic events described above.
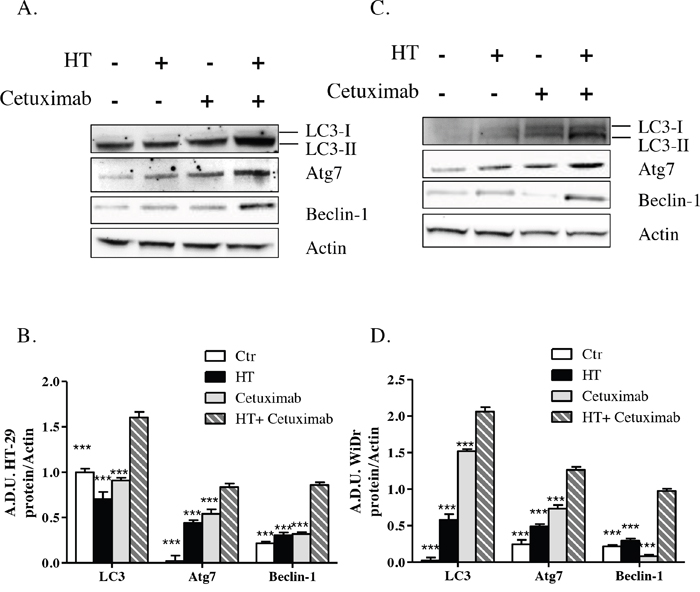
Figure 9: HT and cetuximab combination induces autophagy in colorectal carcinoma cells. HT-29 (A) and WiDr (B) cells were exposed to HT or cetuximab alone or in combination for 24 h and the LC3, Atg7 and Beclin-1 proteins were analyzed by western blot. Quantification (C for HT-29 cells and D for WiDr cells) has been reported. *** P< 0.001 vs. HT-cetuximab combination.
HT-cetuximab combination preserves normal colon cells and skin keratinocyte functions
We investigated whether the HT-cetuximab combination affected the normal colon cells and human keratinocytes, in terms of proliferative ability, reproducing the effects observed in colon cancer cells over single agents treatment. To this end, we used CCD-18Co (normal fibroblast colon cells), or differentiated CaCo2 cells (mimicking intestinal cells) and human keratinocytes (HaCaT) evaluating cell survival and other parameters. The HT-cetuximab combination affected neither the cell survival ability (Figure 10A–10C) nor EGFR expression levels in CCD-18Co cells or in differentiated CaCo2 cells (Figure 10D), indicating that its effect is specific for tumor cells. Further, on HaCaT cells expression of claudin-1 and Occludin proteins at the cell-to-cell contacts was only marginally affected, while at higher concentration cetuximab promoted a significant subversion of both proteins distribution on cell membranes (Figure 11A and 11B, panel e vs panel a). Altogether, these results indicate that HT-cetuximab combination exerts an antitumor effect on colorectal cancer without affecting normal colon cell function and the skin barrier of keratinocytes, possibly curtailing the dermatologic toxicity and diarrhea frequently associated with the conventional cetuximab dose regimen in cancer patients.
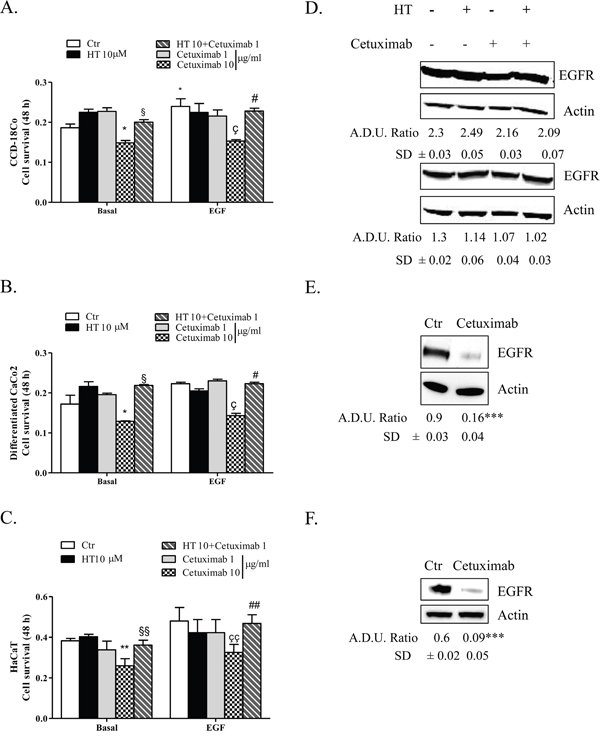
Figure 10: HT-cetuximab combination reduces side effects of cetuximab treatment in colorectal cancer. CCD-18Co (A), differentiated CaCo2 (B) and HaCaT (C) cells were exposed to the indicated concentration of HT and cetuximab in presence/absence of EGF (5 ng/ml) for 48 h. Cell survival values, reported as absorbance at 540 nm, were obtained by MTT assay. *P<0.05; **P<0.01 vs. untreated cells; §P<0.05; §§P<0.01 vs. cetuximab 10 μg/ml alone; çP<0.05, ççP<0.01 vs EGF-treated cells; #P<0.05, ##P<0.01 vs cetuximab 10 μg/ml plus EGF-treated cells. CCD-18Co (D, upper panel) and differentiated CaCo2 (D, bottom panel) cells were exposed to HT or cetuximab alone or in combination for 8 h and EGFR proteins was analyzed by western blot. CCD-18Co (E) and differentiated CaCo2 (F) cells were exposed to cetuximab (10 μg/ml) alone for 8 h and EGFR proteins were analyzed by western blot. β-actin has been used to normalize loading. A.D.U. has been reported. ***P<0.001 vs. untreated cells.
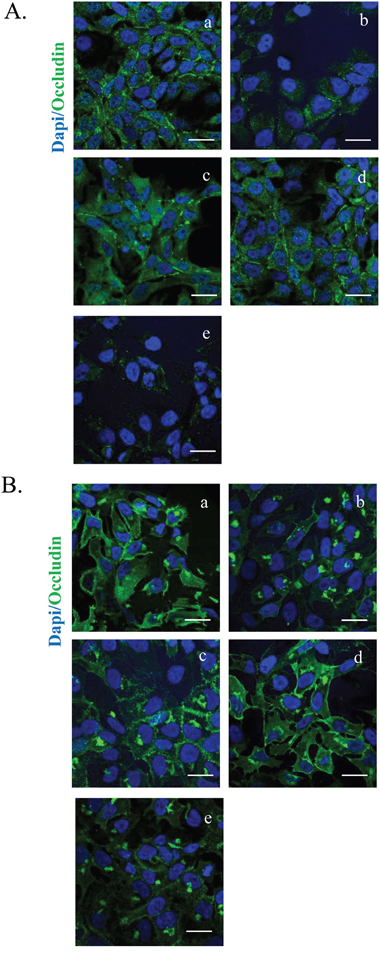
Figure 11: HT-cetuximab combination reduces side effects of cetuximab treatment in colorectal cancer in HaCaT cells. Images of immunostaining for occludin (green) (G), claudin1 (H) and DAPI (blue) in HaCaT cells treated with 10 % FBS (a), cetuximab 1 μg/ml (b), HT 10 μM (c), cetuximab 1μg/ml + HT 10 μM (d), cetuximab 10 μg/ml (e). Confocal images were captured with Leica SP5 confocal using 63x objective, scale bars 20 μm.
DISCUSSION
Epithelial growth factor (EGF), via its receptor EGFR, elicits proliferation in many human cancers [16]. Here, we describe the effect of two molecules, cetuximab and HT, a polyphenol from olive oil, that impair the EGF/EGFR oncogenic drive, yielding a reduced proliferation of colon cancer cells (see Figure 10). Whereas cetuximab, a monoclonal antibody, occludes the EGFR binding sites, HT accelerates the EGFR degradation through ubiquitination. Although the two molecules affect tumor proliferation by disparate mechanism, it is possible that these agents might cooperate in producing an enhanced anti-tumor effect as they address the same molecular target. Evidence for cooperativity was found in functional experiments when HT and cetuximab combination (10 μM and 1 μg/ml respectively), produced greater EGFR signaling impairment than that elicited by the single agents in the colon cancer cells examined (HT-29 and WiDr). This was observed in experiments measuring either the cancer cell proliferative ability or their clonogenic propensity in response to EGF (see Figures 1 and 2). An even greater effect was detected by measuring the expression levels of EGFR, as we found a sharp decline of oncogene expression in colonic cancer cells exposed to the above combination, compared to the negligible or null effects exerted by the single agents (see Figure 3).
Analysis of cell cycle progression in cancer cells provided a rationale for the observed functional effects of the compounds examined, indicating also the underlying mechanism of action.
In fact, the HT-cetuximab combination was found to induce growth arrest at G2/M phase, contrasting with the negligible or null effect exerted by the single agents in this phase and in the following ones. The increase in cell number at G2/M phase was associated with the CDK inhibitors p21 and p27 induction [17–20], the former being known to silence the G1/S-promoting cyclin E/CDK2 kinase and thereby to cause a G1 arrest [19]. Accordingly, cyclin E and CDK2 kinases were found to be decreased by the combination. The G1/S checkpoint, governed by two mechanisms converging into p21, are commonly deregulated in human colon cancer [20, 21]. Moreover, the reduced cyclin B expression found in HT-cetuximab combination treated cells, signals an efficient blockade of the G2/M checkpoint which prevents cells from initiating mitosis in presence of DNA lesions or not fully replicated DNA [17, 18, 20, 22]. Further complexity of the cell cycle arrest arises from the recent observation showing that the down-regulation of Cyclin D3 and CDK6, as found in this work (see Figure 5 panel C trough F), has a strong impact on cancer-specific metabolic pathway (glycolysis), leading to mitochondrial dysfunction [15, 23]. In agreement, in this work we obtained evidence for mitochondrial failure following combination treatment, as we observed AIF depletion in mitochondria (see Figure 7). Although, previous studies reported that cetuximab blocks the cell cycle in G1 phase [24], this occurred at high concentrations (100 mg/ml). Conversely, the impairment of the EGF/EGFR system afforded by the HT and cetuximab combination appears to be related to its ability to mainly provoke a growth arrest in G2/M phases in colon cancer cells. Clearly, as a consequence of the ensuing DNA fragmentation observed in sub G0/G1 phase of cell cycle, we detected an activation of the apoptotic and autophagy processes in colon cancer cells exposed to the HT and cetuximab combination. Although, we found an increased phosphatidylserine externalization, the unaffected caspase-3 expression in colon cancer cells exposed to HT and cetuximab combination indicated a caspase-independent apoptosis mechanism. AIF translocation from mitochondria into nuclei, a marker of caspase-independent apoptosis, suggested that apoptosis in cancer cells is possibly related to mitochondrial dysfunction. Autophagy activation, mainly detected by a sharp rise of Beclin-1 levels, is, to a greater extent, associated with the ubiquitin system stimulation promoted by HT. However, we cannot exclude that it was associated with other effects previously reported for cetuximab [25]. The contribution of autophagy in the anti-tumoral activity of the combination needs further investigations.
Of relevance, for its clinical implications, are the findings that the HT and cetuximab combination preserved the normal colon and skin epithelial functions [26] as it failed to affect the proliferation of CCD-18Co and CaCo2 cells, as well as the membrane junctions of human keratinocytes (see Figure 12).
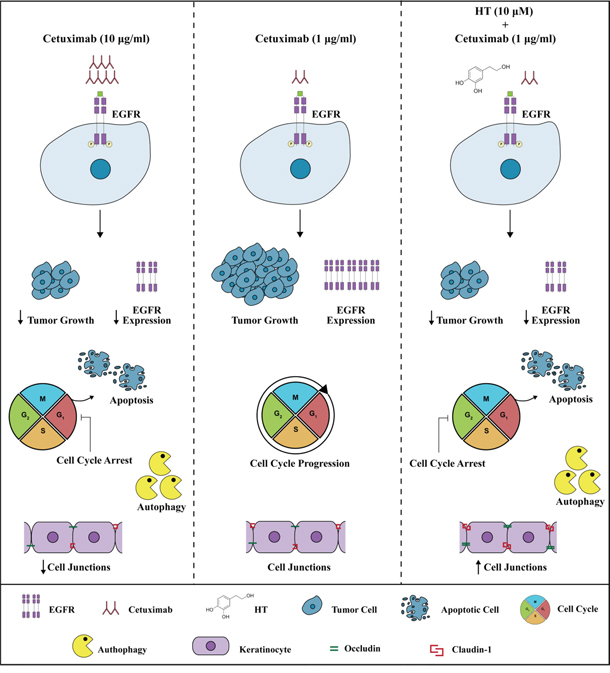
Figure 12: Effects of HT-Cetuximab combination on tumor and normal epithelial cells. Cetuximab at 10 μg/ml, but not at 1μg/ml, blocks the cell cycle in G1 phase, promotes apoptosis, and autophagy in colon tumor cells, and significantly reduces cell membrane junctions in normal epithelial cells (left vs. middle panel). The combination of Cetuximab 1μg/ml with low concentration of HT (10 μM) shows cytotoxic effects on tumor cells (inhibition of cell cycle in G2/M phase, induction of apoptosis and autophagy), without affecting normal epithelial cells (right panel vs. middle and left panels).
In sum, the polyphenol HT combined with the anti-EGFR antibody cetuximab, produces a robust inhibition of colon cancer cell growth, a remarkable effect that occurs at concentrations of each agent representing a fraction (approx. 1/10) of that producing near maximal effect as single molecules. Further, while the maximal effects of HT, as single compound, occur at concentrations borderline between physiological and pharmacological setting (100 μM), in the combination with the cetuximab, HT effects occur at physiological/nutritional setting (10 μM), suggesting that a controlled diet containing olive oil, during chemotherapy of colon tumor might enhance the effects of EGFR inhibitors.
We show evidence that the two agents cooperate in reducing the oncogenic input to colon cancer cells by two linked mechanisms. First, they accelerate EGFR turnover through ubiquitination, and curtail EGFR receptor density, enabling a reduced concentration of cetuximab to exert tumor inhibitory efficacy. Second, they provoke a cell cycle arrest at G2/M phase by inducing the CDK inhibitors p21 and p27 expression and the ensuing the apoptotic process. Thus, these findings may provide a rational mechanistic framework for the health benefits reported in epidemiological studies on a variety of nutritional style, particularly the well-known mediterranean diet [12, 13, 27]. Given the observed HT-induced down-shift of cetuximab potency, without compromising its antitumor efficacy, one wonders whether these findings might be translated into the cancer chemotherapy regimens in humans. This study suggests that an appropriate diet might considerably attenuate the severe side effects (e.g. skin and hematological disturbances) often associated with cetuximab and other agents with similar mechanism, which are commonly administered at maximal effective doses.
MATERIALs AND METHODS
Cell lines
HT-29 (passages 10-20, ATCC® HTB-38™) and WiDr (passages 5-20, ATCC® CCL-218™) human colorectal adenocarcinoma cells, CCD-18Co (passages 2–15, ATCC® CRL-1459™) human colon fibroblast cells and CaCo2 (passages 12–20, ATCCR® HTB-37™) human colorectal adenocarcinoma cells differentiated in intestinal cells as described in the next section, were obtained from the American Type Culture Collection (ATCC, LGC Standards S.r.l, Italy). HaCaT cells (passages 3-7) immortalized human keratinocytes were acquired from Voden medical (Meda, MB, Italy). All the cell lines were certified by STRA and cultured as recommended.
All the cell lines were immediately expanded after delivery (up to 6 x 10⁷ cells) and frozen down (1 x 10⁶/vial) such that all the cell lines could be restarted after a maximum of 10 passages every 3 months from a frozen vial of the same batch of cells. Control of mycoplasma was done from a frozen vial.
Differentiation of CaCo2 cell line
CaCo2 cells were seeded in T75 flasks at a density of 6.6 × 10⁴ cells/ml and were maintained for 21 days of culture. Fresh complete growth medium was added every two days.
After the selection of 21-day cultured cells in T75 flasks CaCo2 cells were differentiated cells and used as intestinal cells [28].
Reagents
Reagents were as follows: celLytic MT cell lysis reagent (C3228), anti-β-actin (A5441), DAPI (D9542), Fluoromount Aqueous Mounting Medium (F4680), Triton X-100 (T8787), Vybrant MTT (M5655) and crystal violet (C3886, Sigma Aldrich, Milan, Italy); HT (70604, Cayman Chemicals, VinciBiochem, Vinci, Italy); EGF (100-008, RELIAtech, VinciBiochem, Vinci, Italy), cetuximab was kindly provided by Azienda Ospedaliera Universitaria Senese, Siena, Italy.
MTT assay
Cell proliferation was quantified by Vybrant MTT cell proliferation assay as described [29]. Briefly, cells (3 x 10³) were seeded in 96-multiwell plates in medium with 10 % serum for 24 h and then exposed to HT (1, 3, 10, 30, 100 or 300 μM, corresponding to the range 0.1542 – 46.26 μg/ml), cetuximab (0.01, 0.1, 1, 10 or 100 μg/ml) with/without EGF (5 ng/ml) for 48 h (with treatment of HT every 24 h). Data are reported as cell survival at 540 nm absorbance/well.
Cell fractionation assay
To obtain cytosolic, mitochondrial and nuclear fractions, 2.5 x10⁶ cells were plated in two 10 cm diameter dishes, maintained in growth medium with 10 % FBS for 18 h and then stimulated with HT (10 μM), cetuximab (1 μg/ml) for 24 h. Cells were harvested by centrifugation at 300 x g for 5 min and re-suspended in 5 ml of 1X Buffer A to 6.6 x 10⁶ cells/ml from Abcam Cell Fractionation Kit (ab109719). Cell suspension was diluted with equal volume of Buffer B, incubated with constant mixing for 7 min at RT, and centrifuged at 5,000 x g for 1 min at 4°C. The supernatant was centrifuged at 10,000 x g for 1 min at 4°C (cytosolic fraction). The pellet was re-suspended in Buffer A, and the suspension was diluted with equal volume of Buffer C, incubated with constant mixing for 10 min at RT and centrifuged at 5,000 x g for 1 min at 4°C. The supernatant was centrifuged at 10,000 x g for 1 min at 4°C (mitochondrial fraction). The pellet was re-suspended in Buffer A (this is the nuclear fraction). All fractions were analyzed for AIF (1:1,000, Cell Signaling). Western blot was performed as described [2]. Images were digitized with the program CHEMI DOC Quantity One, blots were analyzed in triplicate by densitometry using NIH Image 1.60B5 software, and the results in arbitrary densitometric units (A.D.U.) were normalized for β-tubulin, COX IV or lamin (Sigma Aldrich).
Immunoblot analysis
Total protein lysates were obtained using celLytic MT cell lysis reagent as described [2]. Antibodies used are as follows: anti-EGFR (4267), anti-p18 (2986), anti-p21 (2947), anti-p27 (3686), anti-cyclin D1 (2926), anti-cyclin D3 (2936), anti-CDK2 (2546), anti-CDK4 (2906), anti-CDK6 (3136), anti-cyclin B1 (4138), anti-cyclin E1 (4129), anti-AIF (5318), anti COX IV (4850), anti-LC3 I and II (12741), anti-Atg-7 (8558), anti-beclin (3495) and anti-caspase 3 (9662, Cell Signaling, Leiden, the Netherlands). Cells were stimulated with HT (10 μM), cetuximab (1 μg/ml) with/without EGF (5 ng/ml) for 8, 24 or 48 h (with administration of HT every 24 h). Images were digitalized with CHEMI DOC Quantity One program (Biorad, Hercules, CA, USA), blots were analyzed in triplicate by densitometry using NIH Image 1.60B5 software, and the arbitrary densitometric units (A.D.U.) were normalized for β-actin.
Immunofluorescence
3x10⁴ cells were cultured on coverslips, treated with HT (10-100 μM), cetuximab (1-10 μg/ml) with/without EGF (5 ng/ml) for 8-24 or 48 h (with treatment of HT every 24 h) and then fixed in paraformaldehyde (4%, 10 min), washed in PBS and permeabilized, if necessary, with Triton X-100 (0.5% in PBS containing 0.5% BSA) and then incubated with BSA (45 min). Cells were then incubated for 16 h with anti-EGFR (1:40), anti-AIF (1:50, Cell Signaling), anti-phosphatedylserine (1:50, 05-719 Merk Millipore), anti-occludin (1:80, 71-1500 ZYMED) diluted in PBS containing 0.5% BSA. To investigate phosphatedylserine externalization on cell membranes, cells were fixed in paraformaldehyde (4%, 10 min), washed in PBS, incubated with BSA (45 min) without permeabilization, and then incubate for 16 h with anti-phosphatedylserine (1:50, 05-719 Merk Millipore) diluted in PBS containing 0.5% BSA. After incubation with the secondary antibody ALEXAFLUOR 488 anti-mouse or anti-rabbit (A11001, A11011 respectively; 1:200 1 h, Thermo Fisher), cells were washed and incubated with DAPI (1 μg/mL, 20 min), washed and the coverslips were mounted in Fluoromount Aqueous Mounting Medium.
Cell cycle
Cell cycle distribution was analyzed using flow cytometry after propidium iodide staining. Colon cells (7 x 10⁵) were seeded in 6-multiwell plates in growth medium with 10% serum for 24 h, left overnight to allow for cell attachment, and then exposed to 0.1 % serum for 24 h and then treated with HT (10 μM), cetuximab (1 μg/ml) with/without EGF (5 ng/ml) for 48 h (with treatment of HT every 24 h). Cells were then washed three times with PBS, trypsinized and collected by centrifugation at 0.3 x g for 5 min. The cells were fixed overnight in 80% ethanol at −20°C, then washed twice with PBS and incubated with 0.5 ml of PBS containing 100 μg/ml RNase (R6148, Sigma Aldrich) and 50 μg/ml propidium iodide (P4170, Sigma Aldrich) at 37° C for 30 min. Cell cycle distribution was analyzed by measuring DNA content using a flow cytometer (BD Bioscences, Milan, Italy). Data are analyzed in triplicate by Cell Quest Pro, BD [30, 31].
Clonogenic assay
For clonogenic assay, HT-29 and WiDr cells, were stimulated with HT (10 μM) and cetuximab (1 μg/ml) for 48 h (with treatment of HT every 24 h) with/without EGF (5 ng/ml). Following treatments, cells were plated in 60 mm culture dishes (at a density of 1,000 cells/dish) in medium containing 1% fetal calf serum, and then kept in a humidified incubator at 37° C and 5% CO2 for 2 weeks. Colonies (400 cells) with 50% plate efficiency were fixed and stained with 0.05% crystal violet in 10% ethanol and counted. Data are expressed as surviving factor (SF), that indicates the number of colonies that arise after treatment of cells, expressed in terms of PE (PE is the ratio of the number of colonies to the number of cells seeded) [32].
Statistical analysis
Results are expressed as means ± SD or ±SEM. Statistical analysis was carried out using Student's t test, two-away ANOVA, followed by Bonferroni post-test for multiple comparison. P<0.05 was considered statistically significant.
Abbreviations
AIF: apoptosis inducing factor; CC: colon cancer; CDK: cyclin-dependent protein kinases; EGF: epidermal growth factor; EGFR: epidermal growth factor receptor; HT: hydroxytyrosol or 2-(3,4-dihydroxyphenil)ethanol; mAbs: monoclonal antibodies; PBS: phosphate buffer saline; PE: ratio of the number of colonies to the number of cells seeded; SD: standard deviation; SF: surviving factor.
Author contributions
ET designed, performed the research study, analyzed the data and wrote the paper
GN performed the research and analyzed the data
MF performed the research and analyzed the data
AG analyzed the data and wrote the paper
MZ analyzed the data and wrote the paper
SD designed the research study, analyzed the data and wrote the paper
CONFLICTS OF INTEREST
The authors disclose any potential conflicts of interest.
FUNDING
This work was supported by Associazione Italiana sul Cancro (AIRC) under Grant IG10731 MZ (Marina Ziche); Consorzio per la tutela dell'Olio Extravergine di Oliva Toscano IGP, and Regione Toscana, bando Nutraceutica 2014, OlivaPlus Project (Sandra Donnini). ET and GN are supported by AIRC.
REFERENCES
1. Guichard C, Pedruzzi E, Fay M, Marie JC, Braut-Boucher F, Daniel F, Grodet A, Gougerot-Pocidalo MA, Chastre E, Kotelevets L, Lizard G, Vandewalle A, Driss F, et al. Dihydroxyphenylethanol induces apoptosis by activating serine/threonine protein phosphatase PP2A and promotes the endoplasmic reticulum stress response in human colon carcinoma cells. Carcinogenesis. 2006; 27: 1812-1827.
2. Terzuoli E, Donnini S, Giachetti A, Iñiguez MA, Fresno M, Melillo G, Ziche M. Inhibition of hypoxia inducible factor-1alpha by dihydroxyphenylethanol, a product from olive oil, blocks microsomal prostaglandin-E synthase-1/vascular endothelial growth factor expression and reduces tumor angiogenesis. Clin Cancer Res. 2010; 16: 4207-4216.
3. Terzuoli E, Giachetti A, Ziche M, Donnini S. Hydroxytyrosol, a product from olive oil, reduces colon cancer growth by enhancing epidermal growth factor receptor degradation. Mol Nutr Food Res. 2016; 60: 519-529.
4. Fabiani R, De Bartolomeo A, Rosignoli P, Servili M, Selvaggini R, Montedoro GF, Di Saverio C, Morozzi G. Virgin olive oil phenols inhibit proliferation of human promyelocytic leukemia cells (HL60) by inducing apoptosis and differentiation. J Nutr. 2006; 136: 614-619.
5. Fabiani R, Rosignoli P, De Bartolomeo A, Fuccelli R, Morozzi G. Inhibition of cell cycle progression by hydroxytyrosol is associated with upregulation of cyclin-dependent protein kinase inhibitors p21(WAF1/Cip1) and p27(Kip1) and with induction of differentiation in HL60 cells. J Nutr. 2008; 138: 42-48.
6. Fabiani R, Fuccelli R, Pieravanti F, De Bartolomeo A, Morozzi G. Production of hydrogen peroxide is responsible for the induction of apoptosis by hydroxytyrosol on HL60 cells. Mol Nutr Food Res. 2009; 53: 887-896.
7. Perez-Jimenez F, Alvarez de Cienfuegos G, Badimon L, Barja G, Battino M, Blanco A, Bonanome A, Colomer R, Corella-Piquer D, Covas I, Chamorro-Quiros J, Escrich E, Gaforio JJ, et al. International conference on the healthy effect of virgin olive oil. Eur J Clin Invest. 2005; 35: 421-424.
8. Psaltopoulou T, Kosti RI, Haidopoulos D, Dimopoulos M, Panagiotakos DB. Olive oil intake is inversely related to cancer prevalence: a systematic review and a meta-analysis of 13,800 patients and 23,340 controls in 19 observational studies. Lipids Health Dis. 2011; 10: 127.
9. Omar SH. Cardioprotective and neuroprotective roles of oleuropein in olive. Saudi Pharm J. 2010; 18: 111-121.
10. Hillestrøm PR, Covas MI, Poulsen HE. Effect of dietary virgin olive oil on urinary excretion of etheno-DNA adducts. Free Radic Biol Med. 2006; 41: 1133-1138.
11. Manna C, Galletti P, Cucciolla V, Montedoro G, Zappia V. Olive oil hydroxytyrosol protects human erythrocytes against oxidative damages. J Nutr Biochem. 1999; 10: 159-165.
12. Huang YF, Zhu DJ, Chen XW, Chen QK, Luo ZT, Liu CC, Wang GX, Zhang WJ, Liao NZ. Curcumin enhances the effects of irinotecan on colorectal cancer cells through the generation of reactive oxygen species and activation of the endoplasmic reticulum stress pathway. Oncotarget. 2017; 8: 40264-20275. https://doi.org/10.18632/oncotarget.16828.
13. Coccia A, Mosca L, Puca R, Mangino G, Rossi A, Lendaro E. Extra-virgin olive oil phenols block cell cycle progression and modulate chemotherapeutic toxicity in bladder cancer cells. Oncol Rep. 2016; 36: 3095-3104.
14. Perez-Torres M, Guix M, Gonzalez A, Arteaga CL. Epidermal growth factor receptor (EGFR) antibody down-regulates mutant receptors and inhibits tumors expressing EGFR mutations. J Biol Chem. 2006; 281: 40183-40192.
15. Wang H, Nicolay BN, Chick JM, Gao X, Geng Y, Ren H, Gao H, Yang G, Williams JA, Suski JM, Keibler MA, Sicinska E, Gerdemann U, et al. The metabolic function of cyclin D3-CDK6 kinase in cancer cell survival. Nature. 2017; 546: 426-430. https://doi.org/10.1038/nature22797.
16. Normanno N, De Luca A, Bianco C, Strizzi L, Mancino M, Maiello MR, Carotenuto A, De Feo G, Caponigro F, Salomon DS. Epidermal growth factor receptor (EGFR) signaling in cancer. Gene. 2006; 366: 2-16.
17. Grana X, Reddy P. Cell cycle control in mammalian cells: role of cyclins, cyclin-dependent kinases (CDKs), growth suppressor genes and cyclin-dependent kinase inhibitors (CDKIs). Oncogene. 1995; 11: 211-219.
18. Molinari M. Cell cycle checkpoints and their inactivation in human cancer. Cell Prolif. 2000; 33: 261-274.
19. Abbas T, Dutta A. p21 in cancer: intricate networks and multiple activities. Nat Rev Cancer. 2009; 9: 400-414.
20. Kastan MB, Bartek J. Cell-cycle checkpoints and cancer. Nature. 2004; 432: 316-323.
21. Kastan MB, Canman CE, Leonard CJ. P53, cell cycle control and apoptosis: implications for cancer. Cancer Metastasis Rev. 1995; 14: 3-15.
22. Pavletich NP. Mechanisms of cyclin-dependent kinase regulation: structures of cdks, their cyclin activators, and CIP and INK4 inhibitors. J Mol Biol. 1999; 287: 821-828.
23. Krall AS, Christofk HR. Cell cycle: division enzyme regulates metabolism. Nature. 2017; 546: 357-358. https://doi.org/10.1038/nature22504.
24. Corona G, Deiana M, Incani A, Vauzour D, Dessì MA, Spencer JP. Hydroxytyrosol inhibits the proliferation of human colon adenocarcinoma cells through inhibition of ERK1/2 and cyclin D1. Mol Nutr Food Res. 2009; 53: 897-903.
25. Li X, Fan Z. The epidermal growth factor receptor antibody cetuximab induces autophagy in cancer cells by downregulating HIF-1alpha and Bcl-2 and activating the beclin 1/hVps34 complex. Cancer Res. 2010; 70: 5942-5952.
26. Holcmann M, Sibilia M. Mechanisms underlying skin disorders induced by EGFR inhibitors. Mol Cell Oncol. 2015; 2: e1004969.
27. Kim E, Davidson LA, Zoh RS, Hensel ME, Salinas ML, Patil BS, Jayaprakasha GK, Callaway ES, Allred CD, Turner ND, Weeks BR, Chapkin RS. Rapidly cycling Lgr5+ stem cells are exquisitely sensitive to extrinsic dietary factors that modulate colon cancer risk. Cell Death Dis. 2016; 7: e2460.
28. Catalán Ú, López de Las Hazas MC, Rubió L, Fernández-Castillejo S, Pedret A, de la Torre R, Motilva MJ, Solà R. Protective effect of hydroxytyrosol and its predominant plasmatic human metabolites against endothelial dysfunction in human aortic endothelial cells. Mol Nutr Food Res. 2015; 59: 2523-2536.
29. Donnini S, Finetti F, Solito R, Terzuoli E, Sacchetti A, Morbidelli L, Patrignani P, Ziche M. EP2 prostanoid receptor promotes squamous cell carcinoma growth through epidermal growth factor receptor transactivation and iNOS and ERK1/2 pathways. FASEB J. 2007; 21: 2418-2430.
30. Santulli C, Brizi C, Micucci M, Del Genio A, De Cristofaro A, Bracco F, Pepe GL, di Perna I, Budriesi R, Chiarini A, Frosini M. Castanea sativa Mill. bark extract protects U-373 MG cells and rat brain slices against ischemia and reperfusion injury. J Cell Biochem. 2017; 118: 839-850.
31. Brizi C, Santulli C, Micucci M, Budriesi R, Chiarini A, Aldinucci C, Frosini M. Neuroprotective effects of Castanea sativa Mill. bark extract in human neuroblastoma cells subjected to oxidative stress. J Cell Biochem. 2016; 117: 510-520.
32. Franken NA, Rodermond HM, Stap J, Haveman J, van Bree C. Clonogenic assay of cells in vitro. Nat Protoc. 2006; 1: 2315-2319.