
INTRODUCTION
Gastric cancer (GC) belongs to one of the most frequently diagnosed cancer in the world with both high mortality and incidence. According to the Global Cancer Statistics 2012, more than 7.2 million GC-related deaths and about 9.5 million new diagnosed cases occurred worldwide [1]. Moreover, GC ranked the second in both the most common incident cancer and the leading cause of cancer death in China, 2015 [2]. The poor prognosis of GC patients is a significant reflection of the fact that most GC cases are diagnosed at advanced stages [3]. The detection of GC in an early stage, effective prediction of outcomes before treatment, and development of novel therapeutic targets are effective strategies to improve the prognosis of GC. Therefore, the identification of new biomarkers related to prognosis is essential for improving outcomes in GC patients.
Long non-coding RNAs (lncRNAs), greater than 200 nucleotides that have no protein-coding potential. LncRNAs have been widely identified in various diseases, including cancers. According to the recent evidence, lncRNAs can regulate different processes of gene expression by sequestering and binding them [4]. LncRNAs play critical roles in a variety of mechanisms, including cell development and differentiation [5], cell growth arrest and apoptosis [6], and X chromosome inactivation [7].
A series of lncRNAs have been discovered and confirmed as tumor suppressors or oncogenes. For example, MEG3 played as a tumor suppressor through the activation of p53 [8], and H19 performed as an oncogene in GC and colon cancer [9, 10]. Due to the contributions in the development and progression of cancer, lncRNAs were regarded as possible biomarkers for early diagnosis and prognosis. Till now, lncRNAs acted as biomarkers for diagnosis in GC have been reported in many studies. However, limited research reported the use of lncRNAs, especially lncRNA signature as biomarkers for Overall Survival (OS) in GC.
The object of this study aims to identify a novel lncRNA signature for GC prognosis through the data mining in The Cancer Genome Atlas (TCGA) (http://cancergenome.nih.gov). By performing a comprehensive lncRNA expression profile analysis, we identified a lncRNA signature in GC with four lncRNAs (LINC01018, LOC553137, MIR4435-2HG, and TTTY14), as a new candidate indicator with the potential to predict the OS in GC patients.
RESULTS
Patient characteristics
There were 379 GC patients and 35 normal controls included in the present study obtained from TCGA database. After the initial screening TNM stage, the GC patients were divided into four groups: stage I-, stage II-, stage III- and stage IV-group. The clinical features were summarized in Table 1. The mean ± standard deviation (STDEV) age for all patients was 65.189 ± 10.694. During the follow-up (mean ± STDEV: 599.800 ± 541.537 days), 151 of 379 (39.842%) patients died. Information on outcomes of first course treatment for 328 patients was available, including 231 (70.427%) achieved complete remission (CR), 6 (1.829%) partial remission (PR), 27 (8.232%) stable disease (SD), and 64 (19.512%) progressive disease (PD).
Table 1: The predictive values of related clinical features and risk score
Variables |
Patient |
|
|---|---|---|
Race |
White |
230 |
Black |
11 |
|
Asian |
84 |
|
Gender |
Female |
136 |
Male |
238 |
|
Age |
<=65 |
172 |
>65 |
198 |
|
Tumor stage |
I |
53 |
II |
119 |
|
III |
163 |
|
IV |
39 |
|
T stage |
T1 |
18 |
T2 |
78 |
|
T3 |
172 |
|
T4 |
106 |
|
N stage |
N0 |
117 |
N1 |
98 |
|
N2 |
75 |
|
N3 |
78 |
|
M stage |
M0 |
336 |
M1 |
24 |
|
Histologic grade |
G1 |
7 |
G2 |
130 |
|
G3 |
229 |
|
neoplasm subdivision |
gastroesophageal junction |
38 |
cardia/proximal |
50 |
|
fundus/body |
130 |
|
antrum/distal |
142 |
|
Primary therapy outcome |
CR |
231 |
PR |
6 |
|
SD |
27 |
|
PD |
64 |
|
Radiotherapy |
NO |
283 |
YES |
64 |
|
Targeted molecular |
NO |
187 |
YES |
157 |
|
Anti-reflux |
NO |
140 |
YES |
35 |
|
Family history |
NO |
283 |
YES |
18 |
|
HP infection |
NO |
144 |
YES |
20 |
|
Neoplasm cancer |
Tumor free |
221 |
With tumor |
125 |
|
Residual tumor |
R0 |
308 |
R1+R2 |
31 |
CR: complete remission; PR: partial remission; SD: stable disease, PD: progressive disease.
Identification of differentially expressed lncRNAs
1081 lncRNAs were identified from initially performed differential expression analysis from the TCGA database in GC. Fold change >2 and P value <0.05 were set up to be origins to identify significantly differentially expressed lncRNAs. Then we obtained 226 differentially expressed lncRNAs between stages I GC and adjacent normal gastric tissue, 173 differentially expressed lncRNAs between stages II GC and adjacent normal gastric tissue, 198 differentially expressed lncRNAs between stages III GC and adjacent normal gastric tissue, and 206 differentially expressed lncRNAs between stages IV GC and adjacent normal gastric tissue (fold change > 2, P value < 0.05). When we combined these four groups of differentially expressed lncRNAs together, 131 differentially expressed lncRNAs showed consistently differential expression (Figure 1 and Figure 2).
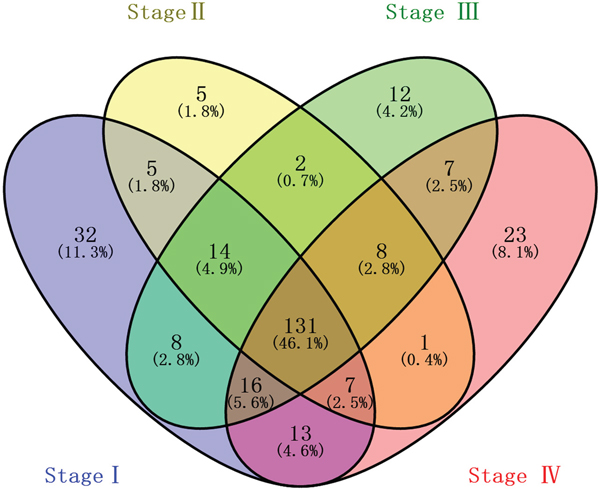
Figure 1: Venn diagram analysis of differentially expressed lncRNAs in gastric cancer. Each oval represents a group. The brown intersection in the middle represents RNAs, which are consistently and significantly differentially expressed in four groups.
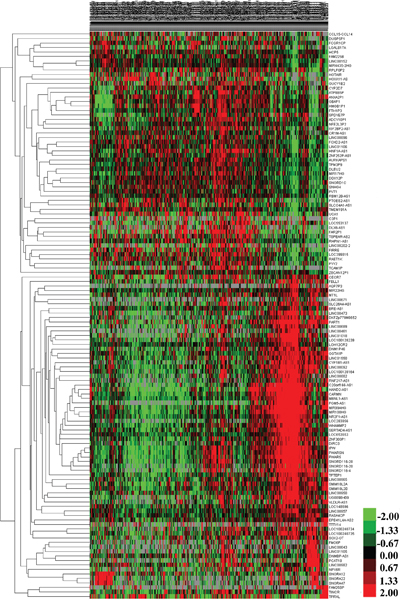
Figure 2: The differential expression of intersected lncRNAs in gastric cancer. A heatmap is showing the differentially expressed RNAs.
Identification of lncRNA significantly associated with OS and prognostic signature construction
By subjecting differentially expressed lncRNAs expression data in 379 patients from TCGA database to the univariate Cox regression model, a total of 23 lncRNAs were identified as candidate biomarkers significantly associated with OS (P-value < 0.05) (Table 2). Multivariate Cox regression analysis was performed to take into account for the interrelated relationship among 23 lncRNAs and identified four lncRNAs (LINC01018, LOC553137, MIR4435-2HG, and TTTY14) as independent biomarkers for OS in GC patients (P < 0.05) (Table 3 and Figure 3).
Table 2: Prognostic value of the differentially expressed lncRNAs by univariate cox regression analysis
LncRNA |
Estimate |
StdErr |
ChiSq |
P |
HR( 95%CI) |
|---|---|---|---|---|---|
CARMN |
0.449 |
0.166 |
7.271 |
0.007* |
1.566(1.130-2.170) |
CYP2D7 |
-0.345 |
0.167 |
4.279 |
0.039* |
0.708(0.511-0.982) |
DNM1P46 |
0.439 |
0.168 |
6.851 |
0.009* |
1.551(1.117-2.154) |
HAND2-AS1 |
0.378 |
0.167 |
5.132 |
0.023* |
1.459(1.052-2.024) |
LINC00461 |
0.349 |
0.166 |
4.404 |
0.036* |
1.417(1.023-1.962) |
LINC00473 |
0.348 |
0.166 |
4.375 |
0.036* |
1.416(1.022-1.963) |
LINC00908 |
0.395 |
0.167 |
5.598 |
0.018* |
1.484(1.070-2.059) |
LINC00965 |
0.357 |
0.168 |
4.529 |
0.033* |
1.428(1.029-1.984) |
LINC01018 |
0.491 |
0.169 |
8.481 |
0.004* |
1.634(1.174-2.275) |
LOC100128239 |
0.368 |
0.167 |
4.876 |
0.027* |
1.445(1.042-2.003) |
LOC553137 |
0.541 |
0.168 |
10.386 |
0.001* |
1.718(1.236-2.387) |
MIR100HG |
0.381 |
0.166 |
5.247 |
0.022* |
1.464(1.057-2.028) |
MIR4435-2HG |
0.348 |
0.166 |
4.390 |
0.036* |
1.417(1.023-1.962) |
MIR99AHG |
0.530 |
0.168 |
9.967 |
0.002* |
1.699(1.223-2.361) |
NR2F1-AS1 |
0.471 |
0.167 |
7.937 |
0.005* |
1.601(1.154-2.222) |
PWAR5 |
0.049 |
0.167 |
6.004 |
0.014* |
1.505(1.085-2.086) |
RNF217-AS1 |
0.399 |
0.167 |
5.675 |
0.017* |
1.490(1.073-2.068) |
SMIM10L2A |
0.334 |
0.167 |
3.981 |
0.046* |
1.397(1.006-1.939) |
SMIM10L2B |
0.524 |
0.170 |
9.507 |
0.002* |
1.689(1.210-2.357) |
SNORD116-20 |
0.366 |
0.168 |
4.752 |
0.029* |
1.441(1.038-2.002) |
TTTY14 |
0.370 |
0.167 |
4.901 |
0.027* |
1.447(1.043-2.008) |
VLDLR-AS1 |
0.473 |
0.167 |
7.983 |
0.005* |
1.605(1.156-2.228) |
WHAMMP2 |
0.515 |
0.168 |
9.443 |
0.002* |
1.674(1.205-2.325) |
HR: hazard ratio; CI: confidence interval; *: P<0.05.
Table 3: Prognostic value of the differentially expressed lncRNAs by multivariate Cox regression analysis
LncRNA |
Estimate |
StdErr |
ChiSq |
P |
HR( 95%CI) |
|---|---|---|---|---|---|
LINC01018 |
0.455 |
0.170 |
7.164 |
0.007* |
1.577(1.130-2.201) |
LOC553137 |
0.483 |
0.169 |
8.147 |
0.004* |
1.621(1.163-2.258) |
MIR4435-2HG |
0.361 |
0.167 |
4.699 |
0.030* |
1.435(1.035-1.990) |
TTTY14 |
0.389 |
0.167 |
5.393 |
0.020* |
1.475(1.062-2.047) |
HR: hazard ratio; CI: confidence interval; *: P<0.05.
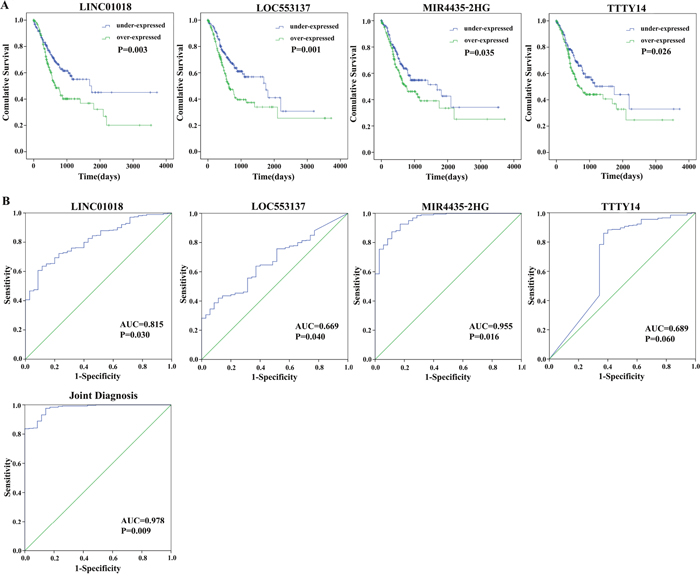
Figure 3: Four differentially expressed lncRNAs (LINC01018, LOC553137, MIR4435-2HG, and TTTY14). (A) Kaplan-Meier curves showing the relationship between the four lncRNAs and overall survival. The cases were divided into under- and over-expression groups by the mean lncRNAs level; (B) ROC curves of the four lncRNAs to distinguish gastric cancer tissue from adjacent normal tissues.
We performed univariate Cox regression analysis to identify the four lncRNAs within each subclass of clinical features as follow: TNM stage, T stage, M stage, and N stage. Table 4 presented the HR for the association of these four lncRNAs with OS in each category.
Table 4: lncRNAs associated with prognosis in different clinical subclasses
lncRNA |
Tumor stage |
Tumor stage |
T I/II |
T III/IV |
N I/II |
N III/IV |
|---|---|---|---|---|---|---|
LINC01018 |
- |
1.380(1.044-1.823) |
- |
1.361(1.073-1.726) |
- |
1.269(1.002-1.608) |
LOC553137 |
- |
1.381(1.045-1.824) |
- |
1.320(1.040-1.674) |
- |
1.315(1.037-1.668) |
MIR4435-2HG |
1.365(1.011-1.843) |
- |
- |
1.370(1.080-1.738) |
- |
- |
TTTY14 |
- |
- |
- |
- |
- |
- |
Afterwards, the risk score for predicting the OS was constructed with the formula: Risk score = expLINC01018*(0.455) + expLOC553137*(0.483) + expMIR4435-2HG*(0.361) + expTTTY14*(0.389).
Based on the risk score model mentioned above, GC patients were classified as low- or high-risk patients using the median risk score as the cutoff value, which divided into the low-risk group (n = 190) and high-risk group (n = 189) (Figure 4). The risk score could largely predict the 5-year survival of GC patients, as the area under ROC curve (AUC) was 0.627 (Figure 5A). Meanwhile, K-M curves confirmed that the survival time of patients in the low-risk group was 642.382 ± 533.037 days, predominantly longer than that of the high-risk group (561.128 ±517.423 days, P = 0.001, Figure 5B).
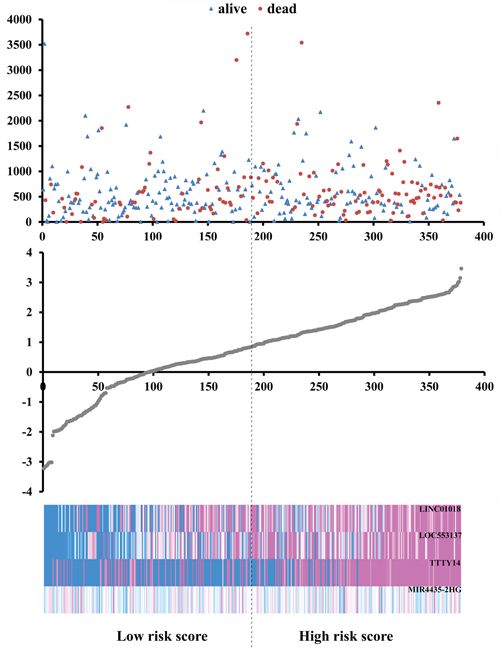
Figure 4: Risk score analysis of the differentially expressed lncRNA signature of gastric cancer. Survival status and duration of cases (Top); risk score of lncRNA signature (Middle); low and high score groups for the four lncRNAs (Bottom).
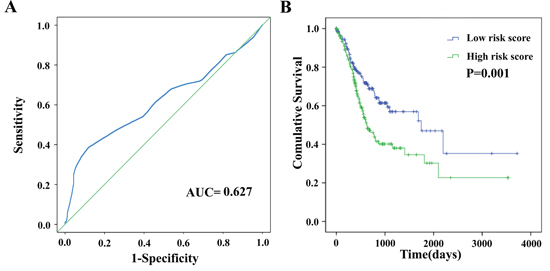
Figure 5: The four differentially expressed lncRNA signature of gastric cancer for the outcome. (A) The risk score is shown by the time-dependent ROC curve for predicting 5-year survival. (B) The Kaplan-Meier test of the risk score for the overall survival.
The prognostic value of four-lncRNA signature is independent of other clinical features
Furthermore, to examine whether the prognostic value of the four-lncRNA signature is independent of other clinical features, the univariate and multivariate Cox proportional hazard regression analyses were performed to analyze with risk score and other clinical features, such as including race, age, gender, Tumor stage and T stage, as covariates in TCGA datasets.
The univariate Cox proportional hazards regression showed that some features could predict poorer survival of GC, including age, Tumor stage, T stage, N stage, M stage, Primary therapy outcome, Radiotherapy, Residual tumor (Table 5). However, when analyzed by multivariate Cox proportional hazards regression test, only Residual tumor (P = 0.047) together with the risk score (P = 0.004), was an independent prognostic indicator of GC (Table 5). The K-M curves of the above clinical features are shown that Tumor stage (P < 0.001), T stage (P = 0.005), N stage (P = 0.008), M stage (P = 0.004), Residual tumor (P < 0.001), and Radiotherapy (P = 0.001) were associated with OS (Figure 6).
Table 5: The predictive values of related clinical features and risk score
Variables |
Univariate analysis |
Multivariate analysis |
|||
|---|---|---|---|---|---|
HR(95% CI) |
P |
HR(95% CI) |
P |
||
Race |
White |
1(reference) |
|||
Black |
1.396(0.646-3.018) |
0.397 |
|||
Asian |
0.839(0.534-1.318) |
0.445 |
|||
Gender |
Female |
1(reference) |
|||
Male |
1.239(0.874-1.756) |
0.229 |
|||
Age |
<=65 |
1(reference) |
|||
>65 |
1.621(1.161-2.263) |
0.005* |
|||
Tumor stage |
I |
1(reference) |
1(reference) |
||
II |
1.505(0.779-2.905) |
0.224 |
0.625(0.171-2.283) |
0.946 |
|
III |
2.514(1.366-4.627) |
0.003* |
0.509(0.097-2.679) |
0.956 |
|
IV |
4.016(1.996-8.079) |
<0.001* |
0.882(0.161-4.827) |
0.435 |
|
T stage |
T1 |
1(reference) |
1(reference) |
||
T2 |
7.405(1.005-54.535) |
0.049* |
2.633(0.337-20.601) |
0.280 |
|
T3 |
10.879(1.512-78.245) |
0.018* |
3.726(0.493-28.149) |
0.375 |
|
T4 |
10.799(1.485-78.519) |
0.019* |
3.747(0.488-28.756) |
0.675 |
|
N stage |
N0 |
1(reference) |
1(reference) |
||
N1 |
1.730(1.079-2.773) |
0.023* |
1.753(0.944-3.256) |
0.075 |
|
N2 |
1.777(1.062-2.974) |
0.029* |
1.560(0.794-3.066) |
0.197 |
|
N3 |
2.736(1.714-4.367) |
<0.001* |
2.475(1.328-4.616) |
0.004* |
|
M stage |
M0 |
1(reference) |
1(reference) |
||
M1 |
2.279(1.287-4.042) |
0.005* |
1.034(0.411-2.604) |
0.786 |
|
Histologic grade |
G1 |
1(reference) |
1(reference) |
||
G2 |
1.004(0.312-3.234) |
0.994 |
2.267(0.482-10.661) |
0.395 |
|
G3 |
1.167(0.369-3.692) |
0.792 |
2.645(0.588-11.886) |
0.267 |
|
neoplasm subdivision |
gastroesophageal junction |
1(reference) |
|||
cardia/proximal |
1.467(0.732-2.938) |
0.280 |
|||
fundus/body |
1.144(0.608-2.151) |
0.677 |
|||
antrum/distal |
1.332(0.714-2.487) |
0.368 |
|||
Primary therapy outcome |
CR |
1(reference) |
|||
PR |
3.021(1.105-8.258) |
0.031* |
|||
SD |
0.829(0.441-1.559) |
0.560 |
|||
PD |
0.651(0.404-1.048) |
0.077 |
|||
Radiotherapy |
NO |
1(reference) |
|||
YES |
0.427(0.255-0.715) |
0.001* |
|||
Targeted molecular |
NO |
1(reference) |
|||
YES |
1.116(0.792-1.573) |
0.530 |
|||
Anti-reflux |
NO |
1(reference) |
|||
YES |
0.838(0.467-1.502) |
0.553 |
|||
Family history |
NO |
1(reference) |
1(reference) |
||
YES |
1.071(0.543-2.114) |
0.842 |
1.057(0.492-2.271) |
0.875 |
|
HP infection |
NO |
1(reference) |
|||
YES |
0.463(0.168-1.281) |
0.138 |
|||
Neoplasm cancer |
Tumor free |
1(reference) |
1(reference) |
||
With tumor |
1.065(0.752-1.507) |
0.724 |
1.243(0.819-1.887) |
0.305 |
|
Residual tumor |
R0 |
1(reference) |
1(reference) |
||
R1+R2 |
3.068(1.895-4.967) |
<0.001* |
1.876(1.009-3.487) |
0.047* |
|
Risk score |
Low |
1(reference) |
1(reference) |
||
High |
1.753(1.257-2.444) |
0.001* |
1.889(1.228-2.905) |
0.004* |
|
HR: hazard ratio; CI: confidence interval; *: P<0.05.
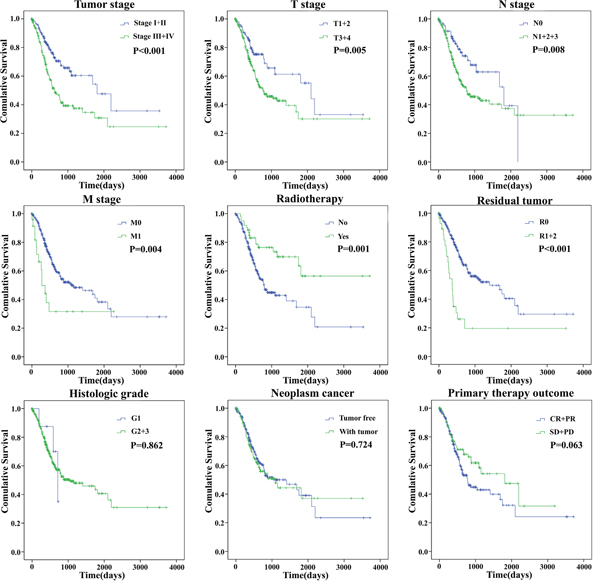
Figure 6: The prognostic value of different clinical features for overall survival of gastric cancer patients. Kaplan-Meier curves of seven independent prognostic indicators. SD, stable disease; PD, progressive disease; CR, complete remission; PR, partial remission.
We assessed the relationship between the risk score based on the differentially expressed lncRNAs signature and various clinical features, and the risk score showed prognostic value for predicting the status (Figure 7). The expression pattern of these four differentially expressed lncRNAs in the GC and adjacent normal tissues, low- and high-score groups were shown in Figure 8.
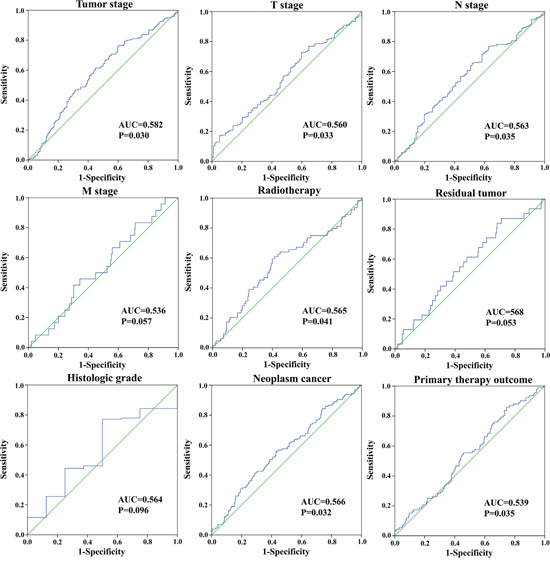
Figure 7: The predictive value of the risk score for clinical features. ROC curve is predicting different clinical features.
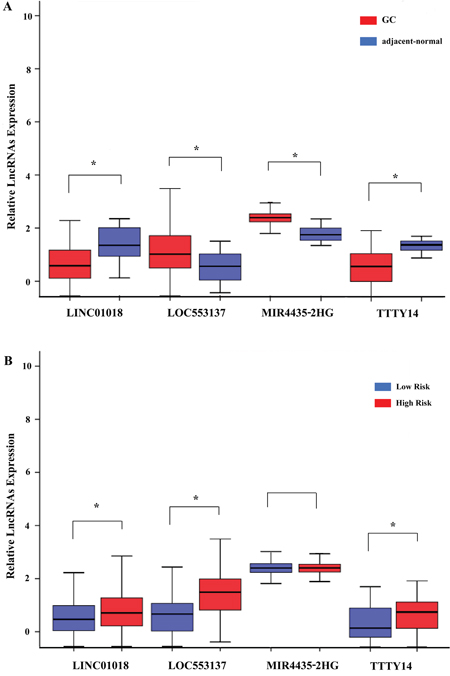
Figure 8: The expression level of the four lncRNAs (LINC01018, LOC553137, MIR4435-2HG, and TTTY14). (A) The expression level of lncRNAs between gastric cancer tissues and adjacent normal tissues; (B) The expression level of lncRNAs between the low-risk and high-risk groups. *P<0.05.
Functional assessment of the four lncRNAs
There were 434 genes identified in TCGA database co-expressed with these four lncRNAs (LINC01018, LOC553137, MIR4435-2HG, and TTTY14) (|R| > 0.5) (Supplementary Table 1). It revealed enrichment of 240 GO Terms and 47 Pathways (P-value of <0.05 and an enrichment score of >1.5; Supplementary Table 2). It was found that the top GO biological process of co-expressed genes was synaptic transmission (GO: 0007268) and transmembrane transport (GO: 0055085) (Figure 9A). After the pathway analysis, the co-expressed genes were mainly enriched in Neuroactive ligand-receptor interaction and Glutamatergic synapse (Figure 9B). For the construction of the protein-protein interaction (PPI) network, there were 106 genes in the PPI network, which were regarded as hub genes (Figure 10).
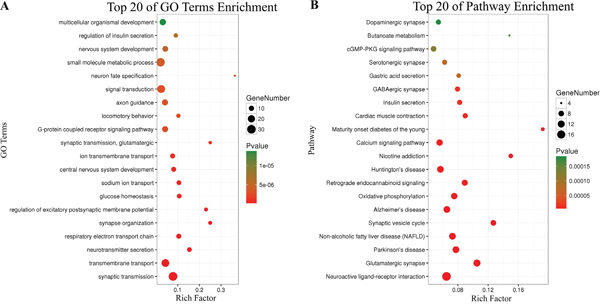
Figure 9: Top 20 enrichment of KEGG pathways and GO terms for co-expressed mRNAs.
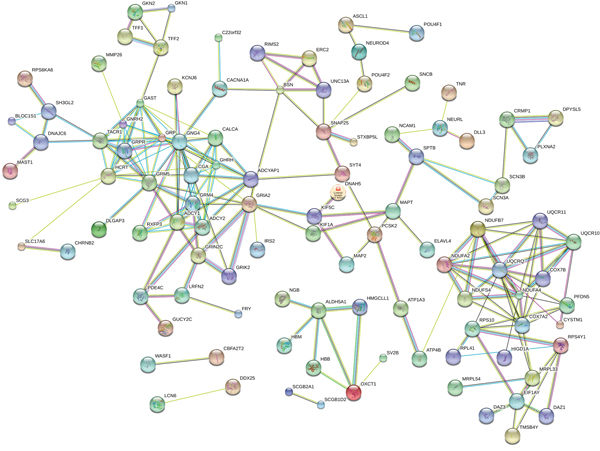
Figure 10: The map represents the protein-protein interaction network of co-expressed genes.
DISCUSSION
Gastric cancer (GC) is one of the deadliest solid tumors with the high global morbidity and mortality [11]. Although over several decades GC shows a slight decline in morbidity and mortality [12], it remains a significant clinical challenge owing to limited detection methods and poor prognosis [13]. The specific biomarkers for its early diagnosis, therapeutic process monitoring, and prognostic evaluation might increase survival rate. Accumulating evidence suggested that lncRNAs may play a major role in tumorigenesis, development, metastasis, the prognosis of GC [10, 14–17]. The recent large-scale genome analysis has revealed the molecular characteristics associated with GC OS [18]. However, most studies focused on miRNA, miRNAs, gene and protein expression [19–24]. With knowledge growing, the functional role of lncRNAs in tumorigenesis and development also represents a significant untapped resource for cancer prognosis.
In the present study, to identify lncRNAs significantly related to GC OS, we divided into groups based on GC patients TNM stage with information from the TCGA database. Firstly, 131 differentially expressed lncRNAs were subjected to univariate Cox proportional hazards regression, with a significance level at 0.05. A total of 23 OS-related lncRNAs were identified. Meanwhile, multivariate Cox hazards regression analysis showed that LINC01018, LOC553137, MIR4435-2HG, and TTTY14 all had a significant prognostic value for GC survival. Then, we set a risk score by combining these four lncRNAs and found that this four-lncRNA signature could independently predict OS in GC patients. The advantage of this study is a combination of clinical features and TCGA data to assess the survival of GC patients by setting a lncRNA-related risk score.
The relationship between differentially expressed lncRNAs and the survival of GC has been studied in small samples via different approaches. Li et al. [16] analyzed the prognostic value of one lncRNA via qRT-PCR array in 84 GC patients and found that higher level of BANCR could predict a poor prognosis for GC patients. Similarly, Fu et al. [25] studied lncRNA-NEAT1 in 140 freshly frozen GC samples and 20 paired adjacent normal gastric tissue samples via qRT-PCR. In addition, Fan et al. [26] has done data mining in GEO database and achieved four studies: GSE63089, GSE50710, GSE38749, and GSE27342, from which they found that AK001094, AK024171, AK093735, NR003573, and BC003519, these five lncRNAs could be considered as an independent risk factor for GC patients.
Although TCGA database has been used to analyze the lncRNA-related signature for GC prognosis [27], compared with previous studies, the advantage of this study was the combination of clinical features and TCGA data and assessed the survival of GC patients by constructing a risk score that associated with lncRNAs. Based on this, the four novel lncRNAs (LINC01018, LOC553137, MIR4435-2HG, and TTTY14) have the reason to be a new risk factor. Besides, the risk score constructed from these four lncRNAs could be served as a prognostic indicator for GC patients.
However, there is no study as of yet investigated the function of those above four lncRNAs. Here, we identified the genes that strongly correlated with the four lncRNAs expression (Pearson |R| > 0.5) in TCGA database. 434 genes were identified co-expressed with the four lncRNAs. The relevant genes were mainly enriched in synaptic transmission, transmembrane transport, Neuroactive ligand-receptor interaction and Glutamatergic synapse. After the PPI network construction, 106 co-expressed genes revealed as hub genes in the regulation of the four lncRNAs in GC.
The findings of this study may have substantial clinical significance; however, some limitations should be taken into consideration. First, we identified the target lncRNAs by using tumor stage of GC, but tumor metastasis was not included. Second, the data extracted from TCGA were based on the RNA-Seq technique; other experimental methods are required to verify the results. Third, the role of LINC01018, LOC553137, MIR4435-2HG, and TTTY14 in GC are still unknown; in vivo and in vitro experiments are expected to answer this question.
In conclusion, by analyzing the GC lncRNA expression profiles in a large-scale database from TCGA, we identified a four-lncRNA signature, which could act as an indicator for GC patient outcome and could be a potential independent biomarker for prognosis prediction of GC. Future functional investigations are required to explore the mechanisms underlying the roles of these lncRNAs in GC.
MATERIALS AND METHODS
TCGA Database
The GC data (Level 3 RNA sequencing) of 443 individuals with clinical information were extracted from TCGA database on April 10, 2017, including data from 408 GC tissues and 35 adjacent normal gastric tissues. The exclusion criteria were listed as follows: (i) histologic diagnosis ruled out GC; (ii) another malignancy besides GC. Then, 379 GC patients were included in this study. As the data was downloaded from the public database, ethical approval was not applicable in this case. Data processing procedures met the policies of TCGA data access and human subject protection (http://cancergenome.nih.gov/publications/publicationguidelines). Of these 379 GC patients, there were 54 GC patients with tumor stage I, 120 GC patients with tumor stage II, 166 GC patients with tumor stage III and 39 GC patients with tumor stage IV.
Identification of dysregulated lncRNAs in GC
Here, only lncRNAs with a description from NCBI or Ensemble were selected for further study. Finally, we obtained the expression profiles of 1801 lncRNAs. The raw data of lncRNA sequencing were post-processed and normalized by TCGA RNASeqv2 system. No further normalizations were applied in the expression profile data in level 3, due to TCGA already normalized these data. To detect the differential expression of lncRNAs, samples were divided into GC tumor tissues vs. adjacent non-tumor gastric tissues, tumor stage I, stage II, stage III, and stage IV. For further analysis, the intersection of lncRNA was selected. The flow chart for bioinformatics analysis was presented in Figure 11.
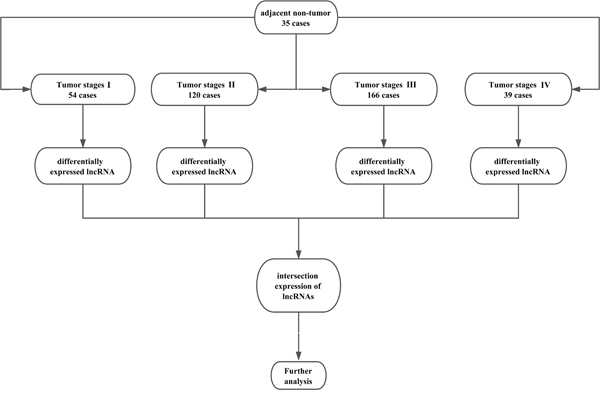
Figure 11: Flow chart of bioinformatics analysis.
Construction of the prognostic signature
The GC-specific lncRNAs were selected, and the expression level of each lncRNA was log2 transformed for further analysis. The univariate Cox proportional hazards regression model was used to analyze the GC-specific lncRNAs associated with OS. The multivariate Cox regression model was further performed to evaluate the prognostic value of these OS-related lncRNAs. The semi-supervised method that combines the gene expression profile with clinical information was used to conduct univariate Cox regression analyses [28, 29]. In each subgroup stratified by tumor TNM system, the OS-related lncRNAs were identified by the multivariate Cox regression model.
The prognostic risk score for predicting OS was calculated: Risk score = explncRNA1*βlncRNA1 + explncRNA2*βlncRNA2 + …explncRNAn*βlncRNAn (exp: expression level; β: the regression coefficient derived from the multivariate Cox regression model) [30]. The median risk score was used as the cutoff point, and GC patients were divided into high- and low- groups [31]. Further univariate and multivariate Cox proportional hazards regression analyses were conducted to investigate the effects of various clinical features and the risk score of OS for GC patients. The hazard ratio (HR) and 95% confidence interval (CI) were assessed. The defining point set up by 5-year time-dependent receiver operating characteristic (ROC) curve analysis, was used to evaluate the predictive value of the risk score for time-dependent outcomes [32]. Via IBM SPSS Statistics 21 (SPSS Inc., Chicago, IL, USA), Kaplan-Meier survival curves and the log-rank test were used to assess the equality of survival distributions in different groups. The ROC was used to assess GC-specific lncRNAs for the sensitivity and specificity of GC detection.
Integrative prediction analysis of lncRNA function
The four lncRNAs expression was heterogeneous across different grade GC. To investigate the biological feature of GC with different four lncRNAs expression, we asked the genes that strongly correlated with these four lncRNAs expression (Pearson |R| > 0.5) in TCGA database [33]. The Kyoto Encyclopedia of Genes and Genomes (KEGG) and Gene Ontology (GO) enrichment analyses of co-expressed mRNAs of these lncRNAs were performed using the Database for Annotation, Visualization, and Integrated Discovery (DAVID) (https://david.ncifcrf.gov/). The enriched results were restricted to KEGG pathway and GO biological process. The adjusted P-value < 0.05 was considered to be significant. Then, the co-expressed genes were performed to construct the protein-protein interaction (PPI) network via STRING (Version 10.5) (https://string-db.org/).
Abbreviations
lncRNAs, long non-coding RNAs; GC, gastric cancer; TCGA, The Cancer Genome Atlas; OS, Overall Survival; STDEV, standard deviation; CR, complete remission; PR, partial remission; SD, stable disease; PD, progressive disease; AUC, area under ROC curve; HR, the hazard ratio; CI, confidence interval; ROC, receiver operating characteristic; KEGG, the Kyoto Encyclopedia of Genes and Genomes; GO, Gene Ontology; DAVID, the Database for Annotation, Visualization, and Integrated Discovery; PPI, the protein-protein interaction.
Author contributions
Study conception and design: Yan Miao, Jing Sui; Data acquisition: Jing Sui; Data analysis and interpretation: Yan Miao, Jing Sui, Si-Yi Xu; Manuscript preparation: Yan Miao; Final approval of manuscript: Yan Miao, Jing Sui, Si-Yi Xu, Ge-Yu Liang, Yue-Pu Pu, Li-Hong Yin.
ACKNOWLEDGMENTS
This study was supported by the National Natural Science Foundation of China (No. 81472939, No. 81573191, and No. 81673132). We thank Donglin Cheng for his technical assistance.
CONFLICTS OF INTEREST
The authors declare no financial interests in the findings described in this study.
REFERENCES
1. Torre LA, Bray F, Siegel RL, Ferlay J, Lortet-Tieulent J, Jemal A. Global cancer statistics, 2012. CA Cancer J Clin. 2015; 65: 87-108. https://doi.org/10.3322/caac.21262.
2. Chen W, Zheng R, Baade PD, Zhang S, Zeng H, Bray F, Jemal A, Yu XQ, He J. Cancer statistics in China, 2015. CA Cancer J Clin. 2016; 66: 115-32. https://doi.org/10.3322/caac.21338.
3. Sun Z, Wang ZN, Zhu Z, Xu YY, Xu Y, Huang BJ, Zhu GL, Xu HM. Evaluation of the seventh edition of American Joint Committee on Cancer TNM staging system for gastric cancer: results from a Chinese monoinstitutional study. Ann Surg Oncol. 2012; 19: 1918-27. https://doi.org/10.1245/s10434-011-2206-1.
4. Spizzo R, Almeida MI, Colombatti A, Calin GA. Long non-coding RNAs and cancer: a new frontier of translational research? Oncogene. 2012; 31: 4577-87. https://doi.org/10.1038/onc.2011.621.
5. Fatica A, Bozzoni I. Long non-coding RNAs: new players in cell differentiation and development. Nat Rev Genet. 2014; 15: 7-21. https://doi.org/10.1038/nrg3606.
6. Kino T, Hurt DE, Ichijo T, Nader N, Chrousos GP. Noncoding RNA gas5 is a growth arrest- and starvation-associated repressor of the glucocorticoid receptor. Sci Signal. 2010; 3: ra8. https://doi.org/10.1126/scisignal.2000568.
7. Stower H. Epigenetics: X inactivation by titration. Nat Rev Genet. 2013; 14: 518. https://doi.org/10.1038/nrg3538.
8. Zhou Y, Zhong Y, Wang Y, Zhang X, Batista DL, Gejman R, Ansell PJ, Zhao J, Weng C, Klibanski A. Activation of p53 by MEG3 non-coding RNA. J Biol Chem. 2007; 282: 24731-42. https://doi.org/10.1074/jbc.M702029200.
9. Barsyte-Lovejoy D, Lau SK, Boutros PC, Khosravi F, Jurisica I, Andrulis IL, Tsao MS, Penn LZ. The c-Myc oncogene directly induces the H19 noncoding RNA by allele-specific binding to potentiate tumorigenesis. Cancer Res. 2006; 66: 5330-7. https://doi.org/10.1158/0008-5472.CAN-06-0037.
10. Li H, Yu B, Li J, Su L, Yan M, Zhu Z, Liu B. Overexpression of lncRNA H19 enhances carcinogenesis and metastasis of gastric cancer. Oncotarget. 2014; 5: 2318-29. https://doi.org/10.18632/oncotarget.1913.
11. Yoon H, Kim N. Diagnosis and management of high risk group for gastric cancer. Gut Liver. 2015; 9: 5-17. https://doi.org/10.5009/gnl14118.
12. Patru CL, Surlin V, Georgescu I, Patru E. Current issues in gastric cancer epidemiology. Rev Med Chir Soc Med Nat Iasi. 2013; 117: 199-204.
13. Gu Y, Chen T, Li G, Yu X, Lu Y, Wang H, Teng L. LncRNAs: emerging biomarkers in gastric cancer. Future Oncol. 2015; 11: 2427-41. https://doi.org/10.2217/fon.15.175.
14. Shao Y, Chen H, Jiang X, Chen S, Li P, Ye M, Li Q, Sun W, Guo J. Low expression of lncRNA-HMlincRNA717 in human gastric cancer and its clinical significances. Tumour Biol. 2014; 35: 9591-5. https://doi.org/10.1007/s13277-014-2243-z.
15. Wang Y, Liu X, Zhang H, Sun L, Zhou Y, Jin H, Zhang H, Zhang H, Liu J, Guo H, Nie Y, Wu K, Fan D, et al. Hypoxia-inducible lncRNA-AK058003 promotes gastric cancer metastasis by targeting gamma-synuclein. Neoplasia. 2014; 16: 1094-106. https://doi.org/10.1016/j.neo.2014.10.008.
16. Li L, Zhang L, Zhang Y, Zhou F. Increased expression of LncRNA BANCR is associated with clinical progression and poor prognosis in gastric cancer. Biomed Pharmacother. 2015; 72: 109-12. https://doi.org/10.1016/j.biopha.2015.04.007.
17. Xu C, Shao Y, Xia T, Yang Y, Dai J, Luo L, Zhang X, Sun W, Song H, Xiao B, Guo J. lncRNA-AC130710 targeting by miR-129-5p is upregulated in gastric cancer and associates with poor prognosis. Tumour Biol. 2014; 35: 9701-6. https://doi.org/10.1007/s13277-014-2274-5.
18. Ozcan S, Barkauskas DA, Renee Ruhaak L, Torres J, Cooke CL, An HJ, Hua S, Williams CC, Dimapasoc LM, Han Kim J, Camorlinga-Ponce M, Rocke D, Lebrilla CB, et al. Serum glycan signatures of gastric cancer. Cancer Prev Res (Phila). 2014; 7: 226-35. https://doi.org/10.1158/1940-6207.CAPR-13-0235.
19. Alexandrov LB, Nik-Zainal S, Siu HC, Leung SY, Stratton MR. A mutational signature in gastric cancer suggests therapeutic strategies. Nat Commun. 2015; 6: 8683. https://doi.org/10.1038/ncomms9683.
20. Tang T, Su R, Wang B, Zhang Y. An integrated approach of predicted miR-34a targets identifies a signature for gastric cancer. Oncol Lett. 2015; 10: 653-60. https://doi.org/10.3892/ol.2015.3266.
21. Nagarajan N, Bertrand D, Hillmer AM, Zang ZJ, Yao F, Jacques PE, Teo AS, Cutcutache I, Zhang Z, Lee WH, Sia YY, Gao S, Ariyaratne PN, et al. Whole-genome reconstruction and mutational signatures in gastric cancer. Genome Biol. 2012; 13: R115. https://doi.org/10.1186/gb-2012-13-12-r115.
22. Kang HS, Kim J, Jang SG, Kwon SY, Park YS, Green JE, Kim HK, Ro J. MicroRNA signature for HER2-positive breast and gastric cancer. Anticancer Res. 2014; 34: 3807-10.
23. Puig-Costa M, Codina-Cazador A, Cortes-Pastoret E, Oliveras-Ferraros C, Cufi S, Flaquer S, Llopis-Puigmarti F, Pujol-Amado E, Corominas-Faja B, Cuyas E, Ortiz R, Lopez-Bonet E, Queralt B, et al. Discovery and validation of an INflammatory PROtein-driven GAstric cancer Signature (INPROGAS) using antibody microarray-based oncoproteomics. Oncotarget. 2014; 5: 1942-54. https://doi.org/10.18632/oncotarget.1879.
24. Cho JY, Lim JY, Cheong JH, Park YY, Yoon SL, Kim SM, Kim SB, Kim H, Hong SW, Park YN, Noh SH, Park ES, Chu IS, et al. Gene expression signature-based prognostic risk score in gastric cancer. Clin Cancer Res. 2011; 17: 1850-7. https://doi.org/10.1158/1078-0432.CCR-10-2180.
25. Fu JW, Kong Y, Sun X. Long noncoding RNA NEAT1 is an unfavorable prognostic factor and regulates migration and invasion in gastric cancer. J Cancer Res Clin Oncol. 2016; 142: 1571-9. https://doi.org/10.1007/s00432-016-2152-1.
26. Fan ZY, Liu W, Yan C, Zhu ZL, Xu W, Li JF, Su L, Li C, Zhu ZG, Liu B, Yan M. Identification of a five-lncRNA signature for the diagnosis and prognosis of gastric cancer. Tumour Biol. 2016; 37: 13265-77. https://doi.org/10.1007/s13277-016-5185-9.
27. Ren W, Zhang J, Li W, Li Z, Hu S, Suo J, Ying X. A Tumor-Specific Prognostic Long Non-Coding RNA Signature in Gastric Cancer. Med Sci Monit. 2016; 22: 3647-57.
28. Gao X, Wu Y, Yu W, Li H. Identification of a seven-miRNA signature as prognostic biomarker for lung squamous cell carcinoma. Oncotarget. 2016; 7: 81670-9. https://doi.org/10.18632/oncotarget.13164.
29. Bair E, Tibshirani R. Semi-supervised methods to predict patient survival from gene expression data. PLoS Biol. 2004; 2: E108. https://doi.org/10.1371/journal.pbio.0020108.
30. Zeng JH, Liang L, He RQ, Tang RX, Cai XY, Chen JQ, Luo DZ, Chen G. Comprehensive investigation of a novel differentially expressed lncRNA expression profile signature to assess the survival of patients with colorectal adenocarcinoma. Oncotarget. 2017; 8: 16811-28. https://doi.org/10.18632/oncotarget.15161.
31. Zhou X, Huang Z, Xu L, Zhu M, Zhang L, Zhang H, Wang X, Li H, Zhu W, Shu Y, Liu P. A panel of 13-miRNA signature as a potential biomarker for predicting survival in pancreatic cancer. Oncotarget. 2016; 7: 69616-24. https://doi.org/10.18632/oncotarget.11903.
32. Heagerty PJ, Lumley T, Pepe MS. Time-dependent ROC curves for censored survival data and a diagnostic marker. Biometrics. 2000; 56: 337-44.
33. Wang Z, Zhang C, Liu X, Wang Z, Sun L, Li G, Liang J, Hu H, Liu Y, Zhang W, Jiang T. Molecular and clinical characterization of PD-L1 expression at transcriptional level via 976 samples of brain glioma. Oncoimmunology. 2016; 5: e1196310. https://doi.org/10.1080/2162402X.2016.1196310.