
INTRODUCTION
Cancer is one of the major causes of death for its high morbidity and mortality, and it has become one of the major threats to global health [1]. WHO reports claimed that the number of new cancer cases in 2012 was 14.1 million, and in the same year, 8.2 million patients died of cancer and 32.6 million people living with cancers [2]. Although various therapeutic methods including surgery, chemotherapy as well as targeted therapy have made significant achievements, the 5-year-survival rate still remains unsatisfactory [3]. Thus, in order to help target care appropriately, it is vital to identify reliably prognostic biomarkers, guiding individualized treatment and improving unfavorable prognosis.
TACC3, derived from the transforming acidic coiled-coil proteins (TACCs) family contains a highly conserved C-terminal coiled-coil domain. It is encoded by the TACC3 gene which is located on 4p16.3, and is able to keep the centrosomal microtubules nucleation stable and regulate the integrity of centrosomes when mitosis occurs [4–6]. In addition to its role in mitosis, TACC3 has been proved to promote tumor growth. Knockdown of TACC3 inhibited the proliferation, invasion and tumorigenesis in renal cell carcinoma (RCC) cells [7]. Moreover, in several types of tumors, FGFR3–TACC3, a common TACC3 fusion gene, has been proved to promote the growth of cancer cells by promoting cell proliferation [8, 9].
Amounting researches have indicated that overexpression of TACC3 can be found in various solid tumors, such as lung cancer [10], ovarian cancer [11], glioblastoma [12], breast cancer [13], and hepatocellular carcinoma [14]. Further, a plenty of studies have showed that TACC3 overexpression was highly correlated with low survival rate in cancer patients [15–17]. However, single study may be not accurate and sufficient. Thus, it is necessary to gather relevant literatures and systematically analyze the clinical data for obtaining a better view of the potential clinical significance of TACC3 in solid tumor. In this study, we conducted this quantitative meta-analysis to clarify the relationship between overexpression of TACC3 and prognosis of solid tumors.
RESULTS
Study characteristics
The details of the literature retrieval process were presented in Figure 1. We searched 435 articles in the databases. After screening the titles and abstracts, 406 irrelevant or duplicate articles were excluded. Then because of no usable data, 18 papers were excluded. As a result, a total of 11 studies were enrolled for the final analysis [10, 14–23]. The main features of these eligible studies were displayed in Table 1. In total, the 11 studies provided a sample of 1,943 patients, with a minimum sample size of 79 and a maximum sample size of 237 patients. Because the cut-off definitions were various, the cut-off values were different in these studies. Among 11 studies, 9 were prospective cohort researches whereas 2 were retrospective. The major resources of literatures are from China (n=9), followed by South korea (n=1) and Korea (n=1). Moreover, there was one study in each of 7 types of cancer including breast cancer, colorectal cancer, gastric cancer, esophageal squamous cell carcinoma (ESCC), cholangiocarcinoma, prostate cancer, and glioma. And there were two studies in non-small cell lung cancer (NSCLC) and hepatocellular carcinoma (HCC). In all studies, there were 10 studies on OS, and 4 studies on DFS.
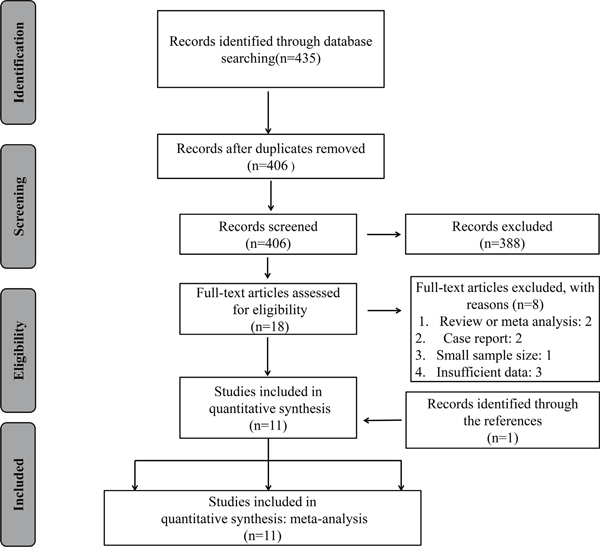
Figure 1: The flow diagram of the selection process in the meta-analysis.
Table 1: Summary of all included eligible studies
First author |
Year |
Country |
Number of patients |
Tumor type |
Stage |
Method |
Cut off |
outcome |
HR estimate |
Nos |
|---|---|---|---|---|---|---|---|---|---|---|
Song et al. |
2015 |
China |
203 |
Breast cancer |
I-IV |
IHC |
IRS≥60% |
OS |
Reported |
8 |
Zhou et al. |
2015 |
China |
237 |
Hepatocellular carcinoma |
I-IV |
IHC |
≥0.4 |
OS DFS |
Reported and Survival curve |
8 |
Yun et al. |
2015 |
China |
186 |
Gastric cancer |
I-III |
IHC |
IHC score≥50 |
OS DFS |
Reported |
7 |
Jiang et al. |
2015 |
China |
195 |
Non-small cell lung cancer |
I-IV |
IHC |
score ≥6 |
OS |
Reported |
8 |
Nahm et al. |
2015 |
South korea |
188 |
Hepatocellular carcinoma |
NM |
IHC |
- |
OS |
survival curve |
8 |
Huang et al. |
2014 |
China |
209 |
Esophageal Squamous cell carcinoma |
I-III |
IHC |
IRS≥60% |
OS |
Reported |
7 |
Jung et al. |
2005 |
Korea |
163 |
Non-small cell lung cancer |
I-III |
IHC |
- |
OS |
Reported |
9 |
Du et al. |
2015 |
China |
161 |
Colorectal cancer |
I-IV |
IHC |
IRS ≥ 5 |
OS DFS |
Reported |
8 |
He et al. |
2016 |
China |
79 |
Cholangiocarcinoma |
I-IV |
IHC |
- |
OS |
Reported |
7 |
Li et al. |
2017 |
China |
105 |
Prostate cancer |
NM |
IHC |
SI≥6 |
DFS |
Survival curve |
9 |
Sun et al. |
2017 |
China |
217 |
Glioma |
NM |
|
- |
OS |
Reported |
7 |
IHC: immunohistochemistry; IRS: immunoreactivity score; SI: staining index; NOS: Newcastle-Ottawa Scale; OS: overall survival; DFS: disease-free survival.
Evidence synthesis
Ten studies reported the overall survival (OS) of eight types of cancer based on a total of 1838 patients’ different expression levels of ATCC3. The heterogeneity of these included studies was not significant (I2=0%, P=0.443). Therefore, the fixed-effects model was adopted to estimate the pooled hazard ratios (HRs) with corresponding 95% confidence interval (CI). As showen in Figure 2, the combined HR was 1.90(95% CI=1.63–2.23, P=0.000). Our analysis suggested TACC3 overexpression had a positive correlation with the worse overall survival in cancer patients.
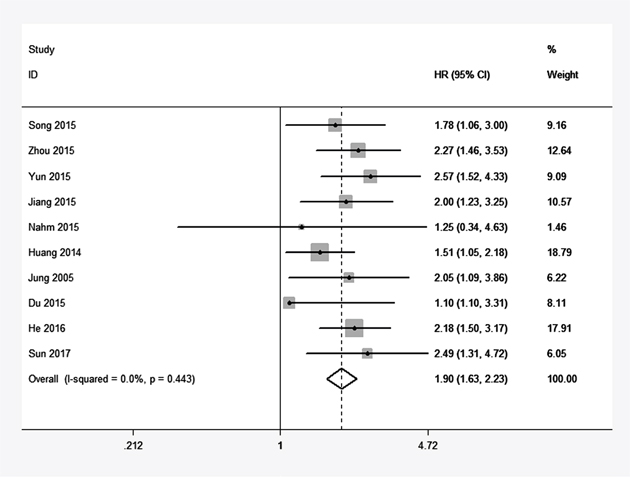
Figure 2: Forest plot of HR for the correlation between TACC3 expression and overall survival (OS) in solid tumor.
As shown in Table 3, further analyses of combined HR for OS were conducted. The pooled HRs of increased TACC3 expression on OS in patients with NSCLC, HCC and other cancers respectively were 2.02 (95% CI=1.37-2.96, P=0.000), 2.13 (95% CI=1.40-3.24, P=0.000) and 1.83 (95% CI=1.52-2.22, P=0.000). When we divided all cancer types into digestive system cancers and others, a similar result in digestive system cancers was found (HR=1.85, 95% CI=1.53-2.24, P=0.000).
Table 2: Newcastle-Ottawa quality for included studies in this meta-analysis
Study |
Selection |
Comparability |
Outcome |
Total score |
||||||
|---|---|---|---|---|---|---|---|---|---|---|
Representativeness of exposed |
Selection of nonexposed |
Ascertain-ment of exposure |
No interest of study |
Study design (cohort study) |
Control for other confounding factors |
Assessment of outcome |
Follow-up time long enough (>5 years) |
Adequacy number of follow-ups (>80%) |
||
Song et al |
1 |
1 |
1 |
0 |
1 |
1 |
1 |
1 |
1 |
8 |
Zhou et al. |
1 |
1 |
1 |
0 |
1 |
1 |
1 |
1 |
1 |
8 |
Yun et al. |
1 |
1 |
1 |
0 |
1 |
0 |
1 |
1 |
1 |
7 |
Jiang et al. |
1 |
1 |
1 |
0 |
1 |
1 |
1 |
1 |
1 |
8 |
Nahm et al. |
1 |
1 |
1 |
0 |
1 |
1 |
1 |
1 |
1 |
8 |
Huang et al. |
1 |
1 |
1 |
0 |
1 |
0 |
1 |
1 |
1 |
7 |
Jung et al. |
1 |
1 |
1 |
1 |
1 |
1 |
1 |
1 |
1 |
9 |
Du et al. |
1 |
1 |
1 |
0 |
1 |
1 |
1 |
1 |
1 |
8 |
He et al. |
1 |
1 |
1 |
0 |
1 |
1 |
1 |
0 |
1 |
7 |
Li et al |
1 |
1 |
1 |
1 |
1 |
1 |
1 |
1 |
1 |
9 |
Sun et al |
1 |
1 |
1 |
0 |
1 |
1 |
1 |
0 |
1 |
7 |
Table 3: Subgroup meta-analysis of pooled HR for OS
Categories |
No. of studies |
No. of patients |
Fixed-effects model |
Heterogeneity |
||
|---|---|---|---|---|---|---|
HR (95% CI) for OS |
P-value |
I2 (%) |
Ph |
|||
[1] OS |
10 |
1838 |
1.90 (1.63-2.23) |
0.000 |
0 |
0.443 |
[2] Cancer type |
|
|
|
|
|
|
1) Digestive system cancers |
6 |
1061 |
1.85 (1.53-2.24) |
0.000 |
37.7 |
0.155 |
Others |
4 |
778 |
2.03 (1.53-2.68) |
0.000 |
0 |
0.89 |
2) NSCLC |
2 |
358 |
2.02 (1.37-2.96) |
0.000 |
0 |
0.951 |
HCC |
2 |
425 |
2.13 (1.40-3.24) |
0.000 |
0 |
0.397 |
Others |
6 |
1055 |
1.83 (1.52-2.22) |
0.000 |
35.1 |
0.174 |
[3] Analysis type |
8 |
|
|
|
|
|
Survival curves |
1 |
188 |
1.25 (0.34-4.63) |
- |
- |
- |
Multivariate |
9 |
1650 |
1.92 (1.63-2.24) |
0.000 |
6.2 |
0.383 |
[4] Sample size |
|
|
|
|
|
|
≥ 200 |
4 |
866 |
1.86 (1.48-2.34) |
0.000 |
0 |
0.423 |
< 200 |
6 |
972 |
1.94 (1.56-2.41) |
0.000 |
17.6 |
0.300 |
In addition, for OS, we stratified subgroup meta analysis in terms of analysis type and sample size, and demonstrated similar results in regard of the effects of upregulated TACC3 expression on OS.
Increased TACC3 expression and DFS
There were just four studies which included 689 patients in total providing proper data for DFS analysis. Throughout these studies, we didn’t find serious statistical heterogeneity (I2=0%, P=0.625), meanwhile we analyze the pooled HRs with corresponding 95% CI by the fixed-effects model. The results indicated that TACC3 overexpression was positively associated the patients’ DFS in the enrolling studies (HR =2.67, 95% CI=2.10–3.40, P=0.000). Furthermore, the effects of TACC3 overexpression on DFS were consistent among different tumor types: hepatocellular carcinoma (HR=3.03, 95% CI=2.06-4.44), gastric cancer (HR=2.29, 95% CI=1.38-3.82), colorectal cancer (HR=2.05, 95% CI=1.13-3.72), and prostate cancer(HR=3.03, 95% CI=1.79-5.00) (Figure 3).
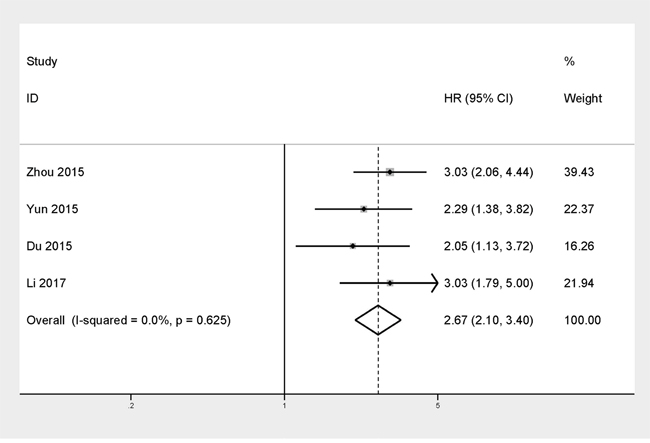
Figure 3: Forest plot of HR for the correlation between TACC3 expression and disease-free survival (DFS) in solid tumor.
TACC3 and clinical pathological factors
Another result was to explain the relationship between TACC3 expression and clinicopathological parameters (Figure 4). Five studies presented data about TACC3 expression was significantly associated with TNM stage (III-IV versus I-II OR=1.66, 95% CI=1.25-2.20, P=0.000, I2 =74.5%, Ph = 0.004), a pooled OR of 1.68 indicated a close relationship between increased TACC3 expression and lymph node metastases (N1/N2/N3 versus N0 OR =1.68, 95% CI=1.26–2.25, P=0.000, I2=55.5%, Ph=0.061). No significant heterogeneity was observed, pooled estimates of 3 literatures showed that upregulated TACC3 expression was closely related to tumor differentiation (poorly versus well/moderately OR=1.90, 95% CI=1.25–2.88, P=0.003, I2= 0, Ph=0.557).
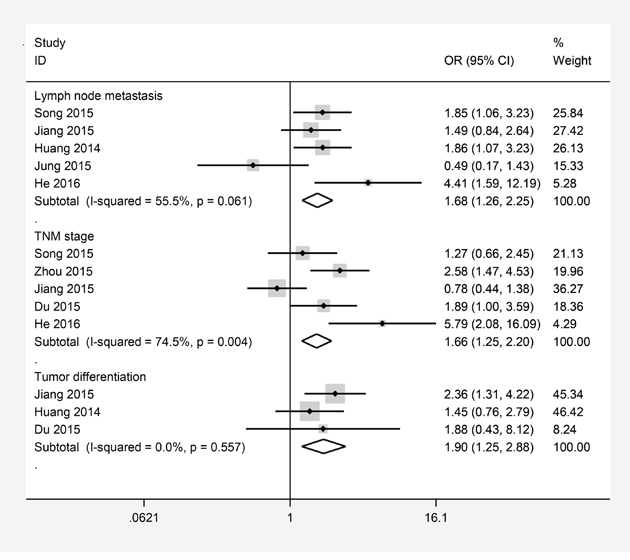
Figure 4: Forest plots of odds ratios (OR) for the association between TACC3 overexpression and clinicopathological features in cancer patients. (A) lymph node metastases; (B) TNM stage; (C) tumor differentiation.
Sensitivity analysis
For testing the strength of our study, we performed a sensitivity analysis by alternately removing each study from the pooled analysis. The result were not obviously affected, indicating that our analyses should be reliable and stable (Figure 5).
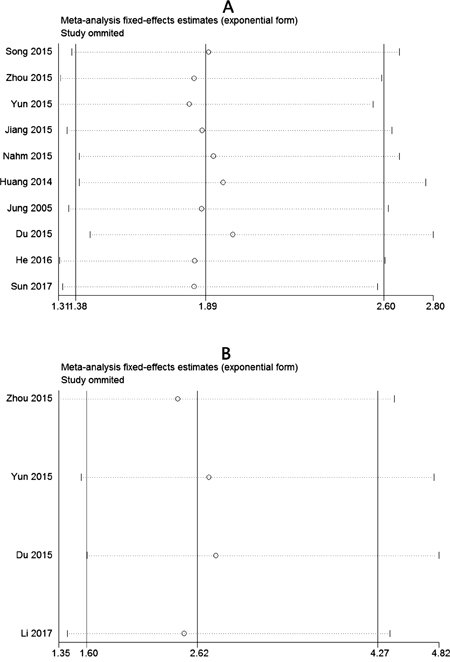
Figure 5: Sensitivity analysis of the meta-analysis. (A) Overall survival(OS). (B) Disease-free survival (DFS).
Publication bias
The publication bias of included studies was estimated by Begg’s test. In the funnel plots, it showed there was no obvious asymmetry (Figure 6). And there was no evident publication bias for all the values of P>0.05.
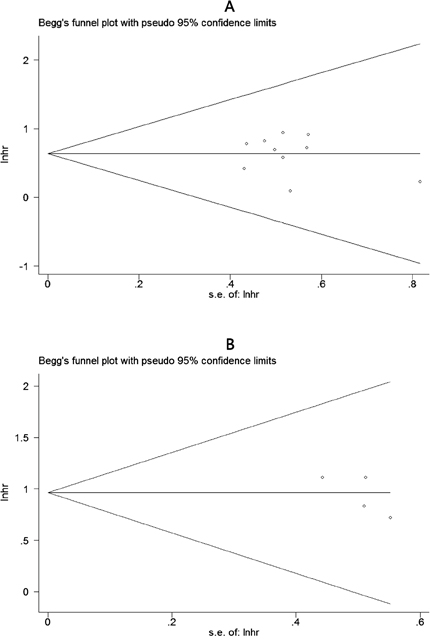
Figure 6: Begg’s funnel plots for the studies involved in the meta-analysis of TACC3 expression and the prognosis of patients with solid tumors. (A) Overall survival. (B) Disease-free survival. loghr, logarithm of hazard ratios; s.e., standard error.
DISCUSSION
Though many studies have tried to explore how TACC3 plays a role in cancer progression, its potential molecular mechanisms of cancer progression remained unclear. In a study by Ma et al. [13], through elevating mRNA levels, TACC3 may promote invasive growth by elevated mRNA levels via the transition of breast cancer from ductal carcinoma in situ to invasive ductal carcinoma. Futhermore, EMT is a critical process in the early stage of the metastasis cascade and can be initiated by various signaling pathways. Recent researches have suggested that TACC3 is able to regulate epithelial-mesenchymal transition (EMT) of cervical tumor cells [24]. Besides, Hyoung et al. found that TACC3 utilize activating PI3K/AKT and extracellular regulated kinase (ERK) signaling pathways to help promote EMT process [25]. An important recent study demonstrated that TACC3 expression was downregulated by HDACIs and that targeted TACC3 knockdown suppresses CCA cell proliferation and colony formation [22]. TACC3 was also observed to contribute to the chemosensitivity in breast carcinoma cells [26–28] and NSCLC [10]. Knockdown of TACC3 can improve the sensitivity of tumor cells to chemotherapeutic drugs by effectively regulating premature senescence [27], and this suggests that TACC3 may be a potential biomarker for monitoring the efficacy of chemotherapy.
TACC3 has been identifed as a tumor-associated gene. Via changing key cell processes, initiating oncogenic signal transduction pathways and inducing genomic instability, the up- and downregulation of TACC3 may promote the development of cancers [29]. Most studies studies have demonstrated that TACC3 expression was upregulated in many cancers [30]. However, the downregulation of TACC3 expression was detected in ovarian and thyroid cancers [31, 32]. These differences in TACC3 expression between studies may be due to its different roles in various types of cancer. The high expression of TACC3 in cancers contributes to the proliferation, metastasis and invasion of tumors and may be a biomarker for cancer prognosis. In 2005, Jung et al revealed that a high expression of TACC3 could be considered as a negative prognostic factor for NSCLC patients and a prognostic indicator of poor survival rates [20]. Meantime, the increased expression of TACC3 was associated with extracapsular invasion in gastric cancer, which might be used as an independent predictor of shorter OS [18]. Therefore, we performed a meta-analysis to assess the association between high expression of TACC3 and prognosis of patients with solid tumors.
In our current meta-analysis, 11 studies consisting of 1943 patients was included. It was the first and most comprehensive meta-analysis systematically evaluating the prognostic value of TACC3 in patients with various tumors. Our studies reveals that there was a significant relationship between TACC3 overexpression and poor prognosis in cancer patients. Firstly, for OS, the pooled HRs results showed that increased expression level of TACC3 was associated with a shorter OS in solid tumor patients. Patients with high expression level of TACC3 have a short overall survival time than those with low TACC3 expression. It suggested that TACC3 could be an potential independent prognostic factor for predicting OS of cancer patients. In the stratified analysis for OS, patients with high levels of TACC3 may act as a reliable prognostic marker in digestive system cancers, which was concordant with our conclusion. Secondly, our data indicated that higher TACC3 expression suffered from poorer DFS. Taken together, TACC3 could serve as a promising biomarker for monitoring the progression of malignancies and represent a new target for the treatment of cancers.
Thirdly, we explored the clinicopathological significance of the expression levels of increased TACC3. The pooled data showed that increased TACC3 expression was positively associated with advanced clinical stage, lymph node metastasis and tumor differentiation, which indicated that upregulated TACC3 might have a significant relationship with advanced features of cancer. However, the degree of statistical heterogeneity in TNM stage and lymph node metastasis analysis were large, which may be due to the different types of cancer and cut-off values of TACC3 in the included studies.
Admittedly, there are several limitations in this meta-analysis. Firstly, majority of cases included in the meta-analysis were from China. Secondly, we estimated the HR and 95% CIs from the Kaplan–Meier survival curves in two studies, it might be less accurate than the data acquired directly from published statistics. Thirdly, the total sample size of the study is insufficient and 11 cancers cannot represent all types of malignancies. Finally, many included studies reported positive results because negative results would have little chance to be published. Therefore, our conclusions should be interpreted with caution. Larger-size and better design studies are needed to be implemented to confirm our results.
In summary, the overexpression of TACC3 is significantly associated with poor survival in patients with various types of cancer. It may be useful to act as a potential predictive marker of tumor prognosis and a promising therapeutic target for various cancer. However, considering the limited objectives of this meta-analysis, more standardized studies are needed to assess the findings.
MATERIALS AND METHODS
Study strategy
A systematic review of primary analysis was conducted according to the Preferred Reporting Items for Systematic Reviews and Meta-Analysis guidelines [33]. Pubmed, Web of Science, Embase and Cochrane Library were searched to obtain all relevant articles. The following search terms and all of their possible combination were used: (“cancer” OR “tumor” OR “tumour” OR “neoplasm” OR “carcinoma” OR “adenocarcinoma”) AND (“transforming acidic coiled coil 3” OR “TACC3”) AND (“prognosis” OR “prognostic” OR “outcome”). The search was performed up to May 1, 2017. References in relevant articles were also reviewed manually in case of the omission of any potentially relevant literature.
Inclusion and exclusion criteria
Eligible studies included in this meta-analysis had to meet all of the following criteria: (1) Evaluating the association between TACC3 expression and prognosis of patients with any type of cancer; (2) Studies reporting survival data; (3) If the articles only provided survival curves without offering hazard ratios (HRs) and 95% confidence intervals (CIs) directly, appropriate data were extracted from the survival curves using Engauge Digitizer 4.1 software. (4) Studies published in English. (5) If there were duplicated data, we chose the most complete data or the most recent one. Exclusion criteria were as follow: duplicated studies; non-English papers; reviews articles; case reports; lack of original data; and non-human researches.
Data extraction and quality assessment
Two reviewers (JEW and SLD) independently extracted information of all identified records according to pre-specified inclusion and exclusion criteria. The following data were extracted for each study: The first author’s name, publication year, country, number of patients, types of cancer, disease stage, detection method, cut off, outcome, HR estimate, score for TACC3 assessment. Data for OS and DFS were extracted from tables or Kaplan–Meier curves with respect to TACC3 expression [34, 35]. Any potential disagreements between the authors were resolved by discussions with a third reviewer(MXY). The Newcastle-Ottawa Scale (NOS) was applied to assess the methodological quality of all included studies [36]. According to the NOS criteria, all of the included studies got 7 scores or more are considered high quality articles (Table 2).
Statistical analysis
Using the data collected from each eligible study, we performed the meta-analysis to evaluate the relationship between solid tumor’s TACC3 expression and patients’ prognosis. Pooled HRs and 95% CIs for two outcome endpoints (OS, DFS) were calculated via a fixed effects model or random effects model. The heterogeneity between studies was assessed with the Chisquare-based Q test and I2 statistics, and the I2 value indicated the degree of heterogeneity. A P-value ≤0.1 or I2≥50% indicated significant heterogeneity, in which case a random-effects model was used; if not, a fixed-effects model was used. Publication bias was estimated by Begg’s test, P<0.05 was considered statistically significant. We performed sensitivity analysis by omitting each study or specific studies to access the stability of the meta analysis results. Statistical analyses were conducted using Stata12.0 (Stata Corporation, College Station, TX, USA). All the P-values were determined by two-sided tests.
ACKNOWLEDGMENTS
This study was supported by National Natural Science Funds (No. 81472033 and No. 30901308), the National Science Foundation of Hubei Province (No. 2013CFB233 and No. 2013CFB235), the Scientific and technological project of Wuhan City (No. 2014060101010045), Hubei Province health and family planning scientific research project (WJ2015Q021) and Training Program of the science and technology innovation from Zhongnan Hospital of Wuhan University (cxpy20160054).
CONFLICTS OF INTEREST
The authors declare no conflicts of interest.
REFERENCES
1. Wu S, Powers S, Zhu W, Hannun YA. Substantial contribution of extrinsic risk factors to cancer development. Nature. 2016; 529:43-47.
2. Devassy JG, Nwachukwu ID, Jones PJ. Curcumin and cancer: barriers to obtaining a health claim. Nutr Rev. 2015; 73:155-165.
3. Gonzalez CA, Agudo A. Carcinogenesis, prevention and early detection of gastric cancer: where we are and where we should go. Int J Cancer. 2012; 130:745-753.
4. Bargo S, Raafat A, McCurdy D, Amirjazil I, Shu Y, Traicoff J, Plant J, Vonderhaar BK, Callahan R. Transforming acidic coiled-coil protein-3 (Tacc3) acts as a negative regulator of Notch signaling through binding to CDC10/Ankyrin repeats. Biochem Biophys Res Commun. 2010; 400:606-612.
5. McKeveney PJ, Hodges VM, Mullan RN, Maxwell P, Simpson D, Thompson A, Winter PC, Lappin TR, Maxwell AP. Characterization and localization of expression of an erythropoietin-induced gene, ERIC-1/TACC3, identified in erythroid precursor cells. Br J Haematol. 2001; 112:1016-1024.
6. LeRoy PJ, Hunter JJ, Hoar KM, Burke KE, Shinde V, Ruan J, Bowman D, Galvin K, Ecsedy JA. Localization of human TACC3 to mitotic spindles is mediated by phosphorylation on Ser558 by Aurora A: a novel pharmacodynamic method for measuring Aurora A activity. Cancer Res. 2007; 67:5362-5370.
7. Guo F, Liu Y. Knockdown of TACC3 inhibits the proliferation and invasion of human renal cell carcinoma cells. Oncol Res. 2017.
8. Mizukami T, Sakai K, Naruki S, Taniyama T, Horie Y, Izawa N, Tsuda T, Fujino T, Boku N, Yasuda H, Fukunaga T, Nakajima TE, Nishio K. Identification of a FGFR3-TACC3 fusion in esophageal cancer. Ann Oncol. 2016; 28:437-438.
9. Carneiro BA, Elvin JA, Kamath SD, Ali SM, Paintal AS, Restrepo A, Berry E, Giles FJ, Johnson ML. FGFR3-TACC3: a novel gene fusion in cervical cancer. Gynecol Oncol Rep. 2015; 13:53-56.
10. Jiang F, Kuang B, Que Y, Lin Z, Yuan L, Xiao W, Peng R, Zhang X, Zhang X. The clinical significance of transforming acidic coiled-coil protein 3 expression in non-small cell lung cancer. Oncol Rep. 2016; 35:436-446.
11. L'Esperance S, Popa I, Bachvarova M, Plante M, Patten N, Wu L, Tetu B, Bachvarov D. Gene expression profiling of paired ovarian tumors obtained prior to and following adjuvant chemotherapy: molecular signatures of chemoresistant tumors. Int J Oncol. 2006; 29:5-24.
12. Duncan CG, Killela PJ, Payne CA, Lampson B, Chen WC, Liu J, Solomon D, Waldman T, Towers AJ, Gregory SG, McDonald KL, McLendon RE, Bigner DD, Yan H. Integrated genomic analyses identify ERRFI1 and TACC3 as glioblastoma-targeted genes. Oncotarget. 2010; 1:265-277. https://doi.org/10.18632/oncotarget.137.
13. Ma XJ, Salunga R, Tuggle JT, Gaudet J, Enright E, McQuary P, Payette T, Pistone M, Stecker K, Zhang BM, Zhou YX, Varnholt H, Smith B, et al. Gene expression profiles of human breast cancer progression. Proc Natl Acad Sci U S A. 2003; 100:5974-5979.
14. Zhou DS, Wang HB, Zhou ZG, Zhang YJ, Zhong Q, Xu L, Huang YH, Yeung SC, Chen MS, Zeng MS. TACC3 promotes stemness and is a potential therapeutic target in hepatocellular carcinoma. Oncotarget. 2015; 6:24163-24177. https://doi.org/10.18632/oncotarget.4643.
15. Li Q, Ye L, Guo W, Wang M, Huang S, Peng X. Overexpression of TACC3 is correlated with tumor aggressiveness and poor prognosis in prostate cancer. Biochem Biophys Res Commun. 2017; 486:872-878.
16. Song H, Liu C, Shen N, Yi P, Dong F, Li X, Zhang N, Huang T. Overexpression of TACC3 in breast cancer associates with poor prognosis. Appl Immunohistochem Mol Morphol. 2016.
17. Nahm JH, Kim H, Lee H, Cho JY, Choi YR, Yoon YS, Han HS, Park YN. Transforming acidic coiled-coil-containing protein 3 (TACC3) overexpression in hepatocellular carcinomas is associated with “stemness” and epithelial-mesenchymal transition-related marker expression and a poor prognosis. Tumour Biol. 2016; 37:393-403.
18. Yun M, Rong J, Lin ZR, He YL, Zhang JX, Peng ZW, Tang LQ, Zeng MS, Zhong Q, Ye S. High expression of transforming acidic coiled coil-containing protein 3 strongly correlates with aggressive characteristics and poor prognosis of gastric cancer. Oncol Rep. 2015; 34:1397-1405.
19. Huang ZL, Lin ZR, Xiao YR, Cao X, Zhu LC, Zeng MS, Zhong Q, Wen ZS. High expression of TACC3 in esophageal squamous cell carcinoma correlates with poor prognosis. Oncotarget. 2015; 6:6850-6861. https://doi.org/10.18632/oncotarget.3190.
20. Jung CK, Jung JH, Park GS, Lee A, Kang CS, Lee KY. Expression of transforming acidic coiled-coil containing protein 3 is a novel independent prognostic marker in non-small cell lung cancer. Pathol Int. 2006; 56:503-509.
21. Du Y, Liu L, Wang C, Kuang B, Yan S, Zhou A, Wen C, Chen J, Wu Y, Yang X, Feng G, Liu B, Iwamoto A, et al. TACC3 promotes colorectal cancer tumourigenesis and correlates with poor prognosis. Oncotarget. 2016; 7:41885-41897. https://doi.org/10.18632/oncotarget.9628.
22. He JC, Yao W, Wang JM, Schemmer P, Yang Y, Liu Y, Qian YW, Qi WP, Zhang J, Shen Q, Yang T. TACC3 overexpression in cholangiocarcinoma correlates with poor prognosis and is a potential anti-cancer molecular drug target for HDAC inhibitors. Oncotarget. 2016; 7:75441-75456. https://doi.org/10.18632/oncotarget.12254.
23. Sun Y, Tian Y, Wang GZ, Zhao SH, Han B, Li YL, Jiang CL. Overexpression of transforming acidic coiled coil containing protein 3 reflects malignant characteristics and poor prognosis of glioma. Int J Mol Sci. 2017; 18.
24. Ha GH, Kim JL, Breuer EK. TACC3 is essential for EGF-mediated EMT in cervical cancer. PLoS One. 2013; 8:e70353.
25. Ha GH, Park JS, Breuer EK. TACC3 promotes epithelial-mesenchymal transition (EMT) through the activation of PI3K/Akt and ERK signaling pathways. Cancer Lett. 2013; 332:63-73.
26. Schneider L, Essmann F, Kletke A, Rio P, Hanenberg H, Schulze-Osthoff K, Nurnberg B, Piekorz RP. TACC3 depletion sensitizes to paclitaxel-induced cell death and overrides p21WAF-mediated cell cycle arrest. Oncogene. 2008; 27:116-125.
27. Schmidt S, Schneider L, Essmann F, Cirstea IC, Kuck F, Kletke A, Janicke RU, Wiek C, Hanenberg H, Ahmadian MR, Schulze-Osthoff K, Nurnberg B, Piekorz RP. The centrosomal protein TACC3 controls paclitaxel sensitivity by modulating a premature senescence program. Oncogene. 2010; 29:6184-6192.
28. Yim EK, Tong SY, Ho EM, Bae JH, Um SJ, Park JS. Anticancer effects on TACC3 by treatment of paclitaxel in HPV-18 positive cervical carcinoma cells. Oncol Rep. 2009; 21:549-557.
29. Ha GH, Kim JL, Breuer EK. Transforming acidic coiled-coil proteins (TACCs) in human cancer. Cancer Lett. 2013; 336:24-33.
30. Still IH, Vince P, Cowell JK. The third member of the transforming acidic coiled coil-containing gene family, TACC3, maps in 4p16, close to translocation breakpoints in multiple myeloma, and is upregulated in various cancer cell lines. Genomics. 1999; 58:165-170.
31. Ulisse S, Baldini E, Toller M, Delcros JG, Gueho A, Curcio F, De Antoni E, Giacomelli L, Ambesi-Impiombato FS, Bocchini S, D'Armiento M, Arlot-Bonnemains Y. Transforming acidic coiled-coil 3 and Aurora-A interact in human thyrocytes and their expression is deregulated in thyroid cancer tissues. Endocr Relat Cancer. 2007; 14:827-837.
32. Lauffart B, Vaughan MM, Eddy R, Chervinsky D, DiCioccio RA, Black JD, Still IH. Aberrations of TACC1 and TACC3 are associated with ovarian cancer. BMC Womens Health. 2005; 5:8.
33. Liberati A, Altman DG, Tetzlaff J, Mulrow C, Gotzsche PC, Ioannidis JP, Clarke M, Devereaux PJ, Kleijnen J, Moher D. The PRISMA statement for reporting systematic reviews and meta-analyses of studies that evaluate health care interventions: explanation and elaboration. J Clin Epidemiol. 2009; 62:e1-34.
34. Williamson PR, Smith CT, Hutton JL, Marson AG. Aggregate data meta-analysis with time-to-event outcomes. Stat Med. 2002; 21:3337-3351.
35. Tierney JF, Stewart LA, Ghersi D, Burdett S, Sydes MR. Practical methods for incorporating summary time-to-event data into meta-analysis. Trials. 2007; 8:16.
36. Zeng X, Zhang Y, Kwong JS, Zhang C, Li S, Sun F, Niu Y, Du L. The methodological quality assessment tools for preclinical and clinical studies, systematic review and meta-analysis, and clinical practice guideline: a systematic review. J Evid Based Med. 2015; 8:2-10.