
INTRODUCTION
Diffuse large B-cell lymphoma (DLBCL), accounting for about one-third of all non-Hodgkin’s lymphoma (NHL), is the most common type of NHL [1]. The international prognostic index (IPI) had been a powerful prognostic tool for more than 20 years for stratifying patient risks [2]. The immuno-chemotherapy combining rituximab and cyclophosphamide, doxorubicin, vincristine, and prednisone (R-CHOP) has resulted in a significant improvement of survival [1]. However, a section of patients was not cured with R-CHOP, either due to primary refractory disease or late relapse following an initial response. Efforts have been made to improve the risk stratification model, including regrouping the IPI score (revised IPI) [3], initial hematological index [4], type of bone marrow involvement [5] and tumor bulk [6]. Nonetheless, these efforts have only resulted in an incremental improvement. New prognostic biomarkers for the rituximab era are needed.
Over the past decade, 18F-fluorodeoxyglucose (FDG) positron emission tomography, combined with computed tomography (PET/CT) has been widely used for the management of DLBCL [7-11]. The standardized uptake value (SUV) is the most commonly used semi-quantitative parameter in FDG PET/CT. Higher maximal SUV in the lesion has been proved to be of prognostic significance in patients with DLBCL [12, 13]. Beyond SUV, with the development of software programs, metabolic tumor volume (MTV) and total lesion glycolysis (TLG) have recently been found to play an important role in the prediction of patient outcomes. However, some recent studies evaluating the prognostic values of total MTV and TLG in DLBCL showed inconclusive and contradictory results [14-20].
Therefore, the aim of the current study was to determine the prognostic value of total MTV and TLG measured on pre-treatment FDG PET/CT, and to compare MTV and TLG with other clinical prognostic factors, in patients with newly diagnosed DLBCL receiving R-CHOP therapy.
RESULTS
Patient characteristics
A total of 118 patients, who met the inclusion criteria, were analyzed (Table 1). There were 63 (53.4%) men and 55 (46.6%) women, with mean age 61.8 ± 16.9 years at diagnosis. Forty-eight (40.7%) patients were at early stages (stage I or II), while the other 70 patients (59.3%) were at stages III or IV. According to IPI score, patients with low risk (0-1), low-intermediate risk (2), high-intermediate risk (3) and high risk (4-5) were 39, 36, 21 and 22 respectively. As for the revised IPI score, patients in “very good” prognostic group (score 0), “good” prognostic group (score 1-2) and “poor” prognostic group (score 3-5) were 11, 64 and 43 respectively. Seventy-one (60.2%) patients presented extranodal involvement and 20 (16.9%) patients presented with pathologically confirmed BM involvement at diagnosis.
Table 1: Baseline characteristics at diagnosis of the 118 patients with diffuse large B-cell lymphoma
Variable |
Value (%) |
|---|---|
Age (y) |
|
Mean ± SD |
61.8 ± 16.9 |
Range |
15-94 |
Sex |
|
Male |
63 (53.4) |
Female |
55 (46.6) |
Ann Arbor stage |
|
I |
16 (13.6) |
II |
32 (27.1) |
III |
29 (24.6) |
IV |
41 (34.7) |
IPI |
|
Low risk (score 0-1) |
39 (33.1) |
Low-intermediate (score 2) |
36 (30.5) |
High-intermediate (score 3) |
21 (17.8) |
High (score 4-5) |
22 (18.6) |
Revised IPI |
|
Very good (score 0) |
11 (9.3) |
Good (score 1-2) |
64 (54.2) |
Poor (score 3-5) |
43 (36.4) |
Primary lesions |
|
Lymph nodes |
47 (39.8) |
Extranodal lesions |
71 (60.2) |
Bone marrow involvement |
|
Yes |
20 (16.9) |
No |
98 (83.1) |
IPI: international prognostic index.
Baseline laboratory data including hemoglobin (Hb), white blood cell count (WBC), platelet count, albumin, creatinine, glutamate oxaloacetate transaminase (GOT), glutamate pyruvate transaminase (GPT), lactate dehydrogenase (LDH) and β2-microglobulin were collected. The imaging parameters acquired via FDG PET/CT scans were also measured (Table 2). The mean value of maximal SUV of tumor (SUVt) was 15.8 ± 8.2. The mean values of total MTV and TLG were 550.4 ± 678.3 cm3 and 3533.2 ± 4394.1 cm3 respectively.
Table 2: Baseline laboratory and imaging parameters of the 118 patients with diffuse large B-cell lymphoma
Variable |
Mean (SD) |
|---|---|
Hb (g/dL) |
11.7 (1.9) |
WBC (x 103 μL) |
6.9 (3.0) |
Platelet (x 103 /μL) |
231.4 (103.2) |
Albumin (g/dL) |
3.6 (0.6) |
Creatinine (mg/dL) |
0.9 (0.7) |
GOT (IU/L) |
33.7 (24.0) |
GPT (IU/L) |
26.0 (17.2) |
LDH (IU/L) |
360.0 (503.0) |
β2-microglobulin (μg/dL) |
317.9 (287.2) |
Maximal SUVt |
15.8 (8.2) |
MTV (cm3) |
550.4 (678.3) |
TLG (cm3) |
3533.2 (4394.1) |
SD: standard deviation; Hb: hemoglobin; WBC: white blood cell; GOT: glutamate oxaloacetate transaminase; GPT: glutamate pyruvate transaminase; LDH: lactate dehydrogenase; SUVt: standardized uptake value of tumor; MTV: metabolic tumor volume; TLG: total lesion glycolysis.
Correlation between MTV, TLG and clinical prognostic parameters
Correlations between metabolic parameters from FDG PET/CT scans and clinical prognostic parameters are listed in Table 3. Using Spearman’s correlation test, total MTV was positively and significantly correlated with LDH level, creatinine level, GOT level, β2-microglobulin level, clinical stage, IPI score, revised IPI, bone marrow status, maximal SUVt and TLG. Inverse and significant correlations were seen between total MTV toward Hb and albumin level. On the other hand, TLG was positively and significantly correlated with LDH, GOT level, β2-microglobulin level, clinical stage, IPI score, revised IPI and maximal SUVt. Inverse and significant correlations were also seen between TLG toward Hb and albumin level.
Table 3: Correlations between metabolic parameters from FDG PET/CT scans and clinical prognostic parameters
Total MTV |
TLG |
|||
|---|---|---|---|---|
r |
p |
r |
p |
|
Hb |
-0.275 |
0.0026* |
-0.237 |
0.0097* |
WBC |
0.087 |
0.3482 |
0.089 |
0.3401 |
Platelet |
0.065 |
0.4836 |
0.089 |
0.3368 |
Albumin |
-0.488 |
<0.0001* |
-0.453 |
<0.0001* |
LDH |
0.624 |
<0.0001* |
0.577 |
<0.0001* |
Creatinine |
0.182 |
0.0484* |
0.152 |
0.1003 |
GOT |
0.369 |
<0.0001* |
0.330 |
0.0003* |
GPT |
0.040 |
0.6691 |
0.025 |
0.7897 |
β2-microglobilin |
0.491 |
<0.0001* |
0.424 |
<0.0001* |
Clinical Stage |
0.467 |
<0.0001* |
0.435 |
<0.0001* |
IPI score |
0.551 |
<0.0001* |
0.475 |
<0.0001* |
Revised IPI |
0.557 |
<0.0001* |
0.491 |
<0.0001* |
Maximal SUVt |
0.368 |
<0.0001* |
0.533 |
<0.0001* |
Total MTV |
- |
- |
0.969 |
<0.0001* |
TLG |
0.969 |
<0.0001* |
- |
- |
* statistically significant
MTV: metabolic tumor volume; TLG: total lesion glycolysis; r: correlation coefficients; Hb: hemoglolin; WBC: white blood cell; LDH: lactate dehydrogenase; GOT: glutamate oxaloacetate transaminase; GPT: glutamate pyruvate transaminase; SUVt: standardized uptake value of tumor; IPI: international prognostic index.
Comparison between metabolic parameters measured in patients with different clinical outcomes
During the follow-up, patients who had progressive disease or had died, were grouped as progression (n = 55), as compared to patients in complete or partial remission (n = 63). After a median follow-up period of 28.7 months, 69 (58.5%) patients were alive and 49 (41.5%) patients had expired at the end of the study. The comparisons among maximal SUVt, total MTV and TLG in patients with different clinical outcomes was shown in Table 4. There were no significant differences in maximal SUVt between patients with progression and remission, and between patients who had expired and those who were alive. However, patients who underwent progression of disease had much higher total MTV and TLG, than patients with partial or complete remission (MTV, p = 0.0005; TLG, p = 0.0021). Patients who had expired had significantly higher total MTV and TLG, than patient who survived at the end of study (MTV, p < 0.0001; TLG, p = 0.0004).
Table 4: Comparisons between mean values of metabolic parameters measured in patients with different clinical outcomes
Progression |
Remission |
p |
Expired |
Alive |
p |
||
|---|---|---|---|---|---|---|---|
Maximal SUVt |
Mean |
16.6 |
15.1 |
0.3288 |
16.0 |
15.7 |
0.7806 |
SD |
8.0 |
8.2 |
7.7 |
8.5 |
|||
Total MTV |
Mean |
745.1 |
380.5 |
0.0005* |
828.1 |
353.2 |
<0.0001* |
SD |
785.0 |
518.4 |
795.4 |
500.2 |
|||
TLG |
Mean |
4655.4 |
2553.6 |
0.0021* |
5003.4 |
2489.2 |
0.0004* |
SD |
5033.3 |
3504.1 |
4913.6 |
3676.4 |
|||
* statistically significant
SUVt: standardized uptake value of tumor; MTV: metabolic tumor volume; TLG: total lesion glycolysis; SD: standard deviation.
Identification of the most discriminative cut-off values
The receiver-operating characteristics (ROC) curve analysis was used to identify the ideal cut-off values in distinguishing high levels of MTV and TLG from low levels of MTV and TLG (Figure 1). For progression-free survival (PFS), the estimated areas under the ROC curve (AUCs) of MTV and TLG were 0.687 (p = 0.0001) and 0.665 (p = 0.001) respectively (Figure 1A). 165.4 cm3 was the best distinguishable cut-off value for dividing high and low MTV status, with 76.5% sensitivity and 58.7% specificity (Youden index 0.35). 1204.9 cm3 was the best determinative cut-off value for dividing high and low TLG status, with 70.9% sensitivity and 60.3% specificity (Youden index 0.31).
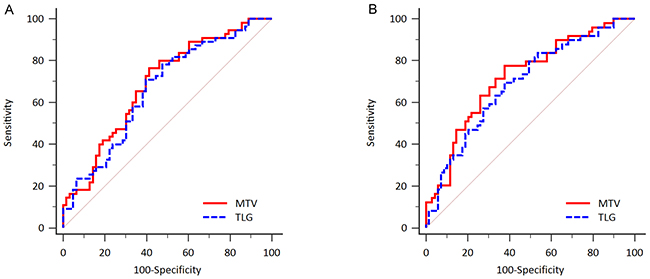
Figure 1: ROC curve analysis to determine the most discriminative cut-off value of total MTV and TLG. (A) For prediction of PFS, AUCs were 0.687 for MTV (p = 0.0001) and 0.665 for TLG (p = 0.001). (B) For prediction of OS, AUCs were 0.723 for MTV (p < 0.0001) and 0.691 for TLG (p = 0.0001) respectively.
For overall survival (OS), the estimated AUCs of MTV and TLG were 0.723 (p < 0.0001) and 0.691 (p = 0.0001) respectively (Figure 1B). 190.2 cm3 was the best distinguishable cut-off value for dividing high and low MTV status, with 77.6% sensitivity and 62.3% specificity (Youden index 0.40). 1480.8 cm3 was the best determinative cut-off value for dividing high and low TLG status, with 69.4% sensitivity and 62.3% specificity (Youden index 0.32).
Clinical outcomes according to cut-off values of MTV and TLG
In Kaplan-Meier survival analysis, patients with high MTV had poorer clinical survival, compared to patients with low MTV levels (PFS, cut-off value 165.4 cm3, p = 0.0001; OS, cut-off value 190.2 cm3, p < 0.0001; Figure 2A and 2B). The 5-year PFS for patients with high MTV (n = 68) and low MTV (n = 50) were 32.3% and 66.0% respectively. The 5-year OS for patients with high MTV (n = 64) and low MTV (n = 54) were 34.3% and 69.9% respectively. The median OS time for the patients with higher MTV (≥ 190.2 cm3, n = 64) was 17.0 months [95% CI: 10.0 – 48.0].
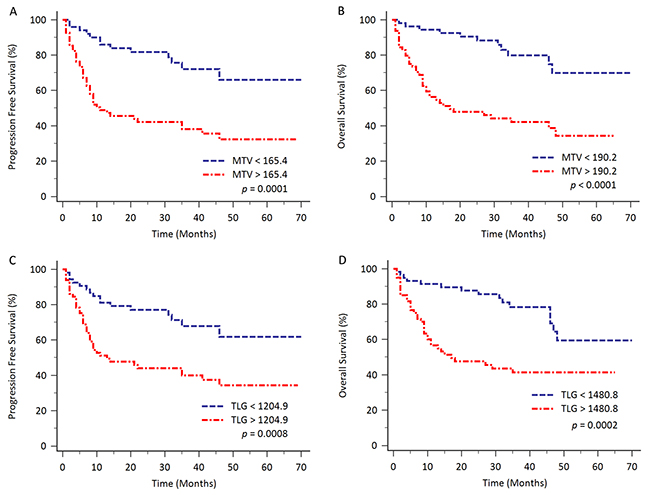
Figure 2: Kaplan-Meier analysis for evaluating the PFS and OS based on total MTV and TLG with different cut-off values. Patients with higher total MTV had significantly shorter survival, compared to patients with lower total MTV (PFS, p = 0.0001; OS, p < 0.0001; Figure 2A and 2B). Patients with higher TLG also had significantly poorer outcome compared to patients with lower TLG (PFS, p = 0.0008; OS, p = 0.0002; Figure 2C and 2D).
Similarly, patients with high TLG had inferior clinical survival, compared to patients with low TLG levels (PFS, cut-off value 1204.9 cm3, p = 0.0008; OS, cut-off value 1480.8 cm3, p = 0.0002; Figure 2C and 2D). The 5-year PFS for patients with high TLG (n = 65) and low TLG (n = 53) were 34.3% and 61.8% respectively. The 5-year OS for patients with high TLG (n = 60) and low TLG (n = 58) were 41.3% and 59.5% respectively. The median OS time for the patients with higher TLG (≥ 1480.8 cm3, n = 60) was also 17.0 months (95% CI: 10.0 – 35.0).
Clinical outcomes in patients with different subgroups
Patients were divided into early-staged (staged I and II, n = 48) and late-staged (staged III and IV, n = 70) groups. In the early-staged group, patients with higher total MTV had poorer clinical outcomes (PFS, cut-off value 77.7 cm3, log-rank p = 0.0033; OS, cut-off value 77.7 cm3, log-rank p = 0.0193). Higher TLG also correlated with poorer clinical outcomes (PFS, cut-off value 475.6 cm3, log-rank p = 0.0095; OS, cut-off value 587.0 cm3, log-rank p = 0.0419).
In the late-staged group, patients with higher total MTV or TLG had poorer clinical PFS and OS. However, a significant difference of survival was only shown in the evaluation of OS using dichotomized total MTV (cut-off value 190.2 cm3, log-rank p = 0.0153).
Comparison of clinical impacts of other prognostic parameters in all 118 patients
The Cox proportional hazard model was used to analyze the impact of MTV, TLG as well as clinical parameters on the clinical outcomes. The cut-off values of the laboratory data were dichotomized using normal reference, if available in the literature. The cut-off values of maximal SUVt, MTV and TLG were determined by the ROC curve analysis, as described in previous paragraph. For the evaluation of PFS, the univariate analysis revealed that lower platelet counts (< 172 × 103/μL, p = 0.0084), lower albumin level (< 3.5 g/dL, p = 0.0236), higher LDH level (≥ 192 IU/L, p = 0.0006), higher total MTV (≥ 165.4 cm3, p < 0.0001), higher TLG (≥ 1204.9 cm3, p = 0.0009), bone marrow involvement (p = 0.0451), higher clinical stage (p = 0.0007), higher IPI score (p = 0.0001) and higher revised IPI score (p < 0.0001) were significantly associated with poorer clinical outcomes (Table 5). Further, multivariate analysis was conducted and revealed higher MTV [hazard ratio (HR): 2.31, 95% confidence interval (CI): 1.16 – 4.60, p = 0.0180], and high IPI score (high risk group, HR: 3.20, 95% CI: 1.42 – 7.18, p = 0.0050) had independent clinical impacts on PFS.
Table 5: Cox proportional hazards models analysis of potential prognostic factors affecting PFS
Univariate analysis |
Multivariate analysis |
|||
|---|---|---|---|---|
HR (95% CI) |
p |
HR (95% CI) |
p |
|
Sex (male vs. female) |
1.22 (0.72-2.10) |
0.4509 |
||
Age (≥ vs.< 65 years) |
1.44 (0.85-2.46) |
0.1735 |
||
Hemoglobin (< vs. ≥ 12.3 g/dL) |
1.75 (0.98-3.10) |
0.0501 |
||
WBC (< vs. ≥ 4400 /μL) |
1.31 (0.66-2.60) |
0.4559 |
||
Platelet (< vs. ≥ 172 × 103/μL) |
2.12 (1.24-3.65) |
0.0084* |
||
Albumin (< vs. ≥ 3.5 g/dL) |
1.87 (1.10-3.18) |
0.0236* |
||
LDH (≥ vs. < 192 IU/L) |
2.65 (1.48-4.77) |
0.0006* |
||
Creatinine (≥ vs. < 1.3 mg/dL) |
1.84 (0.93-3.65) |
0.1037 |
||
GOT (≥ vs.< 42 IU/L) |
1.75 (0.98-3.14) |
0.0703 |
||
GPT(≥ vs.< 40 IU/L) |
1.52 (0.80-2.89) |
0.2210 |
||
β2-microglobulin (≥ vs. < 340 μg/dL) |
1.66 (0.92-2.99) |
0.1042 |
||
Maximal SUVt (≥ vs. < 18.8) |
1.32 (0.77-2.24) |
0.3154 |
||
MTV (≥ vs. < 165.4 cm3) |
3.32 (1.78-6.20) |
<0.0001* |
2.31 (1.16-4.60) |
0.0180* |
TLG (≥ vs. < 1204.9 cm3) |
2.57 (1.43-4.61) |
0.0009* |
||
BM invovlement (yes vs. no) |
1.94 (1.05-3.57) |
0.0451* |
||
Stage |
||||
I |
1 |
0.0007* |
||
II |
1.60 (0.43-5.93) |
0.4785 |
||
III |
4.15 (1.21-14.28) |
0.0238* |
||
IV |
4.99 (1.51-16.48) |
0.0083* |
||
IPI |
||||
Low (0-1) |
1 |
0.0001* |
0.0070* |
|
Low-intermediate (2) |
1.26 (0.57-2.75) |
0.5697 |
0.98 (0.44-2.19) |
0.9530 |
High-intermediate (3) |
2.86 (1.30-6.31) |
0.0087* |
1.85 (0.79-4.30) |
0.1550 |
High (4-5) |
5.06 (2.40-10.68) |
<0.0001* |
3.20 (1.42-7.18) |
0.0050* |
Revised IPI |
||||
1 |
1 |
<0.0001* |
||
2 |
1.43 (0.43-4.77) |
0.5641 |
||
3 |
4.60 (1.40-15.18) |
0.0121* |
||
* statistically significant
HR: hazard ratio; CI: confidence interval; WBC: white blood cell; LDH: lactate dehydrogenase; GOT: glutamate oxaloacetate transaminase; GPT: glutamate pyruvate transaminase; SUVt: standardized uptake value of tumor; MTV: metabolic tumor volume; TLG: total lesion glycolysis; BM: bone marrow; IPI: international prognostic index
For the evaluation of OS, the univariate analysis disclosed that older age (≥ 65 years, p = 0.0032), lower Hb level (< 12.3 g/dL, p = 0.0010), lower platelet count (< 172 × 103/μL, p = 0.0126), lower albumin level (< 3.5 g/dL, p = 0.0012), higher LDH level (≥ 192 IU/L, p = 0.0001), higher creatinine level (≥ 1.3 mg/dL, p = 0.0499), higher GOT level (≥ 42 IU/L, p = 0.0114), higher β2-microglobulin level (≥ 340 μg/dL, p = 0.0097), higher total MTV (≥ 190.2 cm3, p < 0.0001), higher TLG (≥ 1480.8 cm3, p = 0.0003), higher clinical stage (p = 0.0007), higher IPI score (p < 0.0001) and higher revised IPI score (p < 0.0001) were significantly associated with poorer clinical outcomes (Table 6). Further, multivariate analysis disclosed that older age (HR: 1.89, 95% CI: 1.03 – 3.48, p = 0.0410), higher total MTV (HR: 2.38, 95% CI: 1.12 – 5.04, p = 0.024) and higher IPI score (high-intermediate risk group, HR: 3.61, 95% CI: 1.18 – 11.02, p = 0.0240; high risk group, HR: 6.64, 95% CI: 2.17 – 20.32, p = 0.0010) had independent clinical impacts on OS.
Table 6: Cox proportional hazards models analysis of potential prognostic factors affecting OS
Univariate analysis |
Multivariate analysis |
|||
|---|---|---|---|---|
HR (95% CI) |
p |
HR (95% CI) |
p |
|
Sex (male vs. female) |
1.03 (0.59-1.82) |
0.9058 |
||
Age (≥ vs.< 65 years) |
2.35 (1.32-4.19) |
0.0032* |
1.89 (1.03-3.48) |
0.0410* |
Hemoglobin (< vs. ≥ 12.3 g/dL) |
2.83 (1.44-5.55) |
0.0010* |
||
WBC (< vs. ≥ 4400 /μL) |
1.36 (0.66-2.81) |
0.4179 |
||
Platelet (< vs. ≥ 172 × 103/μL) |
2.12 (1.20-3.75) |
0.0126* |
||
Albumin (< vs. ≥ 3.5 g/dL) |
2.56 (1.46-4.49) |
0.0012* |
||
LDH (≥ vs. < 192 IU/L) |
3.30 (1.72-6.35) |
0.0001* |
||
Creatinine (≥ vs. < 1.3 mg/dL) |
2.12 (1.06-4.25) |
0.0499* |
||
GOT (≥ vs.< 42 IU/L) |
2.23 (1.23-4.02) |
0.0114* |
||
GPT(≥ vs.< 40 IU/L) |
1.60 (0.81-3.13) |
0.1933 |
||
β2-microglobulin (≥ vs. < 340 μg/dL) |
2.28 (1.26-4.12) |
0.0097* |
||
Maximal SUVt (≥ vs. < 18.8) |
1.22 (0.69-2.14) |
0.5022 |
||
MTV (≥ vs. < 190.2 cm3) |
4.05 (2.07-7.95) |
<0.0001* |
2.38 (1.12-5.04) |
0.0240* |
TLG (≥ vs. < 1480.8 cm3) |
2.96 (1.61-5.45) |
0.0003* |
||
BM invovlement (yes vs. no) |
1.33 (0.66-2.69) |
0.4332 |
||
Stage |
||||
I |
1 |
0.0007* |
||
II |
1.01 (0.25-4.04) |
0.9889 |
||
III |
4.00 (1.17-13.67) |
0.0270* |
||
IV |
3.84 (1.15-12.81) |
0.0285* |
||
IPI |
||||
Low (0-1) |
1 |
<0.0001* |
0.0030* |
|
Low-intermediate (2) |
3.14 (1.12-8.81) |
0.0301* |
2.21 (0.76-6.45) |
0.1440 |
High-intermediate (3) |
6.23 (2.19-17.73) |
0.0006* |
3.61 (1.18-11.02) |
0.0240* |
High (4-5) |
14.2 (5.27-38.36) |
<0.0001* |
6.64 (2.17-20.32) |
0.0010* |
Revised IPI |
||||
1 |
1 |
<0.0001* |
||
2 |
3.36 (0.45-25.27) |
0.2391 |
||
3 |
14.3 (1.94-104.7) |
0.0090* |
||
* statistically significant
HR: hazard ratio; CI: confidence interval; WBC: white blood cell; LDH: lactate dehydrogenase; GOT: glutamate oxaloacetate transaminase; GPT: glutamate pyruvate transaminase; SUVt: standardized uptake value of tumor; MTV: metabolic tumor volume; TLG: total lesion glycolysis; BM: bone marrow; IPI: international prognostic index
DISCUSSION
FDG PET/CT scan has been widely used in the oncological field for several years. The clinical roles of FDG PET/CT scan in diagnosis, staging, monitoring of treatment and prediction of prognosis in patients with lymphoma have been reported [7-11]. The maximal SUV of the primary tumor has been previously demonstrated to be of prognostic values, because of easy accessibility and high reproducibility [12, 13]. However, maximal SUV solely recorded intensity of FDG uptake in the most aggressive cells, without reflecting the volumetric concept. The volumetric analysis of MTV and TLG, providing more information than maximal SUV, has brought increasing evidences of clinical value. Meignan et al. collected pooled data from three clinical trials dealing with follicular lymphoma, and found that higher MTV yielded poor clinical outcomes based on PFS [21]. Cottereau et al. reported that higher MTV predicted a poor survival in patients with peripheral T-cell lymphoma [22]. Kanoun et al. [23] and Ceriani et al. [24] had similar reports in Hodgkin’s lymphoma and primary mediastinal (thymic) large B-cell lymphoma respectively.
In DLBCL, Song et al. conducted a retrospective analysis on 169 patients with nodal stage II and III DLBCL, in which MTV had more potential predictive power than Ann Arbor stage [25]. Sasanelli et al. had similar results suggesting that pre-therapy total MTV is an independent predictor of outcome in all staged patients [17]. In patients with bone marrow involvement, it was concluded by Song et al. that high total MTV predicted worse prognosis [26]. Another article by Song and his colleagues concluded that high MTV is an independent factor for predicting survival in primary gastrointestinal DLBCL [27]. Combining early PET/CT response or molecular characteristics, MTV also improved the predictive power and defined a poor prognosis group [20], and made accurate selection of patients to increase tailored therapy [28]. However, conflicting results coexisted. Some articles mentioned that TLG, but not MTV, was the better predictor and correlated well with the patient outcomes [15, 16, 18]. Some articles presented that neither total MTV nor TLG on FDG PET/CT scan was independent predictor [14, 19, 29].
In the current study, we have demonstrated that both total MTV and TLG had the clinical potential to predict PFS and OS in patients with DLBCL receiving R-CHOP chemotherapy. Total MTV and TLG were significantly correlated with hematological (e.g. Hb, albumin, LDH, creatinine, GOT and β2-microglobulin) and clinical (stage, IPI score, revised IPI score and maximal SUVt) parameters. Furthermore, total MTV and IPI score were the only two independent prognostic factors to predict poor PFS and OS. Using the cut-off value determined by ROC curves (PFS, 165.4 cm3; OS, 190.2 cm3), patients with higher MTV had a poorer 5-year PFS and OS (PFS, 32.3% vs. 66.0%; OS, 34.3% vs. 69.9%) respectively. Our result is similar to that reached in earlier articles by Song and Sasanelli et al. [17, 25-27], in spite of different patient populations. In the current study, TLG was statistically significant in univariate analysis, but failed to be an independent factor in multivariate analysis. We speculated that the cause may be related to different definitions of marginal threshold, when measuring the MTV and mean SUV of lesion. Most studies, in which MTV were more predictive for patient outcomes, used absolute cut-off of SUV (more than 2.5), as the threshold to define MTV [20, 25-27], while only one article used 41% threshold of maximal SUV to calculate MTV [17]. The similarities and differences between the current study and previous similar studies in DLBCL were summarized in Table 7.
Table 7: Studies on the prognostic values of MTV and TLG in DLBCL
Study |
Patient numbers |
Treatment |
MTV (cm3) |
TLG (cm3) |
Prognostic significance |
||
|---|---|---|---|---|---|---|---|
Median |
range |
Median |
range |
||||
Adams et al [14] |
73 |
R-CHOP |
445 |
6-2454 |
4898 |
13-23322 |
Neither MTV nor TLG predicted outcome. |
Esfahani et al [15] |
20 |
R-CHOP |
NA |
NA |
NA |
NA |
TLG 705 cm3 yielded PFS 56.5 vs. 29.2 months. |
Kim et al [16] |
140 |
R-CHOP |
NA |
NA |
416 |
5-1499 |
TLG 416 cm3 yielded 2-year PFS 92% vs.73%. |
Sasanelli et al [17] |
114 |
R-CHOP or ASCT |
315 |
4-2654 |
2974 |
14-21908 |
MTV 550 cm3 yielded 3-year OS 87% vs. 60%. |
Zhou et al [18] |
91 |
R-CHOP |
51 |
IQR: 17-151 |
497 |
IQR: 104-1452 |
TLG 827 cm3 yielded 5-year PFS 83% vs. 34%; 726 cm3 yielded 5-year OS 92% vs. 67%. |
Gallicchio et al [19] |
52* |
R-CHOP or R-COMP |
43 |
2-340 |
597 |
110-2552 |
SUVmax rather than MTV and TLG remained the only predictor for EFS. |
Mikhaeel et al [20] |
147 |
R-CHOP |
595 |
2-7357 |
4670 |
6-36570 |
MTV combined i-PET Deauville score had most predictive power. |
Song et al [25] |
169+ |
R-CHOP |
198 |
5-1991 |
NA |
NA |
MTV 220 cm3 yielded 5-year PFS 90% vs. 56%; 5-year OS 93% vs. 58%. |
Song et al [26] |
107# |
R-CHOP |
527 |
15-3549 |
NA |
NA |
Total MTV 601 cm3 yielded significance difference in both PFS and OS. |
Song et al [27] |
165※ |
R-CHOP or Surgery + R-CHOP |
133 |
10-654 |
NA |
NA |
High IPI, High MTV, and surgical resection followed by R-CHOP were independent prognostic factors for PFS and OS. |
Cottereau et al [28] |
81 |
R-CHOP R-ACVBP |
320 |
IQR: 106-668 |
3677 |
IQR: 1066-6096 |
MTV 300 cm3 yielded 5-year PFS 76% vs. 43%; 5-year OS 78% vs. 46%. |
The current study |
118 |
R-CHOP |
249 |
2-2970 |
1531 |
3-18106 |
MTV 165 cm3 yielded 5-year PFS 66% vs. 32%; 190 cm3 yielded 5-year OS 70% vs. 34%. |
Abbreviations:
MTV: metabolic tumor volume; TLG: total lesion glycolysis; R-CHOP: rituximab, cyclophosphamide, doxorubicin, vincristine, and prednisone; NA: not available; PFS: progression-free survival; ASCT: autologous stem cell transplantation; OS: overall survival; IQR: interquartile range; R-COMP: rituximab, cyclophosphamide, hydroxydaunorubicin liposomal, vincristine, prednisone; SUVmax: maximal standardized uptake value; EFS: event-free survival; i-PET: interim positron emission tomography; IPI: international prognostic index; R-ACVBP: rituximab, doxorubicine, vindesine, cyclophosphamide, bleomycin, prednisolone.
* In patients with intermediate IPI score
+ In staged II and III patients without extranodal site involvement
# In patients with bone marrow involvement of lymphoma
※ In patients with stage IE or IIE primary gastrointestinal DLBCL
In the literature review, we found that total MTV and TLG differed in a wide range among earlier reports. The reasons may be related to patient characteristics with a wide range of age, clinical stage and different subtypes of disease. Another important reason was related to the different software and the different ways used to define the marginal threshold with abnormal FDG uptake. There were multiple programs provided by different vendors used to calculate the MTV, e.g. Syngo TrueD (Siemens Healthcare) [14, 15], Planet Onco (DOSISoft) [28], PET-VCAR program (GE Healthcare) [21, 29], Imagys (Keosys, Saint-Herblain, France) [17, 21] and so on. There was a paucity of inter-program correlations and discrepancy.
As to the methodology, there are three basic methods to evaluate the MTV. The first one is according to the threshold percentage of maximal SUV in a lesion [30]. Some authors adopted this method with different thresholds, ranging from 40% to 42% [14, 17, 19, 28, 29]. One article compared 3 settings of marginal thresholds (i.e. 25%, 50% and 75%) to get an optimal one [16]. We think that there are drawbacks in using this methodology. If the maximal SUV of lesion is relatively high, the metabolic volume will be underestimated. For example, if we use a threshold of 40% to estimate the volume of a lesion with maximal SUV of 18, the portion with SUV below 7.2 will not be included in the further calculation. That is the reason why the ideal threshold should be different according to maximal SUV, in the earlier articles. The second method to define threshold is according to the mean SUV of normal liver plus 3 standard deviations (SD) [18, 31]. This method is patient-based and is able to reduce the influence of different PET/CT system and technical or artificial factors. However, the mean SUV of normal liver should be carefully defined, especially in patients who presented with hepatic involvement by lymphoma at the diagnosis. In the current study, we used the third method, in which lesions with an absolute cut-off value of SUV more than 2.5 were incorporated into calculation of total MTV, as suggested by Freudenberg et al. [32]. The method was also adopted in several articles [20, 25-27]. The important things regarding this method are to control the imaging protocols, including patient preparation, as consistently as possible. Under the reading of experienced nuclear physicians, the advantage of this method is that it is easy to define the lesion with a clear-cut value. Several other methods, such as gradient-based, statistical- and texture-based methods for auto-segmentation of PET volumes exist. Every method has its specific advantages and disadvantages. To the best of our knowledge, there is no published technical standard to confirm complete accuracy in measuring the metabolic volumes in all organs and settings. However, a normalized and standardized method to calculate the metabolic volume is necessary, because baseline metabolic tumor volume values were significantly influenced by the choice of the method used for determination of volume [33].
In the dichotomization of ideal cut-off values of total MTV and TLG, most articles used a retrospective ROC analysis to determine the optimal values. Only one article used X-tile analysis to determine the value [21]. Some authors didn’t mention the dichotomizing method in their articles [14, 29]. More reliable analytic tests have been provided. X-tile is a graphical method that illustrates the presence of substantial tumor sub-populations and shows the relationship between a biomarker and outcome by construction of a two dimensional projection of every possible subpopulation [34]. The time-dependent ROC curve is another method, which allows for time-varying marker effects and accommodates censored failure time outcome [35, 36]. Further validations with more sophisticated analytic tests may be necessarily applied.
Although the current study was relatively small with a retrospective design, the results underlined the prediction of poor PFS and OS in DLBCL patients with higher total MTV on the pre-treatment FDG PET/CT scan. In addition to the IPI score, the higher total MTV helped to identify the high-risk patients. Early identification of high-risk patients allowed clinicians to pay more attention to the treatment strategies and follow-up [37]. Further prospective study with a larger patient population and a more specific histological subtype collection may be conducted.
CONCLUSION
Our study indicated that total MTV on pre-treatment FDG PET/CT scans was an independent predictor for survival in patients with DLBCL receiving R-CHOP therapy. An elevated total MTV was associated with poorer PFS and OS.
MATERIALS AND METHODS
Patient population
We performed a retrospective analysis of patients with DLBCL who were diagnosed between September 2009 and December 2014 and received treatment in Kaohsiung Medical University Hospital. Patient consent was waived because all the clinical data were retrospectively collected via medical chart review. However, informed consent before every examination including FDG PET/CT scan was required. The inclusion criteria for this study were as follows: (a) the diagnosis of DLBCL was pathologically proved, (b) complete pre-treatment work-up including history, physical examination, standard laboratory tests, as well as bone marrow aspiration and biopsy were available, (c) a whole-body FDG PET/CT scan was performed for pre-treatment staging, (d) first-line treatment with 6 or 8 cycles of R-CHOP therapy. The exclusion criteria were a previously known history of other malignance and the central nervous involvement of DLBCL. Patients were staged clinically with Ann Arbor staging criteria. The study design and review process was approved by the Institutional Review Board of Kaohsiung Medical University Hospital.
FDG PET/CT acquisition
All the FDG PET/CT images were acquired using the Discovery ST 16 PET/CT scanner (GE Medical System, Waukesha, Wisconsin, USA). Every patient was asked to fast for at least 6 hours prior to the examination. The blood glucose level was measured to enssure no more than 150 mg/dl before the tracer injection. After intravenous injection of 370-555 MBq (10-15 mCi) of 18F-FDG, patients were asked to lie comfortably to reduce muscular uptake. The mean uptake time was 55 ± 5 minutes. Spiral low dose CT scan (140 kV, 80 mA, 3.75 mm section thickness) was acquired with a craniocaudal direction and an “arm up” position, followed by the emission acquisition with a reverse direction. The emission scan time per bed was 4 minutes. PET images were reconstructed iteratively (order subset expectation maximization) with CT data for attenuation correction. The Xeleris Functional Imaging Workstation (GE Medical System, Waukesha, Wisconsin, USA) was used for image display and interpretation.
FDG PET/CT analysis
The image interpretation and SUV measurement were performed by two nuclear medicine physicians, who were blinded to the patients’ clinical outcomes. A positive lesion on PET/CT was defined as focal or diffuse FDG uptake above the background and was not compatible with a physiological normal uptake [38]. Disagreements were resolved by discussion to reach a consensus interpretation. Using CT images from the FDG PET/CT, the maximal SUVt was collected by drawing a region of interest (ROI) over the most intense slice of the primary lesions. The MTV was defined as the volume of hyper-metabolic lesion, with an SUV greater than a threshold of 2.5, as previous literature suggested [32]. To measure MTV values, PET/CT data were transferred in DICOM format to an OsiriX workstation (OsiriX MD 8.0, Pixmeo Sari, Bernex, Switzerland). Using the 3-dimensional segmentation, a 3-dimensional ROI as well as the contour including each hyper-metabolic lesion previously recognized was automatically produced. The voxels presenting SUV values more than 2.5 within the contour margin were then incorporated, in order to calculate the tumor volumes. The mean SUV of the delineated volume was also provided, using the in-house SUV-based automated contouring program. The total MTV of each patient was defined as the summation of MTVs of all focal lesions selected. The TLG was obtained by multiplying the MTV of every focal lesion by the corresponding mean SUV. The whole-body TLG of each patient was determined by the summation of the TLGs of all focal lesions selected.
Treatment and clinical course
PFS was defined as the time from diagnosis to disease relapse, progression or death. OS was defined as the time from diagnosis to death from any cause. All patients received 6 or 8 cycles of R-CHOP for the initial therapy. Involved field radiation therapy was administered for clinically indicated patients, i.e. initial bulky disease (≥ 10 cm) or residual tumor presented, after completion of chemotherapy. Complete remission (CR) was defined by follow-up image evaluation, either by FDG PET/CT or CT scan, according to published criteria [38]. Patients with refractory and relapsed disease were treated with salvage chemotherapy or received autologous stem cell transplantation (ASCT) with high-dose chemotherapy, if clinically indicated. The observation period was from September 2009 to January 2016.
Statistical analysis
Continuous variables were presented as mean (SD) and categorical data were given as frequencies (percentages). A Kolmogorov-Smirnov test was used to determine whether the variable was of normal distribution or not. The Spearman’s rank correlation test was used to analyze the correlation between metabolic parameters from FDG PET/CT and clinical prognostic factors. The Mann-Whitney test was conducted to compare metabolic parameters measured in patients with different clinical outcomes. The optimal cut-off values for total MTV and TLG were determined by ROC curves analysis. The survival curves were obtained by the Kaplan-Meier analysis in the groups dichotomized by optimal cut-off values of metabolic parameters. The survival difference between groups was evaluated by the log-rank test. A Cox proportional hazard model with univariate and multivariate analysis was conducted, to evaluate the impact of every clinical and metabolic parameter on patient survival. The HR and its 95% CI, calculated by Cox proportional hazard model were presented. All these analyses were performed using MedCalc Statistical Software version 17.4.4 (MedCalc Software bvba, Ostend, Belgium; http://www.medcalc.org; 2017). All statistical tests were two-sided, and a two-tailed p < 0.05 was considered significant.
CONFLICTS OF INTEREST
The authors declare no conflicts of interest existed.
REFERENCES
1. Flowers CR, Sinha R, Vose JM. Improving outcomes for patients with diffuse large B-cell lymphoma. CA Cancer J Clin. 2010; 60: 393-408. https://doi.org/10.3322/caac.20087.
2. The International Non-Hodgkin’s Lymphoma Prognostic Factors Project. A predictive model for aggressive non-Hodgkin’s lymphoma. N Engl J Med. 1993; 329: 987-994. https://doi.org/10.1056/NEJM199309303291402.
3. Sehn LH, Berry B, Chhanabhai M, Fitzgerald C, Gill K, Hoskins P, Klasa R, Savage KJ, Shenkier T, Sutherland J, Gascoyne RD, Connors JM. The revised International Prognostic Index (R-IPI) is a better predictor of outcome than the standard IPI for patients with diffuse large B-cell lymphoma treated with R-CHOP. Blood. 2007; 109: 1857-1861. https://doi.org/10.1182/blood-2006-08-038257.
4. Cox MC, Nofroni I, Ruco L, Amodeo R, Ferrari A, La Verde G, Cardelli P, Montefusco E, Conte E, Monarca B, Aloe-Spiriti MA. Low absolute lymphocyte count is a poor prognostic factor in diffuse-large-B-cell-lymphoma. Leuk Lymphoma. 2008; 49: 1745-1751. https://doi.org/10.1080/10428190802226425.
5. Sehn LH, Scott DW, Chhanabhai M, Berry B, Ruskova A, Berkahn L, Connors JM, Gascoyne RD. Impact of concordant and discordant bone marrow involvement on outcome in diffuse large B-cell lymphoma treated with R-CHOP. J Clin Oncol. 2011; 29: 1452-1457. https://doi.org/10.1200/JCO.2010.33.3419.
6. Pfreundschuh M, Ho AD, Cavallin-Stahl E, Wolf M, Pettengell R, Vasova I, Belch A, Walewski J, Zinzani PL, Mingrone W, Kvaloy S, Shpilberg O, Jaeger U, et al. Prognostic significance of maximum tumour (bulk) diameter in young patients with good-prognosis diffuse large-B-cell lymphoma treated with CHOP-like chemotherapy with or without rituximab: an exploratory analysis of the MabThera International Trial Group (MInT) study. Lancet Oncol. 2008; 9: 435-444. https://doi.org/10.1016/s1470-2045(08)70078-0.
7. Cho SF, Chang CC, Liu YC, Chang CS, Hsiao HH, Liu TC, Huang CT, Lin SF. Utilization of 18F-FDG PET/CT as a staging tool in patients with newly diagnosed lymphoma. Kaohsiung J Med Sci. 2015; 31: 130-137. https://doi.org/10.1016/j.kjms.2014.11.012.
8. Schoder H, Noy A, Gonen M, Weng L, Green D, Erdi YE, Larson SM, Yeung HW. Intensity of 18fluorodeoxyglucose uptake in positron emission tomography distinguishes between indolent and aggressive non-Hodgkin’s lymphoma. J Clin Oncol. 2005; 23: 4643-4651. https://doi.org/10.1200/JCO.2005.12.072.
9. Chihara D, Oki Y, Onoda H, Taji H, Yamamoto K, Tamaki T, Morishima Y. High maximum standard uptake value (SUVmax) on PET scan is associated with shorter survival in patients with diffuse large B cell lymphoma. Int J Hematol. 2011; 93: 502-508. https://doi.org/10.1007/s12185-011-0822-y.
10. Berthet L, Cochet A, Kanoun S, Berriolo-Riedinger A, Humbert O, Toubeau M, Dygai-Cochet I, Legouge C, Casasnovas O, Brunotte F. In newly diagnosed diffuse large B-cell lymphoma, determination of bone marrow involvement with 18F-FDG PET/CT provides better diagnostic performance and prognostic stratification than does biopsy. J Nucl Med. 2013; 54: 1244-1250. https://doi.org/10.2967/jnumed.112.114710.
11. Liang JH, Sun J, Wang L, Fan L, Chen YY, Qu XY, Li TN, Li JY, Xu W. Prognostic significance of bone marrow infiltration detected by PET-CT in newly diagnosed diffuse large B cell lymphoma. Oncotarget. 2016; 7: 19072-19080. https://doi.org/10.18632/oncotarget.7616.
12. Miyazaki Y, Nawa Y, Miyagawa M, Kohashi S, Nakase K, Yasukawa M, Hara M. Maximum standard uptake value of 18F-fluorodeoxyglucose positron emission tomography is a prognostic factor for progression-free survival of newly diagnosed patients with diffuse large B cell lymphoma. Ann Hematol. 2013; 92: 239-244. https://doi.org/10.1007/s00277-012-1602-3.
13. Huang H, Xiao F, Han X, Zhong L, Zhong H, Xu L, Zhu J, Ni B, Liu J, Fang Y, Zhang M, Shen L, Wang T, et al. Correlation of pretreatment 18F-FDG uptake with clinicopathological factors and prognosis in patients with newly diagnosed diffuse large B-cell lymphoma. Nucl Med Commun. 2016; 37: 689-698. https://doi.org/10.1097/MNM.0000000000000496.
14. Adams HJ, de Klerk JM, Fijnheer R, Heggelman BG, Dubois SV, Nievelstein RA, Kwee TC. Prognostic superiority of the National Comprehensive Cancer Network International Prognostic Index over pretreatment whole-body volumetric-metabolic FDG-PET/CT metrics in diffuse large B-cell lymphoma. Eur J Haematol. 2015; 94: 532-539. https://doi.org/10.1111/ejh.12467.
15. Esfahani SA, Heidari P, Halpern EF, Hochberg EP, Palmer EL, Mahmood U. Baseline total lesion glycolysis measured with (18)F-FDG PET/CT as a predictor of progression-free survival in diffuse large B-cell lymphoma: a pilot study. Am J Nucl Med Mol Imaging. 2013; 3: 272-281.
16. Kim TM, Paeng JC, Chun IK, Keam B, Jeon YK, Lee SH, Kim DW, Lee DS, Kim CW, Chung JK, Kim IH, Heo DS. Total lesion glycolysis in positron emission tomography is a better predictor of outcome than the International Prognostic Index for patients with diffuse large B cell lymphoma. Cancer. 2013; 119: 1195-1202. https://doi.org/10.1002/cncr.27855.
17. Sasanelli M, Meignan M, Haioun C, Berriolo-Riedinger A, Casasnovas RO, Biggi A, Gallamini A, Siegel BA, Cashen AF, Vera P, Tilly H, Versari A, Itti E. Pretherapy metabolic tumour volume is an independent predictor of outcome in patients with diffuse large B-cell lymphoma. Eur J Nucl Med Mol Imaging. 2014; 41: 2017-2022. https://doi.org/10.1007/s00259-014-2822-7.
18. Zhou M, Chen Y, Huang H, Zhou X, Liu J, Huang G. Prognostic value of total lesion glycolysis of baseline 18F-fluorodeoxyglucose positron emission tomography/computed tomography in diffuse large B-cell lymphoma. Oncotarget. 2016; 7: 83544-83553. https://doi.org/10.18632/oncotarget.13180.
19. Gallicchio R, Mansueto G, Simeon V, Nardelli A, Guariglia R, Capacchione D, Soscia E, Pedicini P, Gattozzi D, Musto P, Storto G. F-18 FDG PET/CT quantization parameters as predictors of outcome in patients with diffuse large B-cell lymphoma. Eur J Haematol. 2014; 92: 382-389. https://doi.org/10.1111/ejh.12268.
20. Mikhaeel NG, Smith D, Dunn JT, Phillips M, Moller H, Fields PA, Wrench D, Barrington SF. Combination of baseline metabolic tumour volume and early response on PET/CT improves progression-free survival prediction in DLBCL. Eur J Nucl Med Mol Imaging. 2016; 43: 1209-1219. https://doi.org/10.1007/s00259-016-3315-7.
21. Meignan M, Cottereau AS, Versari A, Chartier L, Dupuis J, Boussetta S, Grassi I, Casasnovas RO, Haioun C, Tilly H, Tarantino V, Dubreuil J, Federico M, et al. Baseline Metabolic Tumor Volume Predicts Outcome in High-Tumor-Burden Follicular Lymphoma: A Pooled Analysis of Three Multicenter Studies. J Clin Oncol. 2016 Aug 2. https://doi.org/10.1200/JCO.2016.66.9440. [Epub ahead of print].
22. Cottereau AS, Becker S, Broussais F, Casasnovas O, Kanoun S, Roques M, Charrier N, Bertrand S, Delarue R, Bonnet C, Hustinx R, Gaulard P, de Leval L, et al. Prognostic value of baseline total metabolic tumor volume (TMTV0) measured on FDG-PET/CT in patients with peripheral T-cell lymphoma (PTCL). Ann Oncol. 2016; 27: 719-724. https://doi.org/10.1093/annonc/mdw011.
23. Kanoun S, Rossi C, Berriolo-Riedinger A, Dygai-Cochet I, Cochet A, Humbert O, Toubeau M, Ferrant E, Brunotte F, Casasnovas RO. Baseline metabolic tumour volume is an independent prognostic factor in Hodgkin lymphoma. Eur J Nucl Med Mol Imaging. 2014; 41: 1735-1743. https://doi.org/10.1007/s00259-014-2783-x.
24. Ceriani L, Martelli M, Zinzani PL, Ferreri AJ, Botto B, Stelitano C, Gotti M, Cabras MG, Rigacci L, Gargantini L, Merli F, Pinotti G, Mannina D, et al. Utility of baseline 18FDG-PET/CT functional parameters in defining prognosis of primary mediastinal (thymic) large B-cell lymphoma. Blood. 2015; 126: 950-956. https://doi.org/10.1182/blood-2014-12-616474.
25. Song MK, Chung JS, Shin HJ, Lee SM, Lee SE, Lee HS, Lee GW, Kim SJ, Lee SM, Chung DS. Clinical significance of metabolic tumor volume by PET/CT in stages II and III of diffuse large B cell lymphoma without extranodal site involvement. Ann Hematol. 2012; 91: 697-703. https://doi.org/10.1007/s00277-011-1357-2.
26. Song MK, Yang DH, Lee GW, Lim SN, Shin S, Pak KJ, Kwon SY, Shim HK, Choi BH, Kim IS, Shin DH, Kim SG, Oh SY. High total metabolic tumor volume in PET/CT predicts worse prognosis in diffuse large B cell lymphoma patients with bone marrow involvement in rituximab era. Leuk Res. 2016; 42: 1-6. https://doi.org/10.1016/j.leukres.2016.01.010.
27. Song MK, Chung JS, Shin HJ, Moon JH, Lee JO, Lee HS, Lee SM, Lee GW, Lee SE, Kim SJ. Prognostic value of metabolic tumor volume on PET / CT in primary gastrointestinal diffuse large B cell lymphoma. Cancer Sci. 2012; 103: 477-482. https://doi.org/10.1111/j.1349-7006.2011.02164.x.
28. Cottereau AS, Lanic H, Mareschal S, Meignan M, Vera P, Tilly H, Jardin F, Becker S. Molecular Profile and FDG-PET/CT Total Metabolic Tumor Volume Improve Risk Classification at Diagnosis for Patients with Diffuse Large B-Cell Lymphoma. Clin Cancer Res. 2016; 22: 3801-3809. https://doi.org/10.1158/1078-0432.CCR-15-2825.
29. Schoder H, Zelenetz AD, Hamlin P, Gavane S, Horwitz S, Matasar M, Moskowitz A, Noy A, Palomba L, Portlock C, Straus D, Grewal R, Migliacci JC, et al. Prospective Study of 3’-Deoxy-3’-18F-Fluorothymidine PET for Early Interim Response Assessment in Advanced-Stage B-Cell Lymphoma. J Nucl Med. 2016; 57: 728-734. https://doi.org/10.2967/jnumed.115.166769.
30. Meignan M, Sasanelli M, Casasnovas RO, Luminari S, Fioroni F, Coriani C, Masset H, Itti E, Gobbi PG, Merli F, Versari A. Metabolic tumour volumes measured at staging in lymphoma: methodological evaluation on phantom experiments and patients. Eur J Nucl Med Mol Imaging. 2014; 41: 1113-1122. https://doi.org/10.1007/s00259-014-2705-y.
31. Wahl RL, Jacene H, Kasamon Y, Lodge MA. From RECIST to PERCIST: Evolving Considerations for PET response criteria in solid tumors. J Nucl Med. 2009; 50: 122S-150S. https://doi.org/10.2967/jnumed.108.057307.
32. Freudenberg LS, Antoch G, Schutt P, Beyer T, Jentzen W, Muller SP, Gorges R, Nowrousian MR, Bockisch A, Debatin JF. FDG-PET/CT in re-staging of patients with lymphoma. Eur J Nucl Med Mol Imaging. 2004; 31: 325-329. https://doi.org/10.1007/s00259-003-1375-y.
33. Kanoun S, Tal I, Berriolo-Riedinger A, Rossi C, Riedinger JM, Vrigneaud JM, Legrand L, Humbert O, Casasnovas O, Brunotte F, Cochet A. Influence of Software Tool and Methodological Aspects of Total Metabolic Tumor Volume Calculation on Baseline [18F]FDG PET to Predict Survival in Hodgkin Lymphoma. PLoS One. 2015; 10: e0140830. https://doi.org/10.1371/journal.pone.0140830.
34. Camp RL, Dolled-Filhart M, Rimm DL. X-tile: a new bio-informatics tool for biomarker assessment and outcome-based cut-point optimization. Clin Cancer Res. 2004; 10: 7252-7259. https://doi.org/10.1158/1078-0432.ccr-04-0713.
35. Zheng Y, Cai T, Feng Z. Application of the time-dependent ROC curves for prognostic accuracy with multiple biomarkers. Biometrics. 2006; 62: 279-287. https://doi.org/10.1111/j.1541-0420.2005.00441.x.
36. Kamarudin AN, Cox T, Kolamunnage-Dona R. Time-dependent ROC curve analysis in medical research: current methods and applications. BMC Med Res Methodol. 2017; 17: 53. https://doi.org/10.1186/s12874-017-0332-6.
37. Haioun C, Lepage E, Gisselbrecht C, Salles G, Coiffier B, Brice P, Bosly A, Morel P, Nouvel C, Tilly H, Lederlin P, Sebban C, Briere J, et al. Survival benefit of high-dose therapy in poor-risk aggressive non-Hodgkin’s lymphoma: final analysis of the prospective LNH87-2 protocol—a groupe d’Etude des lymphomes de l’Adulte study. J Clin Oncol. 2000; 18: 3025-3030.
38. Cheson BD, Pfistner B, Juweid ME, Gascoyne RD, Specht L, Horning SJ, Coiffier B, Fisher RI, Hagenbeek A, Zucca E, Rosen ST, Stroobants S, Lister TA, et al. Revised response criteria for malignant lymphoma. J Clin Oncol. 2007; 25: 579-586. https://doi.org/10.1200/JCO.2006.09.2403.