
INTRODUCTION
Transcription factors (TFs) are crucial proteins that mediate gene transcriptional regulation by binding to specific DNA sequences in all living organisms. Several technologies have been developed to investigate the binding of TFs in a high-throughput manner [1]. Among them, chromatin immunoprecipitation followed by microarray hybridization (ChIP-chip) [2] or high-throughput DNA sequencing (ChIP-seq) [3] have become the most widely used methods to detect binding events of individual TFs across the entire genome [1, 4–6]. These methods identify direct and indirect (through interacting with co-factors) binding sites of DNA-associated proteins of interest [4, 7, 8]. Currently, ChIP-seq has become one of the most important technologies used in genomic studies as evidenced by the rapid accumulation of ChIP-seq data.
Previous studies have reported a rapid turnover rate of binding sites of homologous TFs in different species [9–14], suggesting that individual binding sites of a TF are not conserved. Odom et al. performed ChIP-chip analysis and found that the binding sites varied extensively between human and mouse even for TFs that are highly conserved during evolution [13]. Borneman et al. compared the pseudohyphal regulators STE12 and TEC1 binding sites in three yeast species, S. cerevisiae, S. mikatae, and S. bayanus under pseudohyphal conditions and reached a similar conclusion [11]. Other than these comparative studies by experiments, computational studies based on systematic motif analysis also indicated high turnover rate of TF binding motifs in different organisms [12, 14]. In spite of this, functional conservation has been demonstrated for many TFs even between species that are distantly related [15, 16]. In other words, the homologous TFs participate in the regulation of the same biological process in different species. Interestingly, the functional conservation of them can be attained through regulating different sets of target genes in different species. For example, Tuch et al. showed that the target genes of MCM1 have diverged substantially in three related yeast species; however, in all species MCM1 is involved in regulating cell cycle and mating processes [17]. Moreover, motif analyses indicate that the binding motifs associated with a TF is generally conserved across species, presumably due to the selective pressure imposed on its DNA binding domain [7].
On the other hand, the genomic occupancy of a TF in multiple cell types of the same organism shows different degrees of variation. For some TFs, a high degree of shared occupancy between cell types has been observed. Investigation of CTCF binding in 19 human cell lines, for instance, indicates that on average 72% of CTCF sites were shared between any two cell types [18]. Additionally, variable binding has been observed for 64% of CTCF sites which vary in at least one cell type. However, the binding variation for some other TFs are more dramatic. Shira et al. compared the REST genomic occupancy in 16 different human cell lines and found that only 7% of binding peaks are shared by all cell lines [19]. According to the unpredictable binding of TFs described above, an interesting question arises: is the genomic occupancy of a TF more similar in more closely related cell types? Intuitively, this should be the case according to general knowledge from transcriptomic and other genomic studies. It has been shown in previous studies that gene expression [20, 21] and DNA methylation [22, 23] levels are highly consistent in cell lines from the same tissue. Moreover, TF binding is largely determined by local chromatin structure (i.e., the accessibility as measured by DNase I hypersensitivity analysis [24, 25]) that is shaped by epigenetic mechanisms such as histone modification [26, 27]. In fact, it has been demonstrated that a combination of these genomic features with motif analysis can predict TF binding sites with fairly high accuracy [28–32]. Furthermore, data generated from the Encyclopedia of DNA Elements (ENCODE) [33] indicate that high similarity of DNase I hypersensitivity regions between cell lines of similar tissue origins [34, 35]. Given these results, we would also expect TF binding profiles be more similar in closely related tissues or cell types.
In this study, we investigate FOXM1 binding in several cell lines and show that overall genetic similarity of cell lines does not hold precedence over context-specific TF-co-factor interactions in determining TF binding profiles. FOXM1, forkhead box protein, is a crucial cell cycle regulator [36, 37], which has been shown to be highly associated with multiple cancer types [38–42]. Recently, genomic binding data of FOXM1 have been generated by ChIP-seq experiments in several studies [43–47]. Based on these data, we performed a comparative analysis to identify the common and specific genome-wide binding events of FOXM1 in 8 distinct cell lines derived from 7 different tissues. By systematically comparing the binding sites and target genes of FOXM1, we find that even though MCF-7 and MDA-MB-231 are both breast cancer cell lines, FOXM1 binding events are substantially different between these two cell lines compared to non-breast cell lines. In particular, FOXM1 binding sites are more similar in MDA-MB-231, HeLa, U2OS, HEK293, GM12878, SK-N-SH and ECC-1 although they all represent different tissues. Moreover, the prognostic value of FOXM1 has been reported in several cancer types [43, 48–50] with the observation that FOXM1 activity is more predictive to prognosis than its mRNA level. We examined the ability of using target genes to infer FOXM1 activity in tumor samples and investigated their association with patient survival in breast cancer. We find that the inferred regulatory activity of FOXM1 is predictive of the survival of patients, and more interestingly, scores inferred based on FOXM1 targets from different cell lines provide complementary clinically related information -- MCF-7 specific FOXM1 targets inform estrogen receptor (ER) activity while targets in other cell lines inform the proliferative ability of tumor cells. These results indicate that the genomic occupation of TFs is more complicated than expected, and that these nuanced changes in binding activity are manifested at the clinical level.
RESULTS
Overview of our analyses
To compare FOXM1 binding sites in different human cell lines, we searched for all available FOXM1 ChIP-seq datasets in the Gene Expression Omnibus (GEO) database [51] and obtained a total of 23 ChIP-seq experiments for FOXM1 at the time of writing. These FOXM1 binding data were collected from 6 studies across 8 different cell lines (Table 1), including MCF-7 (ER-positive breast cancer), MDA-MB-231 (ER-negative breast cancer), ECC-1 (endometrium cancer), GM12878 (blood), HEK293 (kidney cancer), HeLa (cervical cancer), SK-N-SH (neuroblastoma), and U2OS (osteosarcoma). For these datasets, we performed systematic comparative analyses using different levels of information from these data (Figure 1). First, at the binding signal level we performed principle component analysis (PCA) [52] on the normalized binding signals of the ChIP-seq experiments. Second, at the peak level we identified FOXM1 binding peaks in each of these ChIP-seq experiments and examined the number of shared peaks between each pair of experiments. Moreover, we performed motif analyses to examine the enrichment of 687 motifs available from the TFANSFAC [53] and JASPAR [54] databases in the binding peaks of each ChIP-seq experiment. Third, at the gene level we defined FOXM1 target genes using a probabilistic model and compared the shared genes between all pairs of experiments. Comparative analyses at the signal, peak, and gene target levels consistently support that MCF-7 ChIP-seq experiments are highly similar to each other but exhibit little resemblance to MDA-MB-231, which is more similar to non-breast cell lines. Finally, at the level of regulation activity, we applied the Binding Association with Sorted Expression (BASE) algorithm [55] to a primary breast cancer expression dataset to infer FOXM1 regulatory activity in patient samples based on its target gene expression. Our results suggested that FOXM1 target genes identified in all cell lines except MCF-7 are informative of the proliferation-regulating activity of FOXM1, while the target genes identified in MCF-7 cell line reflect ER activity rather than FOXM1 activity. Excitingly, the activities inferred based on MCF-7 and other cell lines can be combined to achieve more accurate prediction of patient prognosis.
Table 1: Numbers of reads, peaks and genes in each ChIP-seq experiment
ChIP-seq ID |
Total Reads |
Total Peaks |
Total Target Genes |
GSE |
Antibody |
Cell Line |
Tissue |
|---|---|---|---|---|---|---|---|
SRR577922 |
116,488,388 |
18,765 |
274 |
GSE32465 |
SC-502 |
ECC-1 |
Endometrium |
SRR577923 |
94,505,444 |
5,892 |
228 |
||||
SRR577673 |
168,945,472 |
54,916 |
243 |
GSE32465 |
SC-502 |
GM12878 |
Blood |
SRR577674 |
121,585,588 |
30,273 |
199 |
||||
SRR1534936 |
140,964,036 |
3,883 |
162 |
GSE60032 |
GTX-102170 |
HEK293 |
Kidney |
SRR1534937 |
144,836,032 |
1,963 |
148 |
||||
SRR1045855 |
68,473,196 |
3,789 |
243 |
GSE52098 |
SC-502 |
HeLa |
Cervical |
SRR1045856 |
67,826,668 |
1,426 |
209 |
||||
SRR2390493 |
168,903,060 |
12,214 |
112 |
GSE72977 |
SC-501 |
MCF-7 |
Breast |
SRR2390494 |
143,504,268 |
5,032 |
97 |
||||
SRR2390496 |
150,878,452 |
14,806 |
95 |
||||
SRR567275 |
125,468,568 |
34,091 |
114 |
GSE40762 |
SC-502 |
||
SRR567277 |
115,745,436 |
2,763 |
92 |
||||
SRR567284 |
54,319,080 |
517 |
95 |
||||
SRR567287 |
135,548,148 |
9,148 |
109 |
||||
SRR577748 |
140,926,888 |
24,926 |
95 |
GSE32465 |
SC-502 |
||
SRR577749 |
67,248,588 |
7,801 |
90 |
||||
SRR567279 |
112,861,044 |
13,816 |
190 |
GSE40762 |
SC-502 |
MDA-MB-231 |
|
SRR567281 |
129,971,924 |
11,160 |
111 |
||||
SRR577710 |
119,592,208 |
13,405 |
170 |
GSE32465 |
SC-502 |
SK-N-SH |
Neuroblastoma |
SRR577711 |
94,138,820 |
12,122 |
183 |
||||
SRR500261 |
147,600,792 |
1,188 |
127 |
GSE38170 |
SC-502 |
U2OS |
Osteosarcoma |
SRR500262 |
45,863,008 |
584 |
138 |
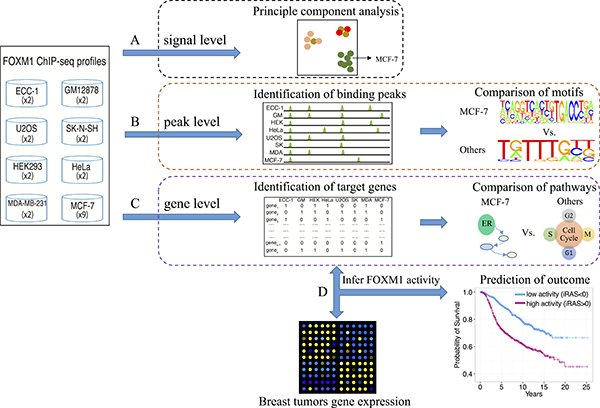
Figure 1: Schematic depicting the comparison of FOXM1 binding in different cell lines. We compared the difference based on three levels, (A) the raw signal profiles, (B) binding peaks and (C) target genes, to show the different binding of FOXM1 in different cells. (D) We applied the target gene profiles to infer FOXM1 activity and further compared the difference.
Comparison of FOXM1 binding signals and peaks
We first sought to investigate the difference in FOXM1 binding events between different cell types. We divided the whole human genome into 100 bp bins, and for each bin we calculated the normalized binding signal (mean coverage per million reads) based on the continuous-valued TF binding signal provided in the bedGraph files. Bins with non-zero signal in at least one of the 23 ChIP-seq profiles were selected for PCA analysis. The results showed that all MCF-7 cell ChIP-seq profiles clustered together according to the first principle component, whereas MDA-MB-231 profiles were grouped with HEK293, HeLa and U2OS (Figure 2A). This is interesting since MDA-MB-231 and MCF-7 are both breast cancer cell lines, yet FOXM1 binding profiles in MDA-MB-231 are more similar to those in non-breast cell lines.
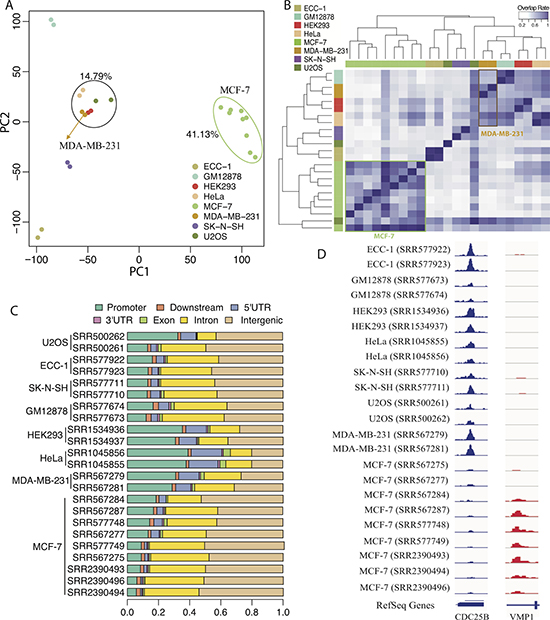
Figure 2: Comparison of FOXM1 binding events in different cell lines. (A) PCA analysis of the normalized binding signal of FOXM1 in different ChIP-seq experiments. Colored dots represent different ChIP-seq experiments. The first PC explains 41.13% variation and the second PC explains 14.79% variation. (B) Peak overlap analysis based on the called binding peak in different ChIP-seq experiments. The color bars in left and top represent different ChIP-seq experiments. (C) Genomic regions distribution of FOXM1 binding peaks in different ChIP-seq experiments. (D) Two specific examples of FOXM1 binding.
Second, we called FOXM1 binding peaks for all ChIP-seq experiments using Model-based Analysis of ChIP-Seq (MACS2) [56]. The number of FOXM1 binding peaks ranged from 517 to 54,916 depending on sequencing depth and other experimental factors, with details shown in Table 1. We examined the number of shared peaks between each pair of TF binding experiments. A peak in one experiment is counted as shared if there is at least a 1 bp overlap with peaks from the other experiment. Peak overlap analysis showed that most FOXM1 binding peaks called in MCF-7 cells are shared, despite the variation in peak numbers across different experiments (Figure 2B). As expected, peaks in MCF-7 exhibited low overlap with those called in the other cell types. Strikingly, binding peaks in MDA-MB-231 cells exhibited greater overlap with those in non-breast cell lines than with MCF-7 cells (Figure 2B). Moreover, FOXM1 binding peaks displayed different genomic distribution in different cell types (Figure 2C and see Supplementary Figure 1). Compared to other cell types, a smaller fraction of FOXM1 binding peaks in MCF-7 cells were observed in promoter regions, but more binding events occurred in intergenic regions. In MDA-MB-231 and other non-breast cell lines, FOXM1 binding signals exhibited high enrichment in regions proximal to transcription start sites (TSS) (from −1 kb to 1 kb) (see Supplementary Figure 2). Conversely, binding signals in MCF-7 cells were more enriched in regions distal to gene TSSs (from −3 kb to −2 kb and from 2 kb to 3kb).
Figure 2D shows a strong FOXM1 binding peak associated with the gene CDC25B, a well-known FOXM1 target gene [57], which was detected in all cell types but MCF-7. This phenomenon was also observed for many other cell cycle genes (data not shown), implying that FOXM1 may be less involved in cell cycle regulation in MCF-7 cells. In contrast, a FOXM1 binding peak associated with VMP1, a gene encoding a vacuole membrane protein [58], was only detected in MCF-7 cells (Figure 2D). Taken together, these results suggest that FOXM1 binding in MCF-7 cells differs from that of the other cell types, most notably MDA-MB-231. Moreover, FOXM1 binding in MDA-MB-231 was more similar to binding in non-breast cell lines. One plausible explanation is that estrogen receptor alpha (ERα), which is present in MCF7 but not in MDA-MB-231 cells, modulates FOXM1 activity by recruiting FOXM1 to ERα binding sites [59, 60] and causing differential FOXM1 binding between the two breast-cancer cell lines [59].
Comparison of motifs enriched in FOXM1 binding sites
To further investigate differences in FOXM1 binding events, we identified the TF binding motifs that are enriched in FOXM1 binding peaks in different cell lines. Motif enrichment analysis was conducted by scanning for 687 motifs from the TRANSFAC [53] and JASPAR [54] databases in peak regions (see details in Methods). To test whether a motif is enriched, we calculated enrichment scores for each FOXM1 binding peak across all the motifs enrolled in those two datasets. A log2-transformation was applied after performing the motif enrichment analysis so that a positive value indicates enrichment and a negative value indicates depletion. The results showed that experiments in MCF-7 cell lines (green bar) clustered together based on their enriched motifs compared with the other cell lines, whereas those from MDA-MB-231 (brown bar) cell lines clustered with other non-breast cells (Figure 3A).
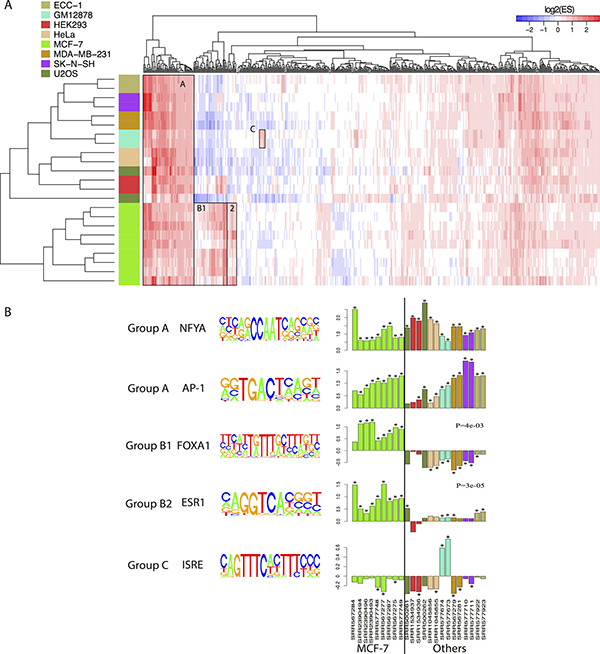
Figure 3: Comparison of enriched motifs of FOXM1 in different cells. (A) Motif enrichment analyses across all FOXM1 ChIP-seq experiments. The color bars in the left represent different cell lines. The value in heatmap is log 2 transferred enrichment score (ES). (B) Five specific examples show the different binding of FOXM1 in different ChIP-seq experiments. Barplot was performed in log2 transferred enrichment scores. * represents the significance of enrichment (FDR < 0.01). Mann Whitney Wilcoxon Test p-value was showed in the FOXA1 and ESR1 examples.
In Figure 3A, we highlighted three interesting groups of enriched motifs. Group A contained the motifs enriched in all cell lines. Amongst these common motifs, NFYA (NFY CCAAT) has already been confirmed to be enriched in U2OS [47] and HeLa [61] cells; FOS and AP1 were previously shown to be associated with both ERα and FOXM1 binding [61, 62]; and BACH1 and BACH2 are two FOXM1 related proteins [63]. This group also contained some members of the E2F family of TFs involved in the cell cycle [64]. Group B consisted of two groups, where group B1 was mainly enriched in MCF-7 cells while group B2 was specific to MCF-7 cells. Specifically, motifs in group B1 consisted of diverse forkhead family and GATA family motifs, including FOXA1, FOXA2 and GATA3 which have been shown to act as ERα pioneer factors [65–67]. On the other hand, group B2 contained motifs associated with many kinds of receptors including estrogen receptor, nuclear receptor, peroxisome proliferator-activated receptor and thyroid hormone receptor. In group B2, ESR1 and ESRRA are two specific motifs for ERα [68, 69], and RORA (nuclear receptor related) and PPARG (peroxisome proliferator-activated receptor related) have been shown to associate with ERα [70, 71]. Group C contained motifs that are specifically enriched in GM12878 cells, and motifs which are associated with signal transduction, activation of transcription, and interferon regulatory factors.
Moreover, we compared log2-transformed ESs of five different motifs between the cluster groups including NFYA, AP-1, FOXA1, ESR1, and ISRE (Figure 3B). As shown, FOXA1 (Mann Whitney Wilcoxon Test P = 4e-03) and ESR1 (Mann Whitney Wilcoxon Test P = 3e-05) were significantly enriched in MCF-7 cell lines compared to others (Figure 3B). The same result was also observed for other ER-related motifs (see Supplementary Figure 3). These findings suggest that ERα may interact with FOXM1 and mediate FOXM1 binding in MCF-7 cell line.
Moreover, we conducted a preliminary exploration into other co-factors that may modulate FOXM1 binding activity. Due to higher enrichment in non-MCF-7 cells, we used NFH3 (see Supplementary Figure 4), a FOXM1 motif included in the TF Encyclopedia dataset [72] as the primary motif for SpaMo algorithm [73]. Besides, we utilized HOCOMOCO V10 [74], a human motif database as the secondary motif database as SpaMo input. Our results (see Supplementary Table 1) suggest that the motif of STAT3, a regulator involved in signal transduction and activation of transcription [75], was enriched in all cell lines except GM12878.
Comparison of FOXM1 target genes
Next, we explored whether the differential genome-wide binding sites of FOXM1 results in the regulation of different target genes across varied cell lines. To identify the target genes of FOXM1, we applied a probabilistic model, TIP [76], to determine target genes for each ChIP-seq experiment (see Supplementary Table 2). The numbers of identified target genes for each ChIP-seq experiment were shown in Table 1, with a range of 92 (in MCF-7 cell) to 274 (in ECC-1 cell). According to the target genes, pair-wised enrichment analyses were conducted to calculate the corresponding p values. Based on negative log 10 transferred p values, the cluster results showed that target genes from all MCF-7 related ChIP-seq experiments exhibit significant overlap with each other but little overlap with those from other cells (Figure 4A). Consistent with our binding peaks and motif analyses, target genes detected in MDA-MB-231 and other non-breast cell lines displayed highly degree of consistency.
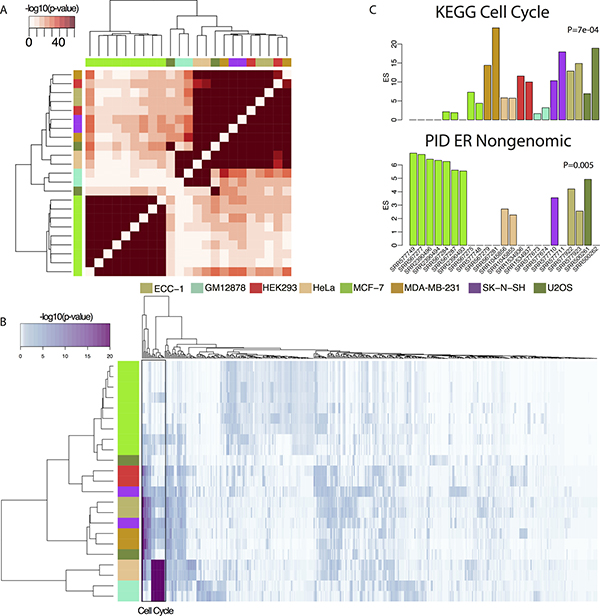
Figure 4: Comparison of target genes of FOXM1 in different cells. (A) Heatmap of the enrichment of the target genes of pair-wised ChIP-seq experiments. The color bars around the heat map represent different cells. (B) Heatmap of pathway enrichment results based on negative log 10 transferred p-value. The color bars in the left represent different cells. (C) Enrichment scores comparison of two pathways, the cell cycle and the ER nongenomic, in MCF-7 and other cell lines. Colored bars represent corresponding cells. Mann Whitney Wilcoxon Test p-value was showed.
Furthermore, we performed comprehensive pathway analysis on target genes in each ChIP-seq experiment using the Molecular Signatures database (MSigDB) [77] C2 pathway database which integrates KEGG [78], REACTOME [79], Pathway Interaction Database (PID) [80] and BioCarta [81] databases. Because FOXM1 is a critical cell cycle regulating TF [82], we expected that the most significant enriched pathways would be related to the cell cycle. Indeed, our results showed that pathways related to the cell cycle were significantly enriched in FOXM1 target genes in MDA-MB-231 and other non-breast cell lines (Figure 4B). However, pathways enriched in FOXM1 target genes from MCF-7 cell lines exhibited lower enrichment in the cell cycle pathway (Figure 4C, Mann Whitney Wilcoxon Test P = 7e-04) but higher enrichment in an estrogen receptor related pathway, ER non-genomic pathway (Figure 4C, Mann Whitney Wilcoxon Test P = 0.005), when compared to other cell lines (Figure 4B). These results suggest that recruitment by ERα modifies the binding of FOXM1 in MCF-7 cell lines resulting in distinctive binding sites that differ from that of MDA-MB-231 and other non-breast cell lines. Moreover, the target genes of FOXM1 displayed a high degree of concordance between MDA-MD-231 and the other 6 non-breast cell lines even though they are derived from diverse tissues.
Prognostic prediction based on FOXM1 activity in breast cancer
Several studies have shown that the transcriptional activity of FOXM1 is more predictive than its mRNA expression in cancers [43, 48–50]. To further investigate whether the different binding of FOXM1 is able to disturb its activity, we applied a computational method that infers FOXM1 activity based on its target gene expression, and examined whether it is prognosticative. We performed our analysis in the METABRIC breast cancer dataset, which contains gene expression and clinical profiles for 1,992 breast cancer patients [83]. We first merged target genes identified in each cell line into a core set of FOXM1 target genes and employed the BASE algorithm [55] to calculate an individual Regulatory Activity Score (iRAS) for each tumor sample based on the expression of FOXM1 target genes in the tumor gene expression profile. A higher iRAS in a tumor sample indicates that target genes of FOXM1 tend to have higher expression level and therefore a higher transcriptional activity of FOXM1 in this sample. Since FOXM1 target genes have been identified in 8 cell lines, we inferred FOXM1 activities in breast cancer samples using target genes identified in each individual cell line, resulting in eight iRASs for a tumor sample. Here, we utilized the target genes from the two breast cancer cell lines, MCF-7 and MDA-MB-231, as an example to investigate whether the inferred TF activities are associated with cancer outcome. Specifically, we denote FOXM1 activity inferred based on target genes identified in MCF-7 cell line as iRASMCF-7. Similarly, iRASMDA indicates FOXM1 activity inferred based on its target genes in MDA-MB-231 cell line.
We first compared the inferred regulatory activities of FOXM1 in ER-positive (ER+) versus ER-negative (ER−) breast tumor samples. When FOXM1 targets identified in MCF-7 were used for activity inference, the resulting iRASMCF-7 showed significant difference between ER+ and ER− samples (Figure 5A). As shown, ER+ samples exhibited significantly higher iRASMCF-7 than ER- samples (Mann Whitney Wilcoxon Test P = 4e-98). However, when we stratified patients into ER+ and ER- groups, iRASMCF-7 is not associated with prognosis any more (P > 0.1). This indicates that FOXM1 targets in MCF-7 cell lines reflect estrogen receptor activity in breast tumor samples, implying that ERα serves as the major factor that mediates FOXM1 genomic binding in ER+ breast cancer. Namely, in majority binding sites, ERα mediates FOXM1 through its DNA motifs, and thus regulating the transcription of ERα target genes. We further divided patients into two groups based on iRASMCF-7, patients with high iRASMCF-7 (iRASMCF-7 > 0) and those with low iRASMCF-7 (iRASMCF-7 < 0), and compared their prognosis. Patients with high iRASMCF-7 exhibited better prognosis compared to those with low iRASMCF-7 (Figure 5B, log-rank P = 6e-05). These observations further implied that iRASMCF-7 primarily reflects ERα activity in a tumor sample where higher ERα activity indicates greater sensitivity to hormone treatment, even though the major function of FOXM1 is to regulate cell cycle division.
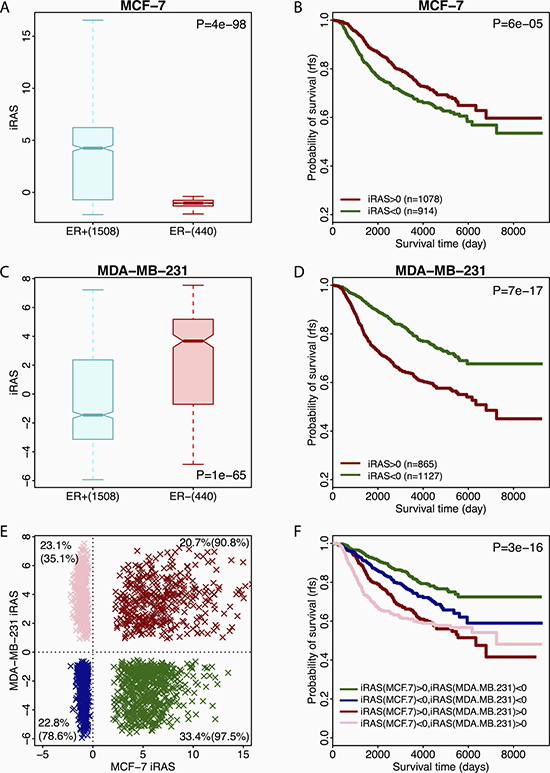
Figure 5: Associations between different FOXM1 activities and primary breast cancer sample prognosis. (A) Boxplot for iRASMCF-7 of ER+ and ER- patients. (B) Survival curve for ER+ and ER- patients with high or low iRASMCF. (C) Boxplot for iRASMDA of ER+ and ER- patients. (D) Survival curve for ER+ and ER- patients with high or low iRASMDA. (E) Distribution of patients based on both iRASMCF-7 and iRASMDA. Red dots: patients with both positive iRASMCF-7 and iRASMDA. Blue dots: patients with both negative iRASMCF-7 and iRASMDA. Green dots: patients with positive iRASMCF-7 and negative iRASMDA. Pink dots: patients with negative iRASMCF-7 and positive iRASMDA. The percentages at four corners are the fractions of patients with ER+ in the corresponding group. The number 1~4 mapped to the survival curves. (F) Survival curves for the four patient groups.
We then examined the regulatory activity of FOXM1 inferred based on its targets in MDA-MB-231, an ER-negative breast cancer cell line, and generated the corresponding iRASMDA. We observed significantly lower iRASMDA in ER+ than in ER- tumor samples (Figure 5C, Mann Whitney Wilcoxon Test P = 1e-65), which is opposite to what we observed for iRASMCF-7. Furthermore, patients with low iRASMDA had better prognosis compared to those with high iRASMDA (Figure 5D, log-rank P = 7e-17). These results suggested that iRASMDA reflects the activity of FOXM1 in regulating cell proliferation. Lower iRASMDA indicates slower proliferation of tumor cells in a patient’s sample, and therefore informs better prognosis. The relevance of iRASMDA with cell proliferation was further confirmed by its high positive correlation with the E2F4 score (Pearson Coefficient R = 0.93, see Supplementary Figure 5), which is calculated based on an E2F4 gene signature that serves as an accurate indicator of cell proliferation in breast tumor cells [84]. In contrast, iRASMCF-7 inferred based on FOXM1 targets in MCF-7 cell lines showed no significant correlation with iRASE2F4 (Pearson Coefficient R = 0.017, see Supplementary Figure 5). However, the calculated iRASMCF-7 had high positive correlation (Pearson Coefficient R = 0.45, see Supplementary Figure 5) with ESR1 gene expression while iRASMDA was negatively correlated (Pearson Coefficient R = −0.34, Supplementary Figure 5) with ESR1 gene expression. Moreover, we also inferred the FOXM1 activities in breast tumor samples based on its target genes identified in the other six non-breast cell lines. As expected the resulting iRAS were similar to iRASMDA but different from iRASMCF-7 in terms of prognostic prediction (Supplementary Figures 5 and 6).
Our observations indicate that FOXM1 activity inferred based on its targets in MCF-7 cell line serves as a proxy for ERα activity, while iRASMDA and other iRAS calculated using the target genes in non-breast cells serve as proxies for proliferation. Since both ER status and proliferation are critical factors for determining patient prognosis in breast cancer, we postulated that prognosis could be better predicated based on a combination of iRASMCF-7 and iRASMDA. Specifically, we divided the patients into four categories based on both iRASMCF-7 and iRASMDA (Figure 5E). For example, patients (green) with high iRASMCF-7 and low iRASMDA were classified as group 1 which encompassed 33.4% of patients in the METABRIC dataset, 97.5% of which were ER+ patients. In contrast, patients (pink) in group 4 contained 23.1% of METABRIC patients with only 35.1% of these patients being ER+. This observation further suggests that the calculated iRASMCF-7 reflects the activity of estrogen receptor, which is consistent with Figure 5A where ER+ patients exhibited higher iRASMCF-7 than ER- patients. More interestingly, when we compared group 1 with group 4, we found that ER+ patients are more likely to maintain lower cell proliferation. We further found that patients in group 1 have the best outcome compared to the other 3 groups (Figure 5F, log-rank P = 3e-16), as these patients are associated with higher ERα activity and lower proliferation. Moreover, patients in group 1 and 2 had better prognosis compared to those in group 3 and 4 which implies that proliferation is more prognosticative than ER activity in breast cancer. These observations suggest that the combination of the inferred activities of both ERα and proliferation can provide more precise prognostic predictions in breast cancer.
DISCUSSION
TFs play crucial roles in regulating gene expression by binding to many cis-regulatory elements that decide cell fate. ChIP-seq technology has been widely utilized to investigate the binding sites of several TFs in a panoply of biological contexts. Intuitively, we would expect to observe more similar genomic binding profiles of a TF in cell lines from the same or more closely related tissues. However, our analyses on FOXM1, a well-known cell cycle regulator [85], provide an example showing that the overall genetic similarity of cell lines does not always hold precedent over context-specific TF co-factors in determining TF binding profiles.
In this study, we focus on the binding events of FOXM1 using 23 ChIP-seq experiments from 8 human cell lines that encompass 7 different tissues (Table 1). We comprehensively examine the binding patterns of FOXM1 across 4 information layers including raw binding signals, binding peaks, target genes, and regulator activity (Figure 1). The PCA analysis of raw binding signals showed that ChIP-seq experiments in MDA-MB-231 clustered with HEK293, HeLa and U2OS cell lines signals while those from MCF-7 cell lines group together independently. This is surprising due to the fact that MCF-7 and MDA-MB-231 are both breast cancer cell lines that are dissimilar in their FOXM1 binding profiles. In addition, binding profiles in MDA-MB-231 are more similar to those from other non-breast tissues.
Peaks called in MCF-7 cell lines exhibited high overlap with each other even though the total number of peaks called differed between experiments. Contrastingly, peaks identified in another breast cancer cell line, MDA-MB-231, showed a high degree of overlap with other non-breast cell lines. Furthermore, utilizing the called binding peaks of FOXM1, we compared motifs enriched in different ChIP-seq experiments and demonstrated that the enriched motifs are highly overlapped between MCF-7 ChIP-seq experiments while those in MDA-MB-231 were extremely similar with that in the other non-breast cell lines. Notably, peaks called in MCF-7 cell lines were significantly enriched in ERα related motifs. Similar results are observed in the comparison of target genes as well. Specifically, genes identified in MCF-7 cell lines were highly redundant, whereas genes identified in MDA-MB-231 cell lines showed greater overlap with those found in non-breast cell lines. Additionally, the cell cycle pathway was highly enriched in FOXM1 target genes identified in MDA-MB-231 and non-breast cell lines, but not in MCF-7. However, the ER non-genomic pathway was significantly enriched in target genes identified in MCF-7 cell lines. Interestingly, ECC-1, an endometrial cell line that is also ER positive cells, shows similar pattern with other non-MCF-7 cell lines in terms of FOXM1 binding, suggesting that the effect of co-factor ERα on FOXM1 binding might be breast tissue-specific.
Based on these results, we suspected that FOXM1 and ERα might exhibit a physical functional interaction in MCF-7 cell lines which is consistent with reports from previous studies [59, 86, 87]. We hypothesized that this interaction alters the binding properties of FOXM1 in MCF-7 cell line and modulates FOXM1-driven transcriptional output. Sanders et al. [59] indicated that the recruitment effects of ERα on FOXM1 binding in ER positive breast cancer cell lines differs in ER negative cell lines. In our study, we demonstrate that the influence of ERα not only causes differences between the two breast cancer cell lines, but also induces differences between ER positive breast cancer cell lines and non-breast cancer cell lines. Moreover, the binding sites of FOXM1 in MDA-MB-231, an ER negative breast cancer cell line, and those in non-breast cell lines showed a high degree of overlap even though they are classified as different tissues. These results suggest that the binding of FOXM1 can be modulated by a co-factor such as ERα, and this interaction lead to significant changes in activated pathways that hold precedence over tissue-specificity.
Lastly, we further tested whether the varied binding affects the overall regulatory activity of FOXM1 in a cell type-specific fashion. In support of our earlier results, we found that the activity of FOXM1 is mainly captured by ERα binding events in MCF-7 cell line which reflects ERα activity. In contrast, the FOXM1 activity inferred using target genes in MDA-MB-231 or non-breast cell lines, is more indicative of cell proliferation. Both inferred activities are significantly predictive of breast cancer prognosis. Nevertheless, the results of multivariate Cox regression model suggested that the activity of FOXM1 in MDA-MB-231 cell line, proliferation activity, still is an independent biomarker in breast cancer sample prognosis (see Supplementary Table 3). While FOXM1 activity in MCF-7 cells is not associated with prognosis after considering clinical variables which is consistent with the result of ER status. Moreover, combining information about the activity of both estrogen receptor and cell proliferation activities results in a gene signature that predicts patient prognosis with high accuracy.
In light of our findings, we were surprised by how the influence of a single co-factor on the binding patterns of a certain TF could induce a completely different binding profile. The co-factor discovery analysis (see Supplementary Table 1) suggests that STAT3 might be a potential co-factor of FOXM1, in line with previous report that the activation of FOXM1 is dependent on STAT3 activity [88]. Because of the diversity and uncertainty of FOXM1 motifs (see Supplementary Figure 4), we considered this analysis as a preliminary exploration to provide further directions.
In view of our analyses, we inferred the binding patterns of FOXM1 in different cell lines based on its physical interactions with different co-factors. In MCF-7 cell lines FOXM1 binding might be mediated by ERα, supporting the following two possible patterns: (1) FOXM1 interacts with ERα and both bind their own motifs, eliciting a cooperative binding pattern, and (2) FOXM1 interacts with ERα but only ERα binds its DNA motif (Figure 6A). Our motif enrichment results (Figure 3A) indicate that FOXM1 binding sites in MCF-7 cells are enriched not only in ER-related motifs but also in cell cycle related motifs. This observation suggests that the cooperative binding (Figure 6A, pattern 1) is the more likely to be the binding pattern of FOXM1 in MCF-7, which is in agreement with the previous study by Sanders et al. [59]. In contrast, in MDA-MB-231 and the non-breast cell lines FOXM1 may have four possible binding patterns (Figure 6B). (1) FOXM1 interacts with another TF x, each binding with its own motif; (2) FOXM1 binds with its motif without interacting with a co-factor. (3) FOXM1 interacts with another TF x, but DNA binding is mediated by FOXM1 motif. (4) FOXM1 interacts with another TF x that binds with its motif. These four binding patterns may co-exist in MCF-7 and non-breast cancer cell lines. When ChIP-seq data for FOXM1 are generated in more cell lines, we may expect to observe in some cell lines that FOXM1 binding events are mainly mediated by the interaction of another TF x with its DNA motif as observed in MCF-7 cells.
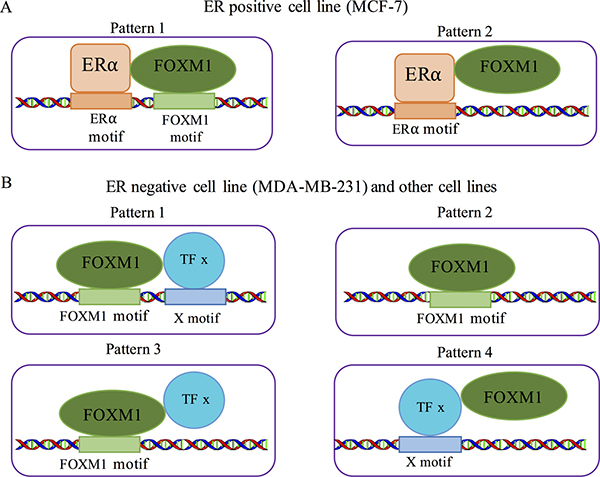
Figure 6: Co-binding patterns for FOXM1 in different cells. (A) Two possible co-binding pattern of ERa and FOXM1 in MCF-7 cell lines. (B) Four possible co-binding patterns in MDA-MB-231 and other non-breast cell lines.
Although the FOXM1 ChIP-seq data were collected from 6 different studies with different FOXM1 antibodies and sequence depths, we achieved consistent results according to the comparisons based on raw signals, binding peaks, motifs and target genes. Our systematic analyses revealed that binding of FOXM1 in MCF-7 cell line differs with MDA-MB-231 and other non-breast cell lines. Moreover, the binding of FOXM1 exhibited highly similarities in cell lines from MDA-MB-231 and six other different tissues. Our results provide new insights into TF binding and suggest that some TFs might not be as affected by tissue type as previously thought. However, there exists some limitations to our methods. First, noise caused by the hybridization process in ChIP-seq experiments[3] may influence the accuracy of our results. Second, the computational nature of our analysis is unable to directly reveal a direct PPI between ERα and FOXM1. However, a previous study by Sander et al. [59] revealed that ERα co-immunoprecipitates with FOXM1 demonstrating that they are able to interact in vitro. In summary, our analysis robustly demonstrated altered FOXM1 binding as a result of ERα activity and provided new insights concerning the binding modes of FOXM1 in different cell types.
MATERIALS AND METHODS
Collection of FOXM1 ChIP-seq experiments
We retrieved 23 FOXM1 ChIP-seq experiments from the NCBI GEO database [51] (Table 1). We downloaded two FOXM1 ChIP-seq experiments performed in ECC-1 cells (endometrium cancer cell line), two ChIP-seq experiments performed in GM12878 cells (blood cancer) and two ChIP-seq experiments performed in SK-N-SH cells (neuroblastoma cancer) from ENCODE using Series accession number GSE32465 [46]. Two FOXM1 ChIP-seq experiments in HEK293 cells (kidney cancer cell line) were acquired using Series accession number GSE60032 [44]. Two FOXM1 ChIP-seq experiments performed in HeLa cells were downloaded under Series accession number GSE52098 [45]. Two FOXM1 ChIP-seq experiments performed in U2OS cells (osteosarcoma cancer cell line) were downloaded under Series accession number GSE38170 [47]. Two FOXM1 ChIP-seq experiments performed in MDA-MB-231 cells (breast cancer cell line) were downloaded with Series accession number GSE40762 [59]. Nine FOXM1 ChIP-seq experiments performed in MCF-7 cells (breast cancer cell line) were downloaded under Series accession numbers GSE32465 [46], GSE72977 [43], and GSE40762 [59]. The antibodies used in GSE60032 and GSE72977 are GTX-102170 and SC-501, respectively. In addition, FOXM1 antibody SC-502 is used in the other experiments.
Breast cancer database
In this study, we downloaded the METABRIC breast cancer dataset [83] to calculate iRAS and perform survival analysis with the accession number EGAS00000000083. This dataset contains gene expression profiles and clinicopathological data for 1,992 breast cancer samples including time-to-event information and ER status.
ChIP-seq reads alignment
After collecting the FOXM1 ChIP-seq experiments, we first used NCBI Sequence Read Archive [89] to align the reads in each experiment. Fastq-dump was applied to convert the raw ChIP-seq experiment profiles to fastq files. We used Bowtie [90] to map reads to the UCSC hg19 human sequence and generated SAM files for each ChIP-seq experiment. We then sorted these SAM files using SAM tools [91] and then generated bedGraph files using BEDtools [92]. The resulting reads for each ChIP-seq experiment were listed in Table 1. The bedGraph files were further used to perform PCA analysis [52] and display specific peaks with Integrative Genomics Viewer [93].
ChIP-seq peak calling and Genomic distribution of binding peaks
Using the generated SAM files, significant peaks were called by MACS2 [56] setting q-value cutoff as 0.01. The number of called peaks for each experiment were shown in Table 1. The peaks overlap coefficients were used to cluster ChIP-seq experiments. The Cis-regulatory Element Annotation System [94] was applied to functionally annotate binding peaks across the genome.
Motif enrichment analysis
In our study, we utilized two high-quality transcription factor binding profile databases, TRANSFAC [53] and JASPAR [54] , to perform the enrichment analysis. We used FIMO [95] to scan peak regions for occurrences of all the 687 motifs contained in the two databases. Second, we refined the called peaks using the summit files generated by MACS [56]. Specifically, for a given peak, we set up a region surrounding its summit (from −250 to 250 of summit). Then, the overlapped district of the peak and this region was considered as the refined peak. To perform the enrichment analysis, we set up two control regions (the same length of the refined peak) for each refined peak. One is upstream of the refined peak and ends at the start position of the refined peak. The other is downstream of the refined peak and starts at the ending position of the refined peak. Third, enrichment score (ES) was calculated and corresponding p value was calculated using Chi-squared test. The function heatmap.2 from the R package “gplots” was used to show the motif enrichment analysis results after log 2 transformation of the ES.
Identification of target genes
We used the TIP algorithm [76] to identify the target genes of FOXM1 for different ChIP-seq experiments (bedGraph files) by assigning each gene a probability of being bound by FOXM1 based on the averaged background binding signal. An FDR threshold of 0.01 was used to identify putative target genes of FOXM1 for each ChIP-seq experiment. The number of target genes identified in each experiment are shown in Table 1 and the specific genes are listed in an additional table (see Supplementary Table 1). Moreover, the average signal of FOXM1 binding in the DNA region surrounding TSS profiles were generated as the output of the TIP algorithm. These profiles were applied to show the FOXM1 binding distribution around gene TSSs (from −3 kb to 3 kb of TSS).
Pathway enrichment analysis
In our study, we used the MSigDB [77] C2 pathway database to perform pathway enrichment analysis. The C2 database integrates 4 independent pathway datasets including REACTOME, PID, BIOCARTA, and KEGG [78–81]. We excluded pathways containing less than 40 target genes and calculated the ES and p-value for all FOXM1 target gene sets using a two-sided hypergeometric test. Clustering analysis of pathway enrichment was performed by log10-transforming the enrichment p-values and assigning a positive value if the corresponding ES was < 1 and a negative value if the ES was > 1. All p-value calculations were performed using the R “Hypergeometric” package and clustering analysis was implemented using the “gplots” package in R.
Calculation of FOXM1 activity
According to the target gene sets identified using our previously TIP algorithm [76], we first merged target genes identified in each cell line into a core set of FOXM1 binding affinity data. Specifically, gj = {g1,j, g2,j, …gi,j, …, gn,j}, where gj is the target gene set for cell line j, gi,j is the ith gene in whole human genome, n is the total number of whole human genome genes. gi,j is 1 suggests that the ith gene is FOXM1 target gene in cell line j, whereas, the ith gene is non-target gene. Integrating breast cancer samples gene expression profiles, we employed BASE [55], a rank-based algorithm, to infer an iRAS for each breast tumor. Briefly, for a given sample S = {s1, s2, …, si, …, sn}, where si is expression level of the ith gene. Basing on the FOXM1 binding affinity data, BASE calculated a cumulative distribution function for both target genes and non-target genes, denoting as T(i) and Non-T(i). The maximum deviation between these two functions infers the similarity score between the binding affinity data and sample gene expression. After 1000 times random permutation, we normalized those scores and got the iRAS which infers the activity of FOXM1 in a specific sample.
Survival analysis
The Kaplan-Meier method was applied to compare survival prognosis of patients in different groups and the log-rank test was used to calculate the p-value. Multivariate cox regression model was used to examine the independent prognostic power of iRAS considering important clinical variables including age, tumor stage, tumor grade, ER status, PR status and HER2 status. The R package “survival” was used to implement survival analysis.
Abbreviations
TF: transcription factor; ERa: estrogen receptor alpha; ER: estrogen receptor; ER+: ER-positive; ER-: ER-negative; ChIP-chip: chromatin immunoprecipitation followed by microarray hybridization; ChIP-seq: chromatin immunoprecipitation followed by high-throughput DNA sequencing; ENCODE: Encyclopedia of DNA Elements; GEO: Gene Expression Omnibus; PCA: principle component analysis; BASE: Binding Association with Sorted Expression; MACS: Model-based Analysis of ChIP-Seq; TSS: transcription start sites; MSigDB: Molecular Signatures database; iRAS: individual Regulatory Activity Score; ES: enrichment score.
Author contributions
C.C and W.C designed the study. Y.W and C.C collected the ChIP-seq and breast cancer dataset. Y.W and T.X analyzed the ChIP-seq data. Y.W. and M.U prepared all the figures. Y.W., M.U. and C.C. wrote the manuscript. All authors read and approved the final manuscript.
ACKNOWLEDGMENTS AND FUNDING
This work was supported by the American Cancer Society Research Grant IRG-82-003-30 (to CC), the NIH Centers of Biomedical Research Excellence (COBRE) grant GM103534 (to CC) and the Dartmouth Clinical and Translational Science Institute, under award number UL1TR001086 (to CC) and KL2TR001088 (to CC) from the National Center for Advancing Translational Sciences, and Dartmouth College Norris Cotton Cancer Center Support Grant P30CA023108 (to CC).
CONFLICTS OF INTEREST
The authors declare that they have no competing interests.
REFERENCES
1. Robertson G, Hirst M, Bainbridge M, Bilenky M, Zhao Y, Zeng T, Euskirchen G, Bernier B, Varhol R, Delaney A, Thiessen N, Griffith OL, He A, et al. Genome-wide profiles of STAT1 DNA association using chromatin immunoprecipitation and massively parallel sequencing. Nat Methods. 2007; 4:651–7. https://doi.org/10.1038/nmeth1068.
2. Buck MJ, Lieb JD. ChIP-chip: considerations for the design, analysis, and application of genome-wide chromatin immunoprecipitation experiments. Genomics. 2004; 83:349–60.
3. Park PJ. ChIP-seq: advantages and challenges of a maturing technology. Nat Rev Genet. 2009; 10:669–80. https://doi.org/10.1038/nrg2641.
4. Johnson DS, Mortazavi A, Myers RM, Wold B. Genome-wide mapping of in vivo protein-DNA interactions. Science. 2007; 316:1497–502. https://doi.org/10.1126/science.1141319.
5. Sandmann T, Jakobsen JS, Furlong EE. ChIP-on-chip protocol for genome-wide analysis of transcription factor binding in Drosophila melanogaster embryos. Nat Protoc. 2006; 1:2839–55. https://doi.org/10.1038/nprot.2006.383.
6. Smith AD, Sumazin P, Das D, Zhang MQ. Mining ChIP-chip data for transcription factor and cofactor binding sites. Bioinformatics. 2005; 21:i403–12. https://doi.org/10.1093/bioinformatics/bti1043.
7. Schmidt D, Wilson MD, Ballester B, Schwalie PC, Brown GD, Marshall A, Kutter C, Watt S, Martinez-Jimenez CP, Mackay S, Talianidis I, Flicek P, Odom DT. Five-vertebrate ChIP-seq reveals the evolutionary dynamics of transcription factor binding. Science. 2010; 328:1036–40. https://doi.org/10.1126/science.1186176.
8. Harbison CT, Gordon DB, Lee TI, Rinaldi NJ, Macisaac KD, Danford TW, Hannett NM, Tagne JB, Reynolds DB, Yoo J, Jennings EG, Zeitlinger J, Pokholok DK, et al. Transcriptional regulatory code of a eukaryotic genome. Nature. 2004; 431:99–104. https://doi.org/10.1038/nature02800.
9. Meader S, Ponting CP, Lunter G. Massive turnover of functional sequence in human and other mammalian genomes. Genome Res. 2010; 20:1335–43. https://doi.org/10.1101/gr.108795.110.
10. Bradley RK, Li XY, Trapnell C, Davidson S, Pachter L, Chu HC, Tonkin LA, Biggin MD, Eisen MB. Binding site turnover produces pervasive quantitative changes in transcription factor binding between closely related Drosophila species. PLoS Biol. 2010; 8:e1000343. https://doi.org/10.1371/journal.pbio.1000343.
11. Borneman AR, Gianoulis TA, Zhang ZD, Yu H, Rozowsky J, Seringhaus MR, Wang LY, Gerstein M, Snyder M. Divergence of transcription factor binding sites across related yeast species. Science. 2007; 317:815–9. https://doi.org/10.1126/science.1140748.
12. Doniger SW, Fay JC. Frequent gain and loss of functional transcription factor binding sites. PLoS Comput Biol. 2007; 3:e99. https://doi.org/10.1371/journal.pcbi.0030099.
13. Odom DT, Dowell RD, Jacobsen ES, Gordon W, Danford TW, MacIsaac KD, Rolfe PA, Conboy CM, Gifford DK, Fraenkel E. Tissue-specific transcriptional regulation has diverged significantly between human and mouse. Nat Genet. 2007; 39:730–2. https://doi.org/10.1038/ng2047.
14. Moses AM, Pollard DA, Nix DA, Iyer VN, Li XY, Biggin MD, Eisen MB. Large-scale turnover of functional transcription factor binding sites in Drosophila. PLoS Comput Biol. 2006; 2:e130. https://doi.org/10.1371/journal.pcbi.0020130.
15. Gasch AP, Moses AM, Chiang DY, Fraser HB, Berardini M, Eisen MB. Conservation and evolution of cis-regulatory systems in ascomycete fungi. PLoS Biol. 2004; 2:e398. https://doi.org/10.1371/journal.pbio.0020398.
16. Kellis M, Birren BW, Lander ES. Proof and evolutionary analysis of ancient genome duplication in the yeast Saccharomyces cerevisiae. Nature. 2004; 428:617–24. https://doi.org/10.1038/nature02424.
17. Tuch BB, Galgoczy DJ, Hernday AD, Li H, Johnson AD. The evolution of combinatorial gene regulation in fungi. PLoS Biol. 2008; 6:e38. https://doi.org/10.1371/journal.pbio.0060038.
18. Wang H, Maurano MT, Qu H, Varley KE, Gertz J, Pauli F, Lee K, Canfield T, Weaver M, Sandstrom R, Thurman RE, Kaul R, Myers RM, et al. Widespread plasticity in CTCF occupancy linked to DNA methylation. Genome Res. 2012; 22:1680–8. https://doi.org/10.1101/gr.136101.111.
19. Rockowitz S, Lien WH, Pedrosa E, Wei G, Lin M, Zhao K, Lachman HM, Fuchs E, Zheng D. Comparison of REST cistromes across human cell types reveals common and context-specific functions. PLoS Comput Biol. 2014; 10:e1003671. https://doi.org/10.1371/journal.pcbi.1003671.
20. Shyamsundar R, Kim YH, Higgins JP, Montgomery K, Jorden M, Sethuraman A, van de Rijn M, Botstein D, Brown PO, Pollack JR. A DNA microarray survey of gene expression in normal human tissues. Genome Biol. 2005; 6:R22. https://doi.org/10.1186/gb-2005-6-3-r22.
21. Su AI, Cooke MP, Ching KA, Hakak Y, Walker JR, Wiltshire T, Orth AP, Vega RG, Sapinoso LM, Moqrich A, Patapoutian A, Hampton GM, Schultz PG, et al. Large-scale analysis of the human and mouse transcriptomes. Proc Natl Acad Sci U S A. 2002; 99:4465–70. https://doi.org/10.1073/pnas.012025199.
22. Varley KE, Gertz J, Bowling KM, Parker SL, Reddy TE, Pauli-Behn F, Cross MK, Williams BA, Stamatoyannopoulos JA, Crawford GE, Absher DM, Wold BJ, Myers RM. Dynamic DNA methylation across diverse human cell lines and tissues. Genome Res. 2013; 23:555–67. https://doi.org/10.1101/gr.147942.112.
23. Paz MF, Fraga MF, Avila S, Guo M, Pollan M, Herman JG, Esteller M. A systematic profile of DNA methylation in human cancer cell lines. Cancer Res. 2003; 63:1114–21.
24. He HH, Meyer CA, Chen MW, Jordan VC, Brown M, Liu XS. Differential DNase I hypersensitivity reveals factor-dependent chromatin dynamics. Genome Res. 2012; 22:1015–25. https://doi.org/10.1101/gr.133280.111.
25. Degner JF, Pai AA, Pique-Regi R, Veyrieras JB, Gaffney DJ, Pickrell JK, De Leon S, Michelini K, Lewellen N, Crawford GE, Stephens M, Gilad Y, Pritchard JK. DNase I sensitivity QTLs are a major determinant of human expression variation. Nature. 2012; 482:390–4. https://doi.org/10.1038/nature10808.
26. Ernst J, Kheradpour P, Mikkelsen TS, Shoresh N, Ward LD, Epstein CB, Zhang X, Wang L, Issner R, Coyne M, Ku M, Durham T, Kellis M, et al. Mapping and analysis of chromatin state dynamics in nine human cell types. Nature. 2011; 473:43–9. https://doi.org/10.1038/nature09906.
27. Heintzman ND, Hon GC, Hawkins RD, Kheradpour P, Stark A, Harp LF, Ye Z, Lee LK, Stuart RK, Ching CW, Ching KA, Antosiewicz-Bourget JE, Liu H, et al. Histone modifications at human enhancers reflect global cell-type-specific gene expression. Nature. 2009; 459:108–12. https://doi.org/10.1038/nature07829.
28. Zhong S, He X, Bar-Joseph Z. Predicting tissue specific transcription factor binding sites. BMC Genomics. 2013; 14:796. https://doi.org/10.1186/1471-2164-14-796.
29. Neph S, Stergachis AB, Reynolds A, Sandstrom R, Borenstein E, Stamatoyannopoulos JA. Circuitry and dynamics of human transcription factor regulatory networks. Cell. 2012; 150:1274–86. https://doi.org/10.1016/j.cell.2012.04.040.
30. Cuellar-Partida G, Buske FA, McLeay RC, Whitington T, Noble WS, Bailey TL. Epigenetic priors for identifying active transcription factor binding sites. Bioinformatics. 2012; 28:56–62. https://doi.org/10.1093/bioinformatics/btr614.
31. Pique-Regi R, Degner JF, Pai AA, Gaffney DJ, Gilad Y, Pritchard JK. Accurate inference of transcription factor binding from DNA sequence and chromatin accessibility data. Genome Res. 2011; 21:447–55. https://doi.org/10.1101/gr.112623.110.
32. Ernst J, Plasterer HL, Simon I, Bar-Joseph Z. Integrating multiple evidence sources to predict transcription factor binding in the human genome. Genome Res. 2010; 20:526–36. https://doi.org/10.1101/gr.096305.109.
33. The ENCODE Project Consortium. The ENCODE (ENCyclopedia Of DNA Elements) Project. Science. 2004; 306:636–40. https://doi.org/10.1126/science.1105136.
34. Sheffield NC, Thurman RE, Song L, Safi A, Stamatoyannopoulos JA, Lenhard B, Crawford GE, Furey TS. Patterns of regulatory activity across diverse human cell types predict tissue identity, transcription factor binding, and long-range interactions. Genome Res. 2013; 23:777–88. https://doi.org/10.1101/gr.152140.112.
35. Thurman RE, Rynes E, Humbert R, Vierstra J, Maurano MT, Haugen E, Sheffield NC, Stergachis AB, Wang H, Vernot B, Garg K, John S, Sandstrom R, et al. The accessible chromatin landscape of the human genome. Nature. 2012; 489:75–82. https://doi.org/10.1038/nature11232.
36. Alvarez-Fernandez M, Halim VA, Krenning L, Aprelia M, Mohammed S, Heck AJ, Medema RH. Recovery from a DNA-damage-induced G2 arrest requires Cdk-dependent activation of FoxM1. EMBO Rep. 2010; 11:452–8. https://doi.org/10.1038/embor.2010.46.
37. Whitfield ML, Sherlock G, Saldanha AJ, Murray JI, Ball CA, Alexander KE, Matese JC, Perou CM, Hurt MM, Brown PO, Botstein D. Identification of genes periodically expressed in the human cell cycle and their expression in tumors. Mol Biol Cell. 2002; 13:1977–2000. https://doi.org/10.1091/mbc.02-02-0030.
38. Chan DW, Yu SY, Chiu PM, Yao KM, Liu VW, Cheung AN, Ngan HY. Over-expression of FOXM1 transcription factor is associated with cervical cancer progression and pathogenesis. J Pathol. 2008; 215:245–52. https://doi.org/10.1002/path.2355.
39. Kim IM, Ackerson T, Ramakrishna S, Tretiakova M, Wang IC, Kalin TV, Major ML, Gusarova GA, Yoder HM, Costa RH, Kalinichenko VV. The Forkhead Box m1 transcription factor stimulates the proliferation of tumor cells during development of lung cancer. Cancer Res. 2006; 66:2153–61. https://doi.org/10.1158/0008-5472.CAN-05-3003.
40. Wonsey DR, Follettie MT. Loss of the forkhead transcription factor FoxM1 causes centrosome amplification and mitotic catastrophe. Cancer Res. 2005; 65:5181–9. https://doi.org/10.1158/0008-5472.CAN-04-4059.
41. Kalinichenko VV, Major ML, Wang X, Petrovic V, Kuechle J, Yoder HM, Dennewitz MB, Shin B, Datta A, Raychaudhuri P, Costa RH. Foxm1b transcription factor is essential for development of hepatocellular carcinomas and is negatively regulated by the p19ARF tumor suppressor. Genes Dev. 2004; 18:830–50. https://doi.org/10.1101/gad.1200704.
42. Wohrle D, Kotzot D, Hirst MC, Manca A, Korn B, Schmidt A, Barbi G, Rott HD, Poustka A, Davies KE, Steinbach P. A microdeletion of less than 250 kb, including the proximal part of the FMR-I gene and the fragile-X site, in a male with the clinical phenotype of fragile-X syndrome. Am J Hum Genet. 1992; 51:299–306.
43. Yau C, Meyer L, Benz S, Vaske C, Scott G, Egan B, Labhart P, Pourmand N, Benz CC. FOXM1 cistrome predicts breast cancer metastatic outcome better than FOXM1 expression levels or tumor proliferation index. Breast Cancer Res Treat. 2015; 154:23–32. https://doi.org/10.1007/s10549-015-3589-7.
44. Sanders DA, Gormally MV, Marsico G, Beraldi D, Tannahill D, Balasubramanian S. FOXM1 binds directly to non-consensus sequences in the human genome. Genome Biol. 2015; 16:130. https://doi.org/10.1186/s13059-015-0696-z.
45. Grant GD, Brooks L 3rd, Zhang X, Mahoney JM, Martyanov V, Wood TA, Sherlock G, Cheng C, Whitfield ML. Identification of cell cycle-regulated genes periodically expressed in U2OS cells and their regulation by FOXM, E2F transcription factors. Mol Biol Cell. 2013; 24:3634–50. https://doi.org/10.1091/mbc.E13-05-0264.
46. Gertz J, Savic D, Varley KE, Partridge EC, Safi A, Jain P, Cooper GM, Reddy TE, Crawford GE, Myers RM. Distinct properties of cell-type-specific and shared transcription factor binding sites. Mol Cell. 2013; 52:25–36. https://doi.org/10.1016/j.molcel.2013.08.037.
47. Chen X, Muller GA, Quaas M, Fischer M, Han N, Stutchbury B, Sharrocks AD, Engeland K. The forkhead transcription factor FOXM1 controls cell cycle-dependent gene expression through an atypical chromatin binding mechanism. Mol Cell Biol. 2013; 33:227–36. https://doi.org/10.1128/MCB.00881-12.
48. Maekawa A, Kohashi K, Kuda M, Iura K, Ishii T, Endo M, Nakatsura T, Iwamoto Y, Oda Y. Prognostic significance of FOXM1 expression and antitumor effect of FOXM1 inhibition in synovial sarcomas. BMC Cancer. 2016; 16:511. https://doi.org/10.1186/s12885-016-2542-4.
49. Sun Q, Dong M, Chen Y, Zhang J, Qiao J, Guo X. Prognostic significance of FoxM1 expression in non-small cell lung cancer. J Thorac Dis. 2016; 8:1269–73. https://doi.org/10.21037/jtd.2016.04.13.
50. Takata A, Takiguchi S, Okada K, Takahashi T, Kurokawa Y, Yamasaki M, Miyata H, Nakajima K, Mori M, Doki Y. Clinicopathological and prognostic significance of FOXM1 expression in esophageal squamous cell carcinoma. Anticancer Res. 2014; 34:2427–32.
51. Barrett T, Wilhite SE, Ledoux P, Evangelista C, Kim IF, Tomashevsky M, Marshall KA, Phillippy KH, Sherman PM, Holko M, Yefanov A, Lee H, Zhang N, et al. NCBI GEO: archive for functional genomics data sets—update. Nucleic Acids Res. 2013; 41:D991–5. https://doi.org/10.1093/nar/gks1193.
52. Ringner M. What is principal component analysis? Nat Biotechnol. 2008; 26:303–4. https://doi.org/10.1038/nbt0308-303.
53. Wingender E, Dietze P, Karas H, Knuppel R. TRANSFAC: a database on transcription factors and their DNA binding sites. Nucleic Acids Res. 1996; 24:238–41.
54. Mathelier A, Zhao X, Zhang AW, Parcy F, Worsley-Hunt R, Arenillas DJ, Buchman S, Chen CY, Chou A, Ienasescu H, Lim J, Shyr C, Tan G, et al. JASPAR 2014: an extensively expanded and updated open-access database of transcription factor binding profiles. Nucleic Acids Res. 2014; 42:D142-7. https://doi.org/10.1093/nar/gkt997.
55. Cheng C, Yan X, Sun F, Li LM. Inferring activity changes of transcription factors by binding association with sorted expression profiles. BMC Bioinformatics. 2007; 8:452. https://doi.org/10.1186/1471-2105-8-452.
56. Zhang Y, Liu T, Meyer CA, Eeckhoute J, Johnson DS, Bernstein BE, Nusbaum C, Myers RM, Brown M, Li W, Liu XS. Model-based analysis of ChIP-Seq (MACS). Genome Biol. 2008; 9:R137. https://doi.org/10.1186/gb-2008-9-9-r137.
57. Laoukili J, Kooistra MR, Bras A, Kauw J, Kerkhoven RM, Morrison A, Clevers H, Medema RH. FoxM1 is required for execution of the mitotic programme and chromosome stability. Nat Cell Biol. 2005; 7:126–36. https://doi.org/10.1038/ncb1217.
58. Dusetti NJ, Jiang Y, Vaccaro MI, Tomasini R, Azizi Samir A, Calvo EL, Ropolo A, Fiedler F, Mallo GV, Dagorn JC, Iovanna JL. Cloning and expression of the rat vacuole membrane protein 1 (VMP1), a new gene activated in pancreas with acute pancreatitis, which promotes vacuole formation. Biochem Biophys Res Commun. 2002; 290:641–9. https://doi.org/10.1006/bbrc.2001.6244.
59. Sanders DA, Ross-Innes CS, Beraldi D, Carroll JS, Balasubramanian S. Genome-wide mapping of FOXM1 binding reveals co-binding with estrogen receptor alpha in breast cancer cells. Genome Biol. 2013; 14:R6. https://doi.org/10.1186/gb-2013-14-1-r6.
60. Klinge CM, Jernigan SC, Mattingly KA, Risinger KE, Zhang J. Estrogen response element-dependent regulation of transcriptional activation of estrogen receptors alpha and beta by coactivators and corepressors. J Mol Endocrinol. 2004; 33:387–410. https://doi.org/10.1677/jme.1.01541.
61. Sadasivam S, Duan S, DeCaprio JA. The MuvB complex sequentially recruits B-Myb and FoxM1 to promote mitotic gene expression. Genes Dev. 2012; 26:474–89. https://doi.org/10.1101/gad.181933.111.
62. Joseph R, Orlov YL, Huss M, Sun W, Kong SL, Ukil L, Pan YF, Li G, Lim M, Thomsen JS, Ruan Y, Clarke ND, Prabhakar S, et al. Integrative model of genomic factors for determining binding site selection by estrogen receptor-alpha. Mol Syst Biol. 2010; 6:456. https://doi.org/10.1038/msb.2010.109.
63. Zona S, Bella L, Burton MJ, Nestal de Moraes G, Lam EW. FOXM1: an emerging master regulator of DNA damage response and genotoxic agent resistance. Biochim Biophys Acta. 2014; 1839:1316–22. https://doi.org/10.1016/j.bbagrm.2014.09.016.
64. Bertoli C, Skotheim JM, de Bruin RA. Control of cell cycle transcription during G, S phases. Nat Rev Mol Cell Biol. 2013; 14:518–28. https://doi.org/10.1038/nrm3629.
65. Manavathi B, Samanthapudi VS, Gajulapalli VN. Estrogen receptor coregulators and pioneer factors: the orchestrators of mammary gland cell fate and development. Front Cell Dev Biol. 2014; 2:34. https://doi.org/10.3389/fcell.2014.00034.
66. Li Z, Tuteja G, Schug J, Kaestner KH. Foxa1 and Foxa2 are essential for sexual dimorphism in liver cancer. Cell. 2012; 148:72–83. https://doi.org/10.1016/j.cell.2011.11.026.
67. Hurtado A, Holmes KA, Ross-Innes CS, Schmidt D, Carroll JS. FOXA1 is a key determinant of estrogen receptor function and endocrine response. Nat Genet. 2011; 43:27–33. https://doi.org/10.1038/ng.730.
68. Iwamoto T, Booser D, Valero V, Murray JL, Koenig K, Esteva FJ, Ueno NT, Zhang J, Shi W, Qi Y, Matsuoka J, Yang EJ, Hortobagyi GN, et al. Estrogen receptor (ER) mRNA, ER-related gene expression in breast cancers that are 1% to 10% ER-positive by immunohistochemistry. J Clin Oncol. 2012; 30:729–34. https://doi.org/10.1200/JCO.2011.36.2574.
69. Giguere V, Yang N, Segui P, Evans RM. Identification of a new class of steroid hormone receptors. Nature. 1988; 331:91–4. https://doi.org/10.1038/331091a0.
70. Sarachana T, Hu VW. Genome-wide identification of transcriptional targets of RORA reveals direct regulation of multiple genes associated with autism spectrum disorder. Mol Autism. 2013; 4:14. https://doi.org/10.1186/2040-2392-4-14.
71. Bonofiglio D, Gabriele S, Aquila S, Catalano S, Gentile M, Middea E, Giordano F, Ando S. Estrogen receptor alpha binds to peroxisome proliferator-activated receptor response element and negatively interferes with peroxisome proliferator-activated receptor gamma signaling in breast cancer cells. Clin Cancer Res. 2005; 11:6139–47. https://doi.org/10.1158/1078-0432.CCR-04-2453.
72. Yusuf D, Butland SL, Swanson MI, Bolotin E, Ticoll A, Cheung WA, Zhang XY, Dickman CT, Fulton DL, Lim JS, Schnabl JM, Ramos OH, Vasseur-Cognet M, et al. The transcription factor encyclopedia. Genome Biol. 2012; 13:R24. https://doi.org/10.1186/gb-2012-13-3-r24.
73. Whitington T, Frith MC, Johnson J, Bailey TL. Inferring transcription factor complexes from ChIP-seq data. Nucleic Acids Res. 2011; 39:e98. https://doi.org/10.1093/nar/gkr341.
74. Kulakovskiy IV, Vorontsov IE, Yevshin IS, Soboleva AV, Kasianov AS, Ashoor H, Ba-Alawi W, Bajic VB, Medvedeva YA, Kolpakov FA, Makeev VJ. HOCOMOCO: expansion and enhancement of the collection of transcription factor binding sites models. Nucleic Acids Res. 2016; 44:D116-25. https://doi.org/10.1093/nar/gkv1249.
75. Levy DE, Lee CK. What does Stat3 do? J Clin Invest. 2002; 109:1143–8. https://doi.org/10.1172/JCI15650.
76. Cheng C, Min R, Gerstein M. TIP: a probabilistic method for identifying transcription factor target genes from ChIP-seq binding profiles. Bioinformatics. 2011; 27:3221–7. https://doi.org/10.1093/bioinformatics/btr552.
77. Liberzon A, Subramanian A, Pinchback R, Thorvaldsdottir H, Tamayo P, Mesirov JP. Molecular signatures database (MSigDB) 3.0. Bioinformatics. 2011; 27:1739–40. https://doi.org/10.1093/bioinformatics/btr260.
78. Kanehisa M, Goto S. KEGG: kyoto encyclopedia of genes and genomes. Nucleic Acids Res. 2000; 28:27–30.
79. Croft D, Mundo AF, Haw R, Milacic M, Weiser J, Wu G, Caudy M, Garapati P, Gillespie M, Kamdar MR, Jassal B, Jupe S, Matthews L, et al. The Reactome pathway knowledgebase. Nucleic Acids Res. 2014; 42:D472-7. https://doi.org/10.1093/nar/gkt1102.
80. Schaefer CF, Anthony K, Krupa S, Buchoff J, Day M, Hannay T, Buetow KH. PID: the Pathway Interaction Database. Nucleic Acids Res. 2009; 37:D674–9. https://doi.org/10.1093/nar/gkn653.
81. Nishimura D. BioCarta. Biotech Software & Internet Report. 2004; 2:117–20. https://doi.org/10.1089/152791601750294344.
82. Wang IC, Chen YJ, Hughes D, Petrovic V, Major ML, Park HJ, Tan Y, Ackerson T, Costa RH. Forkhead box M1 regulates the transcriptional network of genes essential for mitotic progression and genes encoding the SCF (Skp2-Cks1) ubiquitin ligase. Mol Cell Biol. 2005; 25:10875–94. https://doi.org/10.1128/MCB.25.24.10875-10894.2005.
83. Curtis C, Shah SP, Chin SF, Turashvili G, Rueda OM, Dunning MJ, Speed D, Lynch AG, Samarajiwa S, Yuan Y, Graf S, Ha G, Haffari G, et al. The genomic and transcriptomic architecture of 2,000 breast tumours reveals novel subgroups. Nature. 2012; 486:346–52. https://doi.org/10.1038/nature10983.
84. Khaleel SS, Andrews EH, Ung M, DiRenzo J, Cheng C. E2F4 regulatory program predicts patient survival prognosis in breast cancer. Breast Cancer Res. 2014; 16:486. https://doi.org/10.1186/s13058-014-0486-7.
85. Costa RH. FoxM1 dances with mitosis. Nat Cell Biol. 2005; 7:108–10. https://doi.org/10.1038/ncb0205-108.
86. Millour J, Constantinidou D, Stavropoulou AV, Wilson MS, Myatt SS, Kwok JM, Sivanandan K, Coombes RC, Medema RH, Hartman J, Lykkesfeldt AE, Lam EW. FOXM1 is a transcriptional target of ERalpha and has a critical role in breast cancer endocrine sensitivity and resistance. Oncogene. 2010; 29:2983–95. https://doi.org/10.1038/onc.2010.47.
87. Madureira PA, Varshochi R, Constantinidou D, Francis RE, Coombes RC, Yao KM, Lam EW. The Forkhead box M1 protein regulates the transcription of the estrogen receptor alpha in breast cancer cells. J Biol Chem. 2006; 281:25167–76. https://doi.org/10.1074/jbc.M603906200.
88. Mencalha AL, Binato R, Ferreira GM, Du Rocher B, Abdelhay E. Forkhead box M1 (FoxM1) gene is a new STAT3 transcriptional factor target and is essential for proliferation, survival and DNA repair of K562 cell line. PLoS One. 2012; 7:e48160. https://doi.org/10.1371/journal.pone.0048160.
89. Leinonen R, Sugawara H, Shumway M, International Nucleotide Sequence Database Collaboration. The sequence read archive. Nucleic Acids Res. 2011; 39:D19–21. https://doi.org/10.1093/nar/gkq1019.
90. Langmead B, Trapnell C, Pop M, Salzberg SL. Ultrafast and memory-efficient alignment of short DNA sequences to the human genome. Genome Biol. 2009; 10:R25. https://doi.org/10.1186/gb-2009-10-3-r25.
91. Li H, Handsaker B, Wysoker A, Fennell T, Ruan J, Homer N, Marth G, Abecasis G, Durbin R, 1000 Genome Project Data Processing Subgroup. The Sequence Alignment/Map format and SAMtools. Bioinformatics. 2009; 25:2078–9. https://doi.org/10.1093/bioinformatics/btp352.
92. Quinlan AR, Hall IM. BEDTools: a flexible suite of utilities for comparing genomic features. Bioinformatics. 2010; 26:841–2. https://doi.org/10.1093/bioinformatics/btq033.
93. Thorvaldsdottir H, Robinson JT, Mesirov JP. Integrative Genomics Viewer (IGV): high-performance genomics data visualization and exploration. Brief Bioinform. 2013; 14:178–92. https://doi.org/10.1093/bib/bbs017.
94. Shin H, Liu T, Manrai AK, Liu XS. CEAS: cis-regulatory element annotation system. Bioinformatics. 2009; 25:2605–6. https://doi.org/10.1093/bioinformatics/btp479.
95. Grant CE, Bailey TL, Noble WS. FIMO: scanning for occurrences of a given motif. Bioinformatics. 2011; 27:1017–8. https://doi.org/10.1093/bioinformatics/btr064.