
INTRODUCTION
In 2017 an estimated 53,670 people in the US will be diagnosed with pancreatic cancer (PC), and 43,090 people will die from it [1]. These numbers underscore high disease-associated mortality. PC represents 90% of pancreatic neoplasms and is likely to become the second most deadly cancer by 2020 [2–4]. The majority of patients present with incurable disease, and the median survival for advanced or metastatic PC is less than 5% at 5 years [5]. While known risk factors include age, chronic pancreatitis, and Type 2 diabetes mellitus (T2DM), the disease, for the most part, progresses indolently. Additionally, several epidemiological variables, such as tobacco smoking and obesity, have been deemed to increase risk, however these are not specific to PC and hence cannot be used to define a high risk population for PC screening [6–8]. The only approved serum PC biomarker, CA19-9, is nonspecific and only elevated in advanced disease and hence has no role as a standalone marker [9], or for detection of early disease. Thus, there is a critical need to develop diagnostic and prognostic biomarkers with potential clinical utility. Despite extensive efforts towards development of biomarkers for PC [10–31], there is a paucity of a validated biomarker panel that is specific for PC [32–34].
Metabolomics methodology aims to identify and estimate the relative changes in the abundance of endogenous metabolites in health and disease, thus supporting the identification of biomarkers and potential targets for the development of new therapeutics [35–37]. Given the role of the pancreas as a major metabolic organ, it is reasonable to assume that the identification, characterization and validation of novel disease stratification criteria based on metabolic profiles offers a strategic advantage for PC research [38–47]. Although a number of independent groups have reported on blood based metabolomics biomarkers of PC, the lack of cross-validation limits the clinical utility of these putative biosignatures.
This study was designed to address two existing challenges in the field of biomarker research for PC. Firstly, a majority of PC patients report glucose intolerance or T2DM [48, 49]. The majority of the published PC biomarker studies, however, have not used a diabetic cohort to identify shared pathway dysregulations that would help obviate non-specific biomarkers upfront. Secondly, certain oncogenic processes, like inflammation, cachexia and oxidative stress, accompany most malignancies. However, most cancer biomarker studies, rely on a case-control study design that does not account for these confounders [50]. Thus, in the absence of cancer disease control cohorts, it is difficult to select biomarkers that are specific for a given cancer type, much less in advance of disease diagnosis or in defining risk of developing the specific neoplasm. As such, determination of predictive value of a biomarker panel without ascertaining disease specificity and cross-validation, is likely to impact subsequent clinical implementation.
Herein, we report a novel experimental evaluation of putative metabolite biomarkers for PC that were curated from an exhaustive literature survey. We used targeted mass spectrometry for relative quantification of common blood based metabolite markers of PC, found to overlap in independently conducted studies. Next, we evaluated the performance of this group of metabolites in control cohorts, including a colorectal cancer cohort (CRC) that was used as a cancer control cohort, and T2DM which was used as a non-cancer disease control cohort. Although, the constructed 10 metabolite panel provided a high accuracy classifier for delineating PC patients from NC (AUC = 0.99), the AUCs still remained high when NCs were compared to the CRC cohort, thus diminishing the specificity of this panel for PC. Interestingly, the overlap of dysregulated metabolites between the PC and T2DM cohorts was lower than that observed for PC vs CRC cohorts. Taken together, our results emphasize the need for a more rigorous prospective study design that may help eliminate non-specific metabolite markers upfront, thereby augmenting the development of classifiers with high specificity for a particular malignancy. The approach described here is broadly applicable for cancer biomarker studies.
RESULTS
Literature mining for delineating biomarkers of PC
Since there is no central biomarker repository that can be accessed for metabolite biomarker evaluation of PC, our first goal was to perform an exhaustive literature search to create a compendium of metabolite biomarkers of PC [14]. While there are a large number of reported studies for PC biomarkers (a keyword search for “pancreatic cancer and biomarkers” in PUBMED returns > 9500 published articles); narrowing the search with specific keywords such as “metabolomics and pancreatic cancer biomarkers”, returned approximately 44 hits on PUBMED. We also looked in data repositories such as EDRN and GDOC for a compendium of PC biomarkers, but we did not find any datasets, emphasizing that the application of metabolomics for PC biomarker research is relatively new. Furthermore, bulk of PC biomarkers studies using a metabolomics approach were published in years 2010 to 2016, underscoring the emerging nature of this field of research.
Following literature search, biomarkers were stratified based on the type of matrix used for biomarker discovery (ex. tissue, saliva, cell lines, blood or urine). We focused on blood based metabolite markers for meta-analysis (Table 1 and Supplementary Table 1), while all non-blood based studies, such as tissue, urine, and saliva, were consolidated separately (Supplementary Table 2). All blood based metabolite markers that overlapped in two or more studies were deemed significant for further evaluation and were compiled along with the comparative groups and direction of regulation as reported (Table 1). Approximately 56 metabolite markers that were found to be significantly dysregulated in blood samples obtained from “at-diagnosis” PC patients as compared to normal controls, uniquely reported by one research group, are listed in Supplementary Table 1. In addition, studies that used high risk cohorts (such as benign pancreatic conditions and chronic pancreatitis) as a reference group for delineating PC biomarkers are detailed in Supplementary Table 1 showing some overlap with those listed in Table 1.
Table 1: Compendium of blood based metabolite markers that overlapped between independently conducted case- control biomarkers studies of PC
Biomarker |
Comparison Groups |
Instrument |
Matrix |
Reference |
|---|---|---|---|---|
1,5-anhydro-d-glucitol↓b |
PC (n = 200) vs NC (n =200) |
LC–TOFMS, GC–TOFMS |
plasma |
[82] |
PC (n = 43) vs NC (n =42) |
GC/MS |
serum |
[65] |
|
3-hydroxybutyrate↓ |
PC (n = 17) vs NC (n =23) |
1H NMR |
Serum |
[38] |
PC (n = 19) vs NC (n =20)c |
H-NMR |
Blood/plasma |
[64] |
|
Alanine ↓ |
PC (n = 19) vs NC (n =20)c |
H-NMR |
Blood/plasma |
[64] |
PC (n = 360) vs NC (n =8372)c |
HPLC-ESI-MS |
plasma |
[63] |
|
Asparaginea |
PC (n = 43) vs NC (n =42) |
GC/MS |
Serum |
[65] |
PC (n = 20) vs NC (n =9) |
GC/MS |
Serum |
[66] |
|
PC (n = 360) vs NC (n =8372)c |
HPLC-ESI-MS |
plasma |
[63] |
|
CA19-9 ↑ b |
PC (n = 84) vs NC (n =99) |
tandem mass spectrometry |
Serum |
[83] |
PC (n = 50) vs NC (n =50)c |
ELISA |
serum |
[84] |
|
Cholinea |
PC (n = 14) vs NC (n =14) |
1H NMR, TOCSY, HMQC or HSQC |
serum |
[85] |
PC (n = 200) vs NC (n =200) |
LC–TOFMS and GC–TOFMS |
plasma |
[82] |
|
Glutamatea |
PC (n = 19) vs NC (n =20)c |
H-NMR |
Blood/plasma |
[64] |
PC (n = 200) vs NC (n =200) |
LC–TOFMS and GC–TOFMS |
plasma |
[82] |
|
Glutamine ↓ |
PC (n = 5) vs NC (n = 2)c |
HILIC-LC/MS RP-LC/MS |
plasma |
[86] |
PC (n = 19) vs NC (n =20)c |
H-NMR |
Blood/plasma |
[64] |
|
PC (n = 43) vs NC (n =42) |
GC/MS |
Serum |
[65] |
|
Histidine ↓ |
PC (n = 19) vs NC (n =20)c |
H-NMR |
Blood/plasma |
[64] |
PC (n = 43) vs NC (n =42) |
GC/MS |
Serum |
[65] |
|
PC (n = 360) vs NC (n =8372)c |
HPLC-ESI-MS |
plasma |
[63] |
|
Isoleucine ↑ |
PC (n = 17) vs NC (n =23) |
1H NMR |
Serum |
[38] |
PC (n = 19) vs NC (n =20)c |
H-NMR |
Blood/plasma |
[64] |
|
Lactatea |
PC (n = 17) vs NC (n =23) |
1H NMR |
Serum |
[38] |
PC (n = 19) vs NC (n =20)c |
H-NMR |
Blood/plasma |
[64] |
|
PC (n = 20) vs NC (n =9) |
GC/MS |
serum |
[66] |
|
Leucinea |
PC (n = 17) vs NC (n =23) |
1H NMR |
Serum |
[38] |
PC (n = 360) vs NC (n =8372)c |
HPLC-ESI-MS |
plasma |
[63] |
|
Lysinea |
PC (n = 5) vs NC (n = 2)c |
HILIC-LC/MS |
plasma |
[86] |
PC (n = 19) vs NC (n =20)c |
H-NMR |
Blood/plasma |
[64] |
|
PC (n = 43) vs NC (n =42) |
GC/MS |
Serum |
[65] |
|
PC (n = 360) vs NC (n =8372)c |
HPLC-ESI-MS |
plasma |
[63] |
|
LysoPC(18:2)a |
PC (n = 5) vs NC (n = 2)c |
RP-LC/MS |
plasma |
[86] |
PC (n = 40) vs NC (n =50) |
FI-FTICR-MS |
serum |
[87] |
|
Methionine ↓ |
PC (n = 360) vs NC (n =8372)c |
HPLC-ESI-MS |
plasma |
[63] |
PC (n = 43) vs NC (n =42) |
GC/MS |
Serum |
[65] |
|
Phenylalaninea |
PC (n = 360) vs NC (n =8372)c |
HPLC-ESI-MS |
plasma |
[63] |
PC (n = 5) vs NC (n = 2)c |
RP-LC/MS |
plasma |
[86] |
|
Palmitic acid ↓ |
PC (n = 40) vs NC (n =40) |
LC-MS/MS |
serum |
[57] |
PC (n = 20) vs NC (n =9) |
GC/MS |
serum |
[66] |
|
PC-594 ↓b |
PC (n = 84) vs NC (n =99) |
tandem mass spectrometry |
Serum |
[83] |
PC (n = 40) vs NC (n =50) |
FI-FTICR-MS |
serum |
[87] |
|
Threonine ↓ |
PC (n = 360) vs NC (n =8372)c |
HPLC-ESI-MS |
plasma |
[63] |
PC (n = 43) vs NC (n =42) |
GC/MS |
Serum |
[65] |
|
Tyrosine ↓ |
PC (n = 360) vs NC (n =8372)c |
HPLC-ESI-MS |
plasma |
[63] |
PC (n = 43) vs NC (n =42) |
GC/MS |
Serum |
[65] |
|
Valine ↓ |
PC (n = 19) vs NC (n =20)c |
H-NMR |
Blood/plasma |
[64] |
PC (n = 43) vs NC (n =42) |
GC/MS |
Serum |
[65] |
|
PC (n = 360) vs NC (n =8372)c |
HPLC-ESI-MS |
plasma |
[63] |
aMetabolites that were found in multiple studies but were non-concordant.
bMetabolites that were found in multiple studies but were not included in our analysis.
cPC vs Chronic pancreatitis.
Experimental evaluation of blood based biomarkers of PC
We chose blood-based metabolites for meta-analysis since it is a non-invasive matrix enabling easy sample collection. Furthermore it is amenable to the development of an assay that can be translated into clinical use with relative ease and in a cost-effective manner as compared to a more invasive procedure like tissue biopsy.
Our study included plasma samples from four diagnostic groups including PC (N = 59), normal controls (N = 48), CRC (N = 66) and T2DM (N = 19) that were used for performance evaluation of literature curated biomarkers. PC and CRC groups had localized cancer at the time of sample collection and were not previously treated with cancer therapies. The underlying rationale for choosing the latter two cohorts (CRC and T2DM), was to evaluate biomarker specificity for PC. We used stable isotope labeling and multiple reaction monitoring (SID-MRM) based targeted mass spectrometry (MS), for measuring relative abundance for 18 metabolites (of the reported 21 listed in Table 1). Three metabolites, namely 1,5-anhydro-d-gluticol, CA19-9, and PC-594 were not quantified in our panel, and hence were not used in subsequent analyses. Test of significance between the control and PC groups showed that, seventeen metabolites had a significant p-value after applying multiple testing correction. Next we computed relative ratios between the normal controls and PC to select ten metabolites that showed a relative fold change of greater than 1.8 or less than 0.7. This is an arbitrary cut-off and was used primarily because it has been used in several “omics” based biomarker studies [51]. Metabolite marker selection based on p-value and fold change helped delineate a ten metabolite panel (Table 2). Our analysis showed that eight of the ten metabolites were down-regulated in PC, including lactate, LysoPC (18:2), alanine, choline, threonine, asparagine, tyrosine, and lysine. Palmitate and 3-hydroxybutyrate were upregulated in PC when compared to normal controls. Group separation between PC and normal controls for each of the significant metabolites was visualized as box plots that were generated using in-house R scripts (Figure 1).
Table 2: Experimental validation of a ten metabolite PC biomarker panel curated from literature
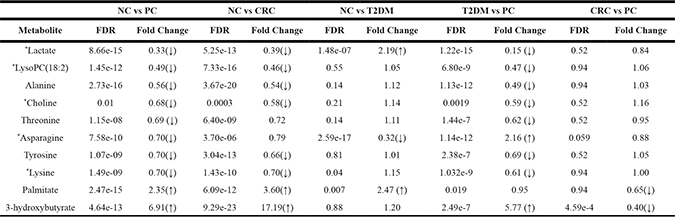
Metabolites marked with an asterix are not concordant across reported studies.
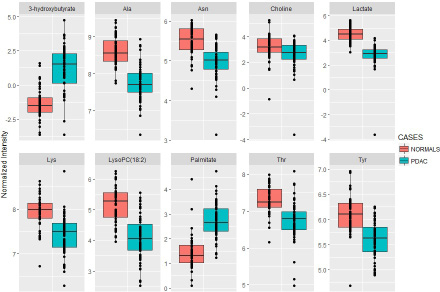
Figure 1: Boxplots for the ten metabolite panel. Group separation based on normalized abundance of the ten dysregulated metabolites in PC as compared to NC. Solid line represents median value.
Next we evaluated the efficiency of the ten-biomarker panel using biomarker analysis module of MetaboAnalyst v3.0 [52]. A random forest based multivariate ROC analysis using t-statistics for metabolite ranking resulted in a panel yielding an AUC of 0.992 (Figure 2) for PC, emphasizing high accuracy of this literature-curated classifier. Subsequently we used control cohorts to test biomarker panel specificity. Test of significance for all comparisons are detailed in Table 2. ROC analysis using the same parameters for the ten metabolites yielded an AUC of 0.986 (Figure 3) for colorectal cancer vs NC, and an AUC of 0.957 (Figure 4) for T2DM vs NC. Strikingly, test of significance for CRC vs NC (based on p-value and fold change cut-offs), yielded 8 of the 10 metabolites as being significant and the direction of regulation was also concordant as in NC vs PC (asparagine and threonine were non-significant). These results suggest a high degree of correlation between the two cancer malignancies with respect to metabolic dysregulation (> 75%) evidenced through our metabolite panel. Not surprisingly, the ten-metabolite panel proved to be a poor classifier for CRC vs PC (AUC = 0.65) (Figure 5).
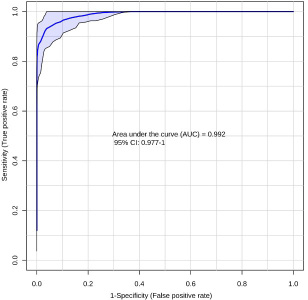
Figure 2: Receiver-operating characteristic (ROC) curve for PC (n = 59) vs NC (n = 48) using the ten metabolite panel yields AUC = 0.992.
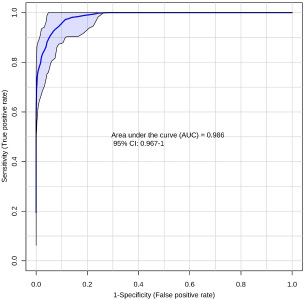
Figure 3: Receiver-operating characteristic (ROC) curve for CRC (n = 66) vs NC (n = 48) using the ten metabolite panel yields AUC = 0.986.
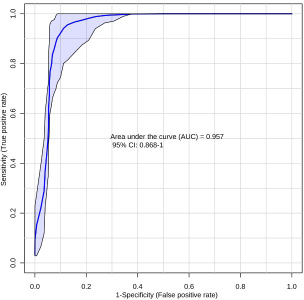
Figure 4: Receiver-operating characteristic (ROC) curve for T2DM (n = 19) vs NC (n = 48) using the ten metabolite panel yields AUC = 0.957.
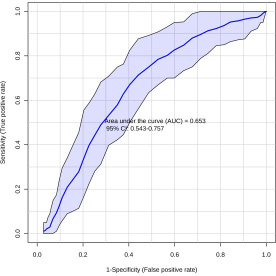
Figure 5: Receiver-operating characteristic (ROC) curve for CRC (n = 66) vs PC (n = 59) using the ten metabolite panel yields AUC = 0.653.
We also compared T2DM cohort (N = 19) against normal controls, finding 3 metabolites (asparagine, lactate and palmitate) of the 10 to be significantly dysregulated between these two groups. The ROC curve generated using the ten-metabolite panel discriminated T2DM patients from PC patients with high accuracy (AUC = 0.997) (Figure 6). In order to assess if age or gender can significantly improve prediction of patient groups, the receiver operating characteristic (ROC) curves of the ten metabolite panel with age or gender are compared with the ROC curves of the panel only using three different statistical methods namely Delong, Bootstrap and Venkatraman tests [53–55]. P-values less than 0.05 are considered statistically significant. Our results show that all the three tests have consistent results for the ROC curves comparisons, both age and sex did not help change the ROC curves significantly for NC vs PDAC, NC vs CRC and NC vs T2DM, only age helped to change the ROC curve and improve the AUC value significantly for PDAC vs CRC.
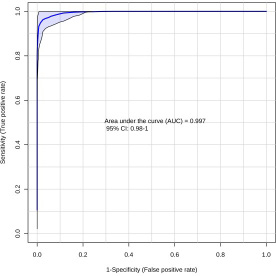
Figure 6: Receiver-operating characteristic (ROC) curve T2DM (n = 19) vs PC (n = 59) using the ten metabolite panel yields AUC = 0.997.
A multinomial logistic regression model with the 10 blood (serum/plasma) analytes and patient’s age was used to generate a plasma 10 metabolite index (P10MI) in order to distinguish between PC, CRC, T2DM and normal control groups (Figure 7). Higher calculated index values are associated with a higher risk of PC diagnosis, with confidence transitioning from 90% to 100% at 12.5. Based on calculated P10MI in our dataset, a value ≥ 12.5 represents a true PC case, with a 100% risk of being diagnosed with PC. Notably, there was relatively low variability of the P10MI for both the NC and the T2DM groups, with low overlap, with the PC group (dots outside error bars). On the other hand, there was a significant overlap between the PC and CRC groups, suggesting a lack of specificity of this panel for PC alone.
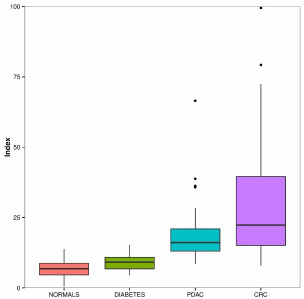
Figure 7: Boxplot depiction of the plasma 10 metabolite index (P10MI). Solid black horizontal line within the boxplots represents mean value.
DISCUSSION
The PRoBE design for biomarker development described by Pepe et al. involves biomarker discovery, followed by rigorous evaluation of biomarker performance, and finally its impact on predicting clinical outcomes [56]. Despite an array of biomarker studies of PC, there is a paucity of predictive or prognostic biomarker panels of PC that have received regulatory approvals. Moreover, PC has a relatively low prevalence (10/100,000 individuals in the USA), hence it is imperative that a biomarker panel of PC has a high specificity, thereby limiting false positives when screening a high risk population. Although there are a number of metabolomics-based PC biomarker studies, most have used (“at-diagnosis”) case-control designs that are subject to serious selection bias, limiting their general applicability to high risk populations [57, 58]. Developing a specific and sensitive panel of biomarkers offers a pragmatic approach towards increasing overall survival rates while identifying putative molecular targets for therapeutic development, and improving treatment strategies and clinical outcomes. Delineation of clinically useful biomarkers, however, requires implementation of well-designed studies for biomarker discovery followed by rigorous and blinded external validation for evaluating classification accuracy [59–62].
Creating a compendium of existing biomarker data and performing meta-analyses represent the first steps in the development of clinical assays for PC diagnosis and prognosis. Herein, we performed an exhaustive literature search to find PC case-control studies reporting dysregulated metabolites associated with PC, primarily from three different sources: PubMed, EDRN and GDOC (Georgetown Database of Cancer), using different search keywords. We delineated 21 metabolites (that included amino acids, glycerophospholipids, fatty acids and small organic acids) that were reported by two or more research groups as being dysregulated in PC. Next, we used stable isotope dilution multiple-reaction monitoring mass spectrometry (SID- MRM-MS) for targeted quantitation of these 21 metabolite markers in plasma samples obtained from patients that were diagnosed with PC and compared the profiles to normal controls with a similar median age and near uniform gender distribution. The PC patient samples (N = 59) were made available through the Indivumed repository at the MedStar-Georgetown University hospital while the normal controls (N = 48) were recruited at University of Rochester under approved IRB protocols. We also included plasma samples obtained from patients diagnosed with Type 2 diabetes (N = 19) or colorectal cancer (N = 66) as control cohorts to evaluate specificity of the biomarker panel.
The ten metabolite biomarkers delineated in this study using literature curation were found to be significantly dysregulated in PC patients as compared to normal controls. However, five of the metabolites (Lyso PC18:2, lactate, choline, lysine and asparagine) were not concordant across reported studies (Tables 1 and 2). Three metabolites, alanine [63, 64], threonine [63, 65], and tyrosine [63, 65], were found to be concordant with results from our study as well as across reported literature. On the other hand, 3-hydroxybuyterate [38, 64] and palmitate [57, 66], were reported to be down-regulated in PC across reported studies; however these metabolites were significantly up-regulated in PC patient samples upon analysis in our laboratory, with fold change values of 6.9 and 2.3 fold, respectively. These findings therefore, would need further investigations and cross-validation. Additionally, conflicting results in published literature further emphasize the need for a centralized biomarker repository to facilitate cross-laboratory and cross-platform evaluation of classifiers. One of the limitations of the meta-analysis could stem from the fact that PC and CRC samples used in our study represented localized and early stage disease while the data from the surveyed literature search included all stages, potentially lending to analytical variability.
In this study we used, CRC (as a cancer disease control) and T2DM (as a non-cancer control) cohorts for testing biomarker specificity. Several metabolite markers (eight of ten) overlapped between pancreatic cancer and colorectal cancer including, LysoPC (18:2), alanine, choline, tyrosine, lysine, and 3-hydroxybutyrate suggesting a generic metabolic perturbation pattern that underscores a cancerous metabotype. Furthermore, all of these metabolites have the same direction of regulation in the two cancer groups although their fold changes vary when compared to the normal controls.
Although T2DM has been intricately linked to the onset of PC [48], the degree of overlap between the metabolic markers between the two disease was much less (around 10–15%). The T2DM cohort used in this study was much younger and obtained from an Asian population as compared to the NCs and the PC cases which were primarily Caucasian; this is a potential weakness of the study cohort although we performed statistical analysis to rule out bias in resultant AUCs for different comparative groups. Additionally, a review of literature reporting metabolite profiling of NC vs T2DM using diverse populations show partial overlap with the markers delineated in this study [67–70]. These results emphasize the need to include related disease control cohorts that share commonalities with oncogenic progression of pancreatic cancer; these would warrant inclusion of other cancer cohorts as cancer disease controls but also those deemed to be high risk cohorts of PC such as patients diagnosed with chronic pancreatitis or with non-malignant precursor lesions of the pancreas.
Several signaling pathways that are altered during carcinogenesis are known to impact metabolic processes [71]. Given that several genetic mutations and signaling pathways overlap between different malignancies, it is reasonable to assume that this would result in shared metabolic dysregulations. Therefore, inclusion of cancer disease control and high-risk cohorts for PC biomarker studies is critical for eliminating non-specific metabolites that would otherwise diminish the clinical utility of the biomarker panel for PC diagnosis.
While we used CRC and T2DM as control for specificity, some papers from our literature survey included chronic pancreatitis (CP) or benign pancreatic conditions in their study. Overlapping biomarkers between chronic pancreatitis and our literature derived panel included lactate, lysine, histidine, glutamine, glutamate, and alanine, which were found elevated in CP vs NC [64]. Additionally, a comparison of CP and PC diagnostic groups yielded 3-hydroxybutyrate, lactate, valine, tyrosine, phenylalanine, lysine, isoleucine, histidine, glutamine, glutamate, and alanine as being up-regulated in chronic pancreatitis [64]. Comparison of PC and benign pancreatitis cases showed upregulation of 3-hydroxybutyrate and phenylalanine in PC, while lysine, asparagine, and threonine were down-regulated [44]. Threonine emerged as a specific marker for PC, although we could not include 1,5-anhydro-d-gluticol, CA19-9, and PC-594 in this analysis. The AUC for NC vs PC for threonine was 0.84 thus emphasizing the need for continued efforts to delineate a biomarker panel with high specificity for PC (Figure 8).
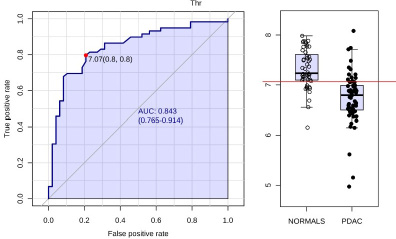
Figure 8: Receiver-operating characteristic (ROC) curve and for PC (n = 59) vs NC (n = 48) metabolite threonine yields AUC = 0.843.
Discovery and validation of novel and robust biomarkers is integral to advance personalized medicine initiative. However, there is huge gap between reported cancer biomarker studies and their translation into potential clinical use [72]. Advancing the translation of biomarkers from a scientific discovery to regulatory approvals for clinical implementation would require a concerted effort [73]. This includes a) improvements in guidelines for designing biomarker development studies for evaluation of biomarker specificity and sensitivity; b) availability of high quality bio-specimens (with clinical annotations) by controlling sample collection and storage procedures; c) application of scientific, analytical and statistical rigor to the study design; d) standardization of data reporting guidelines for biomarker discovery studies thus enabling meta-analyses; e) data sharing to facilitate cross-platform an inter-laboratory reproducibility studies; f) external biomarker validation studies performed with GLP compliance [74]. Collectively, these measures would maximize the development of robust biomarker panels that would be ready for clinical testing; in addition this would also augment testing a combination of “omics” markers that would form better classifiers. It would also lead to mechanistic studies aimed at discerning how pathway perturbations lead to the observed disease phenotype. Understanding of biochemical alterations that underscore cancer progression, reflected as biomarkers, allows for a more practical way of identifying molecular targets that can be used for customized therapeutic development.
MATERIALS AND METHODS
Databases used
A large number of studies related to pancreatic cancer biomarkers have been indexed on multiple platforms. In order to identify relevant metabolomics studies, we focused our literature searches to PubMed, as well as the biomarker data repositories EDRN (Early Detection Research Network) and G-DOC (Georgetown Database of Cancer). PubMed is a database that contains abstract and full-text citations for biomedical literature from MEDLINE, life science journals, and online books, and is maintained by United States National Library of Medicine (NLM) at the National Institute of Health (NIH). EDRN, led by the National Cancer Institute (NCI), is a collaboration focused on the discovery and clinical application of cancer biomarkers. G-DOC is a platform that combines data integration and integrative knowledge discovery for oncological and translational research communities. In our approach (Figure 9), “pancreatic cancer” is searched in PubMed, which generates over 80,000 results. To narrow down the search results, different permutations of keywords pertaining to PC biomarkers were searched. As of December 2016 the eight keywords that returned results for metabolomics based biomarker studies of PC that have been cited in this study are listed, along with number of search results generated (‘Keywords Used’, Figure 9). On the other hand, “pancreatic ductal adenocarcinoma” and “pancreatic cancer” were used as search terms in the two previously discussed cancer biomarker repositories, G-DOC and EDRN.
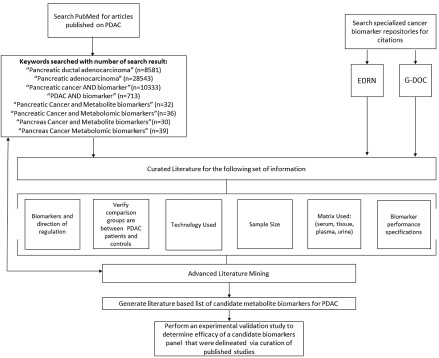
Figure 9: Schema for curating metabolites mined from literature search and meta- analyses.
Not all of the eight keywords used for searching PubMed generate results that are relevant for this study and hence were parsed. For instance, some studies focus on the structural biology of a metabolite while other studies had a bioinformatics focus. Each PubMed paper was manually curated for parsing information and determining suitability for the proposed meta-analysis.
Manual curation procedures and criteria for including metabolites
The second screening step involves mining literature for the name of the metabolite and verifying contextual data for which it was discovered in previous studies. Each metabolite recorded in the final literature search must be strictly curated for the following criteria. Firstly, only studies with human-based matrices (urine, cell lines, tissue, plasma, serum) are allowed; no animal studies or animal to human comparative studies were included. Metabolites derived from the comparing of pancreatic cancer patients vs. normal patients, or controls were segregated from other comparisons. The sample size, technology used in biomarker discovery (i.e. mass spectrometry, NMR, etc.) and most importantly, and the direction of regulation of the biomarker were documented. We observed that not all studies found had information pertaining to all these categories emphasizing the need to standardize reporting guidelines for biomarker studies. An additional author-specific search was accomplished by mining the bibliography of different studies for additional relevant papers that may not have appeared in the initial PubMed search. Review articles found on PubMed were also cross-referenced, in order to verify that metabolite data were recorded correctly.
Study participant and samples
A total of 192 plasma samples were analyzed with four diagnostic groups: PC, CRC, T2DM, and normal controls. PC (n = 59) and CRC (n = 66) samples were made available through the Indivumed repository at the MedStar-Georgetown University hospital protocols. PC and CRC patients were candidates for curative surgery and hence represented previously untreated early stages of cancer. Normal controls (n = 48) were recruited as a part of the Rochester aging study (RAS) under approved IRB protocols [75]. Plasma samples from patients with a diagnosis of T2DM (n = 19) (without any co-morbidity) were collected under approved IRB protocols in Qatar University [76, 77]. Clinical and demographic characteristics of the cohort as age, sex, ethnicity were recorded (Table 3). All samples were collected under 12 hour fasting conditions using stringent procedures for collection and storage thus minimizing confounding by pre-analytical variables on downstream MS analyses. Other factors and coexisting conditions such as BMI, jaundice, diabetes and smoking, alcohol traits for each subject were also annotated.
Table 3: Demographic details of the study participants
PC (n = 59) |
CRC (n = 66) |
T2DM (n = 19) |
Normal (n = 48) |
|
|---|---|---|---|---|
Median Age |
74.2 |
63.45 |
55 |
79 |
Ethnicity |
||||
Caucasian |
33 |
46 |
0 |
47 |
African American |
13 |
11 |
3 |
1 |
Asian |
7 |
8 |
16 |
0 |
Hispanic |
2 |
0 |
0 |
0 |
Other |
4 |
1 |
0 |
0 |
Gender |
||||
Male |
28 |
31 |
17 |
25 |
Female |
31 |
35 |
2 |
23 |
Type II Diabetes |
22 |
6 |
19 |
5 |
Mean BMI |
25.072 |
25.829 |
29.525 |
26.175 |
Alcohol |
20 |
33 |
0 |
35 |
Smoking |
29 |
37 |
12 |
4 |
Jaundice |
27 |
0 |
0 |
0 |
Targeted liquid chromatography-mass spectrometry
Targeted analyses were performed using plasma samples on a Acquity UPLC (Waters Corporation, USA) online with a triple quadrupole MS (Xevo TQ-S Waters Corporation, USA) operating in the MRM mode. Different classes of metabolites such as amino acids, biogenic amines, glycerophospholipids, acylcarnitines, sphingolipids and sugars were analyzed using AbsoluteIDQ® p180 kit (Biocrates Life Sciences AG, Innsbruck, Austria) as detailed by the manufacturer as described previously [75].
We also performed targeted mass spectrometry based quantification for 3-hydroxybutyrate, choline, lactate, palmitate, using a separate extraction. 15 ul of serum/plasma were mixed with 95 ul methanol containing 500 nM each of 17 isotopically labeled internal standards (Cambridge Isotope Labs product number MSK-A2-1.2) and vortexed for 20 seconds. After adding 190 ul dichloromethane, samples were again vortexed for 20 seconds. Finally, 60 ul water were added and the samples were vortexed for 10 min. at 4C, then centrifuged at 8,000 × g for 10 min. at 4°C. The two solvent layers were collected separately and dried under vacuum, then stored at −80C. The top (polar) layer was resuspended in 100 ul water and 1 ul was injected for LC/MS analysis as described [78]. The bottom (lipid) layer was resuspended in 50 ul 65:30:5 acetonitrile/isopropanol/water (v/v/v) and 5 ul was injected for LC/MS analysis as described [79].
Statistical and bioinformatics analysis
Statistical analysis of the MS data were performed using MetaboAnalyst 3.0 [80]. Initially we used the statistical analysis module of MetaboAnalyst 3.0. Data were log transformed before performing t-statistics to delineate significant metabolites using fold change and test of significance as thresholds. Metabolites with an adjusted p-value of less than 0.05 and a fold change either less than or equal to 0.7 or greater than 1.8 were deemed significant for constructing a binary classifier using ROC analysis module of MetaboAnalyst v 3.0. Box plots were plotted using in-house R scripts. Plasma index metabolite index was calculated using a multinomial logistic regression model in R as described previously [81].
Abbreviations
PC (Pancreatic Cancer), NC (Normal Control), CRC (Colorectal Cancer), T2DM (Type II Diabetes), CP (Chronic Pancreatitis).
Author contributions
AKC, KU, HJF, MSF and MM conceived the study. NR provided T2DM samples for the study. SSM performed MS experiments. KYM and XZ performed statistical analysis. HJ and YF performed literature search and curated biomarker panel for PC and consolidated results. All authors contributed to the writing of the paper.
ACKNOWLEDGMENTS
The authors would like to thank Dr. Elizaveta Frienkman for help with targeted MS analysis of plasma samples. The authors would also like to thank Ms. Nan Hu and Mr. Joe Lewis with the literature mining for curated biomarkers.
CONFLICTS OF INTEREST
The authors declare no competing conflicts of interest.
FUNDING
This work was supported by ACS IRG-92-152-17 pilot award number AWD4470404 to KU and AKC. The authors would like to acknowledge the Metabolomics Shared Resource in Georgetown University (Washington DC, USA) partially supported by NIH/NCI/CCSG grant P30-CA051008.
REFERENCES
1. Siegel RL, Miller KD, Jemal A. Cancer Statistics, 2017. CA Cancer J Clin. 2017; 67:7–30. https://doi.org/10.3322/caac.21387.
2. Krechler T, Horejs J, Ulrych J, Zeman M, Macasek J, Duskova J, Zak A. Current status of pancreatic cancer diagnosis. Cas Lek Cesk. 2011; 150:587–93.
3. Matthaios D, Zarogoulidis P, Balgouranidou I, Chatzaki E, Kakolyris S. Molecular pathogenesis of pancreatic cancer and clinical perspectives. Oncology. 2011; 81:259–72. https://doi.org/10.1159/000334449.
4. Rahib L, Smith BD, Aizenberg R, Rosenzweig AB, Fleshman JM, Matrisian LM. Projecting Cancer Incidence and Deaths to 2030: The Unexpected Burden of Thyroid, Liver, and Pancreas Cancers in the United States. Cancer Research. 2014; 74:2913–21.
5. Li D, Xie K, Wolff R, Abbruzzese JL. Pancreatic cancer. Lancet. 2004; 363:1049–57. https://doi.org/10.1016/S0140-673615841-8S.
6. McWilliams RR, Maisonneuve P, Bamlet WR, Petersen GM, Li D, Risch HA, Yu H, Fontham ET, Luckett B, Bosetti C, Negri E, La Vecchia C, Talamini R, et al. Risk Factors for Early-Onset and Very-Early-Onset Pancreatic Adenocarcinoma: A Pancreatic Cancer Case-Control Consortium (PanC4) Analysis. Pancreas. 2016; 45:311–6. https://doi.org/10.1097/MPA.0000000000000392.
7. Casari I, Falasca M. Diet and Pancreatic Cancer Prevention. Cancers (Basel). 2015; 7:2309–17. https://doi.org/10.3390/cancers7040892.
8. Taunk P, Hecht E, Stolzenberg-Solomon R. Are meat and heme iron intake associated with pancreatic cancer? Results from the NIH-AARP Diet and Health Cohort. Int J Cancer. 2016; 138:2172–89. https://doi.org/10.1002/ijc.29964.
9. Kim VM, Ahuja N. Early detection of pancreatic cancer. Chin J Cancer Res. 2015; 27:321–31. https://doi.org/10.3978/j.issn.1000-9604.2015.07.03.
10. Majumder S, Chari ST, Ahlquist DA. Molecular detection of pancreatic neoplasia: Current status and future promise. World J Gastroenterol. 2015; 21:11387–95. https://doi.org/10.3748/wjg.v21.i40.11387.
11. Honda K, Kobayashi M, Okusaka T, Rinaudo JA, Huang Y, Marsh T, Sanada M, Sasajima Y, Nakamori S, Shimahara M, Ueno T, Tsuchida A, Sata N, et al. Plasma biomarker for detection of early stage pancreatic cancer and risk factors for pancreatic malignancy using antibodies for apolipoprotein-AII isoforms. Sci Rep. 2015; 5:15921. https://doi.org/10.1038/srep15921.
12. Capello M, Bantis LE, Scelo G, Zhao Y, Li P, Dhillon DS, Patel NJ, Kundnani DL, Wang H, Abbruzzese JL, Maitra A, Tempero MA, Brand R, et al. Sequential Validation of Blood-Based Protein Biomarker Candidates for Early-Stage Pancreatic Cancer. J Natl Cancer Inst. 2017; 109. https://doi.org/10.1093/jnci/djw266.
13. Swords DS, Firpo MA, Scaife CL, Mulvihill SJ. Biomarkers in pancreatic adenocarcinoma: current perspectives. Onco Targets Ther. 2016; 9:7459–67. https://doi.org/10.2147/OTT.S100510.
14. Harsha HC, Kandasamy K, Ranganathan P, Rani S, Ramabadran S, Gollapudi S, Balakrishnan L, Dwivedi SB, Telikicherla D, Selvan LD, Goel R, Mathivanan S, Marimuthu A, et al. A compendium of potential biomarkers of pancreatic cancer. PLoS Med. 2009; 6:e1000046. https://doi.org/10.1371/journal.pmed.1000046.
15. Asuthkar S, Rao JS, Gondi CS. Drugs in preclinical and early-stage clinical development for pancreatic cancer. Expert Opin Investig Drugs. 2012; 21:143–52. https://doi.org/10.1517/13543784.2012.651124.
16. Liu R, Chen X, Du Y, Yao W, Shen L, Wang C, Hu Z, Zhuang R, Ning G, Zhang C, Yuan Y, Li Z, Zen K, et al. Serum MicroRNA Expression Profile as a Biomarker in the Diagnosis and Prognosis of Pancreatic Cancer. Clin Chem. 2012; 58:610–8. https://doi.org/10.1373/clinchem.2011.172767.
17. Topilow AA, Davis JM, Vernick JJ, Tang D, Corbett S, Veltman T, Wagner SJ, Gilvarg C. Confirmation of a potential biomarker for early-stage pancreatic cancer. Cancer Biomark. 2011; 10:27–33. https://doi.org/10.3233/CBM-2012-0225.
18. Kwon RS, Simeone DM. The use of protein-based biomarkers for the diagnosis of cystic tumors of the pancreas. Int J Proteomics. 2011; 2011:413646. https://doi.org/10.1155/2011/413646.
19. Corcos O, Couvelard A, Dargere D, Sauvanet A, Hammel P, Paradis V, Levy P, Ruszniewski P, Bedossa P. Proteomic Assessment of Markers for Malignancy in the Mucus of Intraductal Papillary Mucinous Neoplasms of the Pancreas. Pancreas. 2012; 41:169–74. https://doi.org/10.1097/MPA.0b013e3182289356.
20. Adamczyk B, Tharmalingam T, Rudd PM. Glycans as cancer biomarkers. Biochim Biophys Acta. 2012; 1820:1347–53. https://doi.org/10.1016/j.bbagen.2011.12.001.
21. Jamieson NB, Morran DC, Morton JP, Ali A, Dickson EJ, Carter CR, Sansom OJ, Evans TR, McKay CJ, Oien KA. MicroRNA molecular profiles associated with diagnosis, clinicopathologic criteria, and overall survival in patients with resectable pancreatic ductal adenocarcinoma. Clin Cancer Res. 2012; 18:534–45. https://doi.org/10.1158/1078-0432.CCR-11-0679.
22. Nolen BM, Brand RE, Prosser D, Velikokhatnaya L, Allen PJ, Zeh HJ, Grizzle WE, Lomakin A, Lokshin AE. Prediagnostic serum biomarkers as early detection tools for pancreatic cancer in a large prospective cohort study. PLoS One. 2014; 9:e94928. https://doi.org/10.1371/journal.pone.0094928.
23. Tanday S. Biomarkers in blood could help to detect pancreatic cancer. Lancet Oncol. 2014; 15:e108.
24. Floyd E, McShane TM. Development and use of biomarkers in oncology drug development. Toxicol Pathol. 2004; 32:106–15.
25. Jiang Y, Liu M, Li Z, Jiang Y. Discovery of novel candidate oncogenes in pancreatic carcinoma using high-throughput microarrays. Hepatogastroenterology. 2013; 60:1825–32.
26. Schultz NA, Dehlendorff C, Jensen BV, Bjerregaard JK, Nielsen KR, Bojesen SE, Calatayud D, Nielsen SE, Yilmaz M, Hollander NH, Andersen KK, Johansen JS. MicroRNA biomarkers in whole blood for detection of pancreatic cancer. JAMA. 2014; 311:392–404. https://doi.org/10.1001/jama.2013.284664.
27. Khan S, Ansarullah, Kumar D, Jaggi M, Chauhan SC. Targeting microRNAs in pancreatic cancer: microplayers in the big game. Cancer Res. 2013; 73:6541–7. https://doi.org/10.1158/0008-5472.CAN-13-1288.
28. Shaw VE, Lane B, Jenkinson C, Cox T, Greenhalf W, Halloran CM, Tang J, Sutton R, Neoptolemos JP, Costello E. Serum cytokine biomarker panels for discriminating pancreatic cancer from benign pancreatic disease. Mol Cancer. 2014; 13:114. https://doi.org/10.1186/1476-4598-13-114.
29. Thomas JK, Kim MS, Balakrishnan L, Nanjappa V, Raju R, Marimuthu A, Radhakrishnan A, Muthusamy B, Khan AA, Sakamuri S, Tankala SG, Singal M, Nair B, et al. Pancreatic Cancer Database: An integrative resource for pancreatic cancer. Cancer Biol Ther. 2014; 15:963–7. https://doi.org/10.4161/cbt.2918.
30. Nixon AB, Pang H, Starr MD, Friedman PN, Bertagnolli MM, Kindler HL, Goldberg RM, Venook AP, Hurwitz HI. Alliance for Clinical Trials In O. Prognostic and predictive blood-based biomarkers in patients with advanced pancreatic cancer: results from CALGB80303 (Alliance). Clin Cancer Res. 2013; 19:6957–66. https://doi.org/10.1158/1078-0432.CCR-13-0926.
31. Costello E, Greenhalf W, Neoptolemos JP. New biomarkers and targets in pancreatic cancer and their application to treatment. Nat Rev Gastroenterol Hepatol. 2012; 9:435–44.
32. Le N, Sund M, Vinci A, and GEMS collaborating group of Pancreas 2000. Prognostic and predictive markers in pancreatic adenocarcinoma. Dig Liver Dis. 2016; 48:223–30. https://doi.org/10.1016/j.dld.2015.11.001.
33. Herreros-Villanueva M, Bujanda L. Non-invasive biomarkers in pancreatic cancer diagnosis: what we need versus what we have. Ann Transl Med. 2016; 4:134. https://doi.org/10.21037/atm.2016.03.44.
34. Zhang Q, Chen S, Zeng L, Chen Y, Lian G, Qian C, Li J, Xie R, Huang KH. New developments in the early diagnosis of pancreatic cancer. Expert Rev Gastroenterol Hepatol. 2017; 11:149–56. https://doi.org/10.1080/17474124.2017.1271323.
35. Koen N, Du Preez I, Loots du T. Metabolomics and Personalized Medicine. Adv Protein Chem Struct Biol. 2016; 102:53–78. https://doi.org/10.1016/bs.apcsb.2015.09.003.
36. Li S, Todor A, Luo R. Blood transcriptomics and metabolomics for personalized medicine. Comput Struct Biotechnol J. 2016; 14:1–7. https://doi.org/10.1016/j.csbj.2015.10.005.
37. Armitage EG, Ciborowski M. Applications of Metabolomics in Cancer Studies. Adv Exp Med Biol. 2017; 965:209–34. https://doi.org/10.1007/978-3-319-47656-8_9.
38. OuYang D, Xu J, Huang H, Chen Z. Metabolomic profiling of serum from human pancreatic cancer patients using 1H NMR spectroscopy and principal component analysis. Appl Biochem Biotechnol. 2011; 165:148–54. https://doi.org/10.1007/s12010-011-9240-0.
39. Stambuk S, Sundov D, Kuret S, Beljan R, Andelinovic S. Future perspectives of personalized oncology. Coll Antropol. 2010; 34:763–9.
40. Lowery MA, O'Reilly EM. Pancreatic cancer: the role of molecular markers in diagnosis and management. Clin Adv Hematol Oncol. 2011; 9:900–8.
41. Franssen B, Chan C. Pancreatic Cancer: The surgeons point of view. Rev Gastroenterol Mex. 2011; 76:353–61. https://doi.org/03750906764011.
42. Kaur P, Sheikh K, Kirilyuk A, Kirilyuk K, Singh R, Ressom HW, Cheema AK. Metabolomic profiling for biomarker discovery in pancreatic cancer. Int J Mass Spectrom. 2012; 310:44–51.
43. Napoli C, Sperandio N, Lawlor RT, Scarpa A, Molinari H, Assfalg M. Urine metabolic signature of pancreatic ductal adenocarcinoma by h nuclear magnetic resonance: identification, mapping, and evolution. J Proteome Res. 2012; 11:1274–83. https://doi.org/10.1021/pr200960u.
44. Bathe OF, Shaykhutdinov R, Kopciuk K, Weljie AM, McKay A, Sutherland FR, Dixon E, Dunse N, Sotiropoulos D, Vogel HJ. Feasibility of identifying pancreatic cancer based on serum metabolomics. Cancer Epidemiol Biomarkers Prev. 2011; 20:140–7. https://doi.org/10.1158/1055-9965.EPI-10-0712.
45. Zhang H, Wang Y, Gu X, Zhou J, Yan C. Metabolomic profiling of human plasma in pancreatic cancer using pressurized capillary electrochromatography. Electrophoresis. 2011; 32:340–7. https://doi.org/10.1002/elps.201000431.
46. Halbrook CJ, Lyssiotis CA. Employing Metabolism to Improve the Diagnosis and Treatment of Pancreatic Cancer. Cancer Cell. 2017; 31:5–19. https://doi.org/10.1016/j.ccell.2016.12.006.
47. Hardie RA, van Dam E, Cowley M, Han TL, Balaban S, Pajic M, Pinese M, Iconomou M, Shearer RF, McKenna J, Miller D, Waddell N, Pearson JV, et al. Mitochondrial mutations and metabolic adaptation in pancreatic cancer. Cancer Metab. 2017; 5:2. https://doi.org/10.1186/s40170-017-0164-1.
48. Wang F, Herrington M, Larsson J, Permert J. The relationship between diabetes and pancreatic cancer. Molecular Cancer. 2003; 2:4-. https://doi.org/10.1186/1476-4598-2-4.
49. Gomez-Rubio P, Rosato V, Marquez M, Bosetti C, Molina-Montes E, Rava M, Pinero J, Michalski CW, Farre A, Molero X, Lohr M, Ilzarbe L, Perea J, et al. A systems approach identifies time-dependent associations of multimorbidities with pancreatic cancer risk. Ann Oncol. 2017; 28:1618–24. https://doi.org/10.1093/annonc/mdx167.
50. Chechlinska M, Kowalewska M, Nowak R. Systemic inflammation as a confounding factor in cancer biomarker discovery and validation. Nat Rev Cancer. 2010; 10:2–3.
51. McCarthy DJ, Smyth GK. Testing significance relative to a fold-change threshold is a TREAT. Bioinformatics. 2009; 25:765–71. https://doi.org/10.1093/bioinformatics/btp053.
52. Xia J, Psychogios N, Young N, Wishart DS. MetaboAnalyst: a web server for metabolomic data analysis and interpretation. Nucleic Acids Res. 2009; 37:W652–60. https://doi.org/10.1093/nar/gkp356.
53. Venkatraman ES, Begg CB. A Distribution-Free Procedure for Comparing Receiver Operating Characteristic Curves from a Paired Experiment. Biometrika. 1996; 83:835–48.
54. DeLong ER, DeLong DM, Clarke-Pearson DL. Comparing the Areas under Two or More Correlated Receiver Operating Characteristic Curves: A Nonparametric Approach. Biometrics. 1988; 44:837–45. https://doi.org/10.2307/2531595.
55. Venkatraman ES. A permutation test to compare receiver operating characteristic curves. Biometrics. 2000; 56:1134–8.
56. Pepe MS, Feng Z, Janes H, Bossuyt PM, Potter JD. Pivotal evaluation of the accuracy of a biomarker used for classification or prediction: standards for study design. J Natl Cancer Inst. 2008; 100:1432–8. https://doi.org/10.1093/jnci/djn326.
57. Di Gangi IM, Mazza T, Fontana A, Copetti M, Fusilli C, Ippolito A, Mattivi F, Latiano A, Andriulli A, Vrhovsek U, Pazienza V. Metabolomic profile in pancreatic cancer patients: a consensus-based approach to identify highly discriminating metabolites. Oncotarget. 2016; 7:5815–29. https://doi.org/10.18632/oncotarget.6808.
58. Fujiwara Y, Kobayashi T, Chayahara N, Imamura Y, Toyoda M, Kiyota N, Mukohara T, Nishiumi S, Azuma T, Yoshida M, Minami H. Metabolomics evaluation of serum markers for cachexia and their intra-day variation in patients with advanced pancreatic cancer. PLoS One. 2014; 9:e113259. https://doi.org/10.1371/journal.pone.0113259.
59. Basil CF, Zhao Y, Zavaglia K, Jin P, Panelli MC, Voiculescu S, Mandruzzato S, Lee HM, Seliger B, Freedman RS, Taylor PR, Hu N, Zanovello P, et al. Common cancer biomarkers. Cancer Res. 2006; 66:2953–61. https://doi.org/10.1158/0008-5472.CAN-05-3433.
60. Cairns RA, Harris IS, Mak TW. Regulation of cancer cell metabolism. Nat Rev Cancer. 2011; 11:85–95. https://doi.org/10.1038/nrc2981.
61. Seyfried TN, Shelton LM. Cancer as a metabolic disease. Nutr Metab (Lond). 2010; 7:7. https://doi.org/10.1186/1743-7075-7-7.
62. Wu W, Zhao S. Metabolic changes in cancer: beyond the Warburg effect. Acta Biochim Biophys Sin (Shanghai). 2013; 45:18–26. https://doi.org/10.1093/abbs/gms104.
63. Fukutake N, Ueno M, Hiraoka N, Shimada K, Shiraishi K, Saruki N, Ito T, Yamakado M, Ono N, Imaizumi A, Kikuchi S, Yamamoto H, Katayama K. A Novel Multivariate Index for Pancreatic Cancer Detection Based On the Plasma Free Amino Acid Profile. PLoS One. 2015; 10:e0132223. https://doi.org/10.1371/journal.pone.0132223.
64. Zhang L, Jin H, Guo X, Yang Z, Zhao L, Tang S, Mo P, Wu K, Nie Y, Pan Y, Fan D. Distinguishing pancreatic cancer from chronic pancreatitis and healthy individuals by H nuclear magnetic resonance-based metabonomic profiles. Clin Biochem. 2012; 45:1064–9. https://doi.org/10.1016/j.clinbiochem.2012.05.012.
65. Kobayashi T, Nishiumi S, Ikeda A, Yoshie T, Sakai A, Matsubara A, Izumi Y, Tsumura H, Tsuda M, Nishisaki H, Hayashi N, Kawano S, Fujiwara Y, et al. A novel serum metabolomics-based diagnostic approach to pancreatic cancer. Cancer Epidemiol Biomarkers Prev. 2013; 22:571–9. https://doi.org/10.1158/1055-9965.EPI-12-1033.
66. Nishiumi S, Shinohara M, Ikeda A, Yoshie T, Hatano N, Kakuyama S, Mizuno S, Sanuki T, Kutsumi H, Fukusaki E, Azuma T, Takenawa T, Yoshida M. Serum metabolomics as a novel diagnostic approach for pancreatic cancer. Metabolomics. 2010; 6:518–28. https://doi.org/10.1007/s11306-010-0224-9.
67. Peddinti G, Cobb J, Yengo L, Froguel P, Kravic J, Balkau B, Tuomi T, Aittokallio T, Groop L. Early metabolic markers identify potential targets for the prevention of type 2 diabetes. Diabetologia. 2017; 60:1740–50. https://doi.org/10.1007/s00125-017-4325-0.
68. Carter TC, Rein D, Padberg I, Peter E, Rennefahrt U, David DE, McManus V, Stefanski E, Martin S, Schatz P, Schrodi SJ. Validation of a metabolite panel for early diagnosis of type 2 diabetes. Metabolism. 2016; 65:1399–408. https://doi.org/10.1016/j.metabol.2016.06.007.
69. Villarreal-Perez JZ, Villarreal-Martinez JZ, Lavalle-Gonzalez FJ, Torres-Sepulveda Mdel R, Ruiz-Herrera C, Cerda-Flores RM, Castillo-Garcia ER, Rodriguez-Sanchez IP, Martinez de Villarreal LE. Plasma and urine metabolic profiles are reflective of altered beta-oxidation in non-diabetic obese subjects and patients with type 2 diabetes mellitus. Diabetol Metab Syndr. 2014; 6:129. https://doi.org/10.1186/1758-5996-6-129.
70. Kim M, Kim M, Han JY, Lee SH, Jee SH, Lee JH. The metabolites in peripheral blood mononuclear cells showed greater differences between patients with impaired fasting glucose or type 2 diabetes and healthy controls than those in plasma. Diab Vasc Dis Res. 2017; 14:130–8. https://doi.org/10.1177/1479164116678157.
71. DeBerardinis RJ, Chandel NS. Fundamentals of cancer metabolism. Sci Adv. 2016; 2:e1600200. https://doi.org/10.1126/sciadv.1600200.
72. Goossens N, Nakagawa S, Sun X, Hoshida Y. Cancer biomarker discovery and validation. Transl Cancer Res. 2015; 4:256–69. https://doi.org/10.3978/j.issn.2218-676X.2015.06.04.
73. Bensalah K, Montorsi F, Shariat SF. Challenges of cancer biomarker profiling. Eur Urol. 2007; 52:1601–9. https://doi.org/10.1016/j.eururo.2007.09.036.
74. Marton MJ, Weiner R. Practical Guidance for Implementing Predictive Biomarkers into Early Phase Clinical Studies. BioMed Research International. 2013; 2013:891391. https://doi.org/10.1155/2013/891391.
75. Mapstone M, Cheema AK, Fiandaca MS, Zhong X, Mhyre TR, MacArthur LH, Hall WJ, Fisher SG, Peterson DR, Haley JM, Nazar MD, Rich SA, Berlau DJ, et al. Plasma phospholipids identify antecedent memory impairment in older adults. Nat Med. 2014; 20:415–8. https://doi.org/10.1038/nm.3466.
76. Kaur P, Rizk N, Ibrahim S, Luo Y, Younes N, Perry B, Dennis K, Zirie M, Luta G, Cheema AK. Quantitative metabolomic and lipidomic profiling reveals aberrant amino acid metabolism in type 2 diabetes. Mol Biosyst. 2013; 9:307–17.https://doi.org/10.1039/C2MB25384D.
77. Kaur P, Rizk NM, Ibrahim S, Younes N, Uppal A, Dennis K, Karve T, Blakeslee K, Kwagyan J, Zirie M, Ressom HW, Cheema AK. iTRAQ-based quantitative protein expression profiling and MRM verification of markers in type 2 diabetes. J Proteome Res. 2012; 11:5527–39. https://doi.org/10.1021/pr300798z.
78. Birsoy K, Wang T, Chen WW, Freinkman E, Abu-Remaileh M, Sabatini DM. An Essential Role of the Mitochondrial Electron Transport Chain in Cell Proliferation Is to Enable Aspartate Synthesis. Cell. 2015; 162:540–51. https://doi.org/10.1016/j.cell.2015.07.016.
79. Smulan LJ, Ding W, Freinkman E, Gujja S, Edwards YJ, Walker AK. Cholesterol-Independent SREBP-1 Maturation Is Linked to ARF1 Inactivation. Cell Reports. 2016; 16:9–18. https://doi.org/10.1016/j.celrep.2016.05.086.
80. Xia J, Wishart DS. Using MetaboAnalyst 3.0 for Comprehensive Metabolomics Data Analysis. Curr Protoc Bioinformatics. 2016; 55:1401–091. https://doi.org/10.1002/cpbi.11.
81. Fiandaca MS, Zhong X, Cheema AK, Orquiza MH, Chidambaram S, Tan MT, Gresenz CR, FitzGerald KT, Nalls MA, Singleton AB, Mapstone M, Federoff HJ. Plasma 24-metabolite Panel Predicts Preclinical Transition to Clinical Stages of Alzheimer's Disease. Front Neurol. 2015; 6:237. https://doi.org/10.3389/fneur.2015.00237.
82. Xie G, Lu L, Qiu Y, Ni Q, Zhang W, Gao YT, Risch HA, Yu H, Jia W. Plasma metabolite biomarkers for the detection of pancreatic cancer. J Proteome Res. 2015; 14:1195–202. https://doi.org/10.1021/pr501135f.
83. Ritchie SA, Chitou B, Zheng Q, Jayasinghe D, Jin W, Mochizuki A, Goodenowe DB. Pancreatic cancer serum biomarker PC-594: Diagnostic performance and comparison to CA19–9. World J Gastroenterol. 2015; 21:6604–12. https://doi.org/10.3748/wjg.v21.i21.6604.
84. Koopmann J, Rosenzweig CN, Zhang Z, Canto MI, Brown DA, Hunter M, Yeo C, Chan DW, Breit SN, Goggins M. Serum markers in patients with resectable pancreatic adenocarcinoma: macrophage inhibitory cytokine 1 versus CA19–9. Clin Cancer Res. 2006; 12:442–6. https://doi.org/10.1158/1078-0432.CCR-05-0564.
85. Tesiram YA, Lerner M, Stewart C, Njoku C, Brackett DJ. Utility of nuclear magnetic resonance spectroscopy for pancreatic cancer studies. Pancreas. 2012; 41:474–80. https://doi.org/10.1097/MPA.0b013e31822a708c.
86. Urayama S, Zou W, Brooks K, Tolstikov V. Comprehensive mass spectrometry based metabolic profiling of blood plasma reveals potent discriminatory classifiers of pancreatic cancer. Rapid Commun Mass Spectrom. 2010; 24:613–20. https://doi.org/10.1002/rcm.4420.
87. Ritchie SA, Akita H, Takemasa I, Eguchi H, Pastural E, Nagano H, Monden M, Doki Y, Mori M, Jin W, Sajobi TT, Jayasinghe D, Chitou B, et al. Metabolic system alterations in pancreatic cancer patient serum: potential for early detection. BMC Cancer. 2013; 13:416. https://doi.org/10.1186/1471-2407-13-416.