
INTRODUCTION
Lung cancer is the leading cause of cancer-related death among men and women worldwide with only a low 15% overall 5-year survival rate and a high recurrence rate [1–5]. Approximately 85% of all lung cancers are non-small cell lung cancer (NSCLC), which represents heterogeneous subtypes including most of squamous cell lung carcinoma (SCC), adenocarcinoma (ADC), and large-cell lung carcinoma (SCLC) [6]. Early detection and classification of NSCLC needed to be extended by extensive molecular studies [7]. Considering the increasing gene targets of cancer therapy and their limits in clinical application [7, 8], a precise molecular biomarker for early detection, accurate assessment, personalizing therapy, and prognosis evaluation for lung cancer needed to be explored [9].
MicroRNAs (miRNAs), as endogenous and non-coding small RNAs, suppress gene expression by binding to 3'- untranslated region (UTR) of targeted messenger RNAs (mRNAs), leading to gene degradation or translation suppression [10, 11]. Dysregulation of miRNAs plays crucial roles in lung cancer development, progression, and response to therapy [12–14]. Emerging evidence suggests that miRNAs might be predominant diagnostic and prognostic biomarkers for lung cancer [15–17].
MiR-205, located in a lung cancer-associated genomic amplification region at 1q32.2 [18, 19], participates in tumorigenesis of lung cancer [20, 21], especially in the occurrence, development, and prognosis of NSCLC [22, 23]. It markedly overexpresses in the tissues of lung cancer and serves as a prospective diagnostic biomarker for pulmonary diseases. Overexpression of miR-205 promoted NSCLC cell invasion and metastasis through regulating an epithelial phenotype with increased E-cadherin and reduced fibronectin [22]. MiR-205 was further developed to identify SCC and ADC subtypes of NSCLC [23]. These studies indicated that miR-205 might serve as a potential biomarker for detection of NSCLC. Meanwhile, substantial evidence reveals that level of miR-205 was related to the prognosis of lung cancer [24–29]. However, the results in these studies were inconsistent and remained inconclusive. Therefore, we conducted this meta-analysis to evaluate the diagnostic and prognostic efficiency of miR-205 for patients with lung cancer.
RESULTS
Literature selection
A total of 662 potentially relevant articles were obtained from electronic databases and other sources, and 499 of them were remained after removing 163 duplications. Of the remained articles, 460 articles, such as letters, reviews and meta-analysis, or unrelated to the research topic, were excluded after reviewing titles and abstracts. Of the remaining 39 full-text candidates, 23 potential articles were further excluded, which did not have sufficient data, or were unrelated to cancer diagnosis or prognosis. Finally, 16 eligible articles [18, 23–37] were included in this study (Figure 1). Among the included 16 articles, 1 article examined both diagnostic and prognostic values of miR-205. Thus, 11 articles reported the diagnostic values of miR-205, and 6 articles examined prognostic values of miR-205.
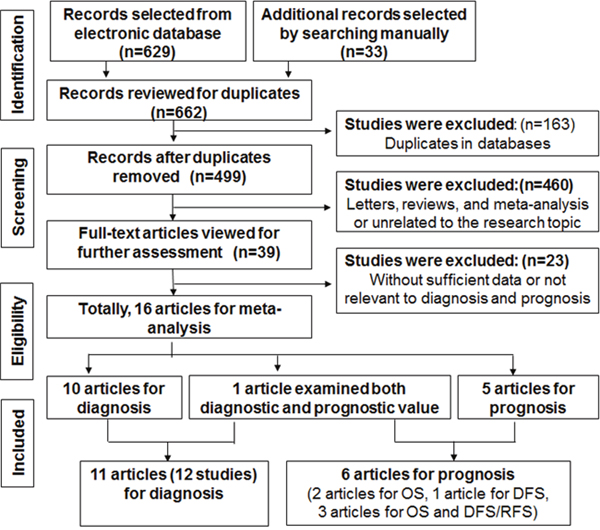
Figure 1: Flow diagram of study selection process.
Diagnostic meta-analysis
Study characteristics and quality assessment
Totally, 564 lung cancer patients (mainly composed of SCC patients) and 667 controls (with healthy people and non-SCC patients) were included in this meta-analysis. Because Hamamoto et al [32] investigated the roles of miR-205 in two independent study samples, we considered it as two independent studies in this analysis. Thus, totally 11 articles including 12 studies were included (Table 1). The investigated ethnicity included Asian (n = 4), Caucasian (n = 6), and Caucasian/African (n = 2). The specimen types contained tissue (n = 7) and blood (n = 5). The qualities of the included studies were assessed by Quality Assessment of Diagnostic Accuracy Studies-2 (QUADAS-2, Supplementary Figure 1), and each study received moderate or high quality with scores between 4 and 6. The QUADAS-2 results are represented in Figure 2 and Table 1, showing that no significant bias was presented in current meta-analysis.
Table 1: Characteristics and quality assessment of diagnostic clinical trials included in the meta-analysis
Author |
Year |
Country |
Ethnicity |
Cancer type |
Case/control |
Specimen |
AUC |
TP |
FP |
FN |
TN |
SEN |
SPE |
QUADAS |
|---|---|---|---|---|---|---|---|---|---|---|---|---|---|---|
Lebanony |
2009 |
USA |
Caucasian |
SCC |
24/49 |
tissue |
0.960 |
23 |
5 |
1 |
44 |
0.96 |
0.90 |
5 |
2010 |
USA |
Caucasian /African |
SCC |
48/48 |
blood |
0.789 |
31 |
5 |
17 |
43 |
0.65 |
0.90 |
5 |
|
Del |
2011 |
Italy |
Caucasian |
SCC |
24/26 |
tissue |
NM |
24 |
5 |
0 |
21 |
1.00 |
0.81 |
4 |
Le |
2012 |
China |
Asian |
Lung cancer |
82/50 |
blood |
0.810 |
70 |
14 |
12 |
36 |
0.85 |
0.72 |
5 |
Hamamoto |
2013 |
Japan |
Asian |
SCC |
25/54 |
tissue |
NM |
19 |
20 |
6 |
34 |
0.76 |
0.63 |
6 |
|
|
|
|
SCC |
44/44 |
tissue |
NM |
38 |
17 |
6 |
27 |
0.86 |
0.62 |
|
Molina-Pinelo |
2014 |
Spain |
Caucasian |
SCC |
25/19 |
tissue |
NM |
25 |
5 |
0 |
14 |
1.00 |
0.76 |
4 |
Shen |
2014 |
USA |
Caucasian /African |
Lung cancer |
66/68 |
blood |
0.620 |
36 |
26 |
30 |
42 |
0.55 |
0.62 |
6 |
Huang |
2014 |
China |
Asian |
SCC |
45/152 |
tissue |
0.983 |
43 |
3 |
2 |
149 |
0.96 |
0.98 |
6 |
Patnaik |
2015 |
USA |
Caucasian |
SCC |
28/49 |
tissue |
0.910 |
23 |
9 |
5 |
40 |
0.82 |
0.82 |
5 |
Halvorsen |
2016 |
Norway |
Caucasian |
Lung cancer |
100/58 |
blood |
0.800 |
93 |
32 |
7 |
26 |
0.93 |
0.44 |
6 |
Zaporozhchenko |
2016 |
Russia |
Caucasian |
SCC |
53/50 |
serum |
0.684 |
41 |
14 |
12 |
36 |
0.78 |
0.72 |
6 |
SCC, squamous-cell lung carcinomas; NM, not mentioned; AUC, area under ROC curve; TP, true positive; FP, false positive; FN, false negative; TN, true negative; SEN, sensitivity; SPE, specificity; QUADAS, Quality Assessment of Diagnostic Accuracy Studies.
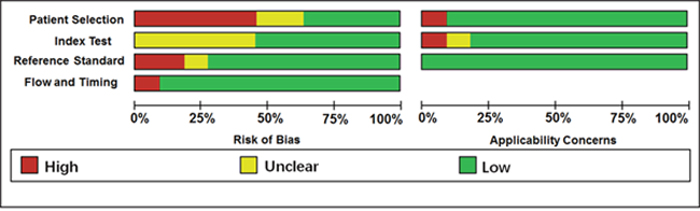
Figure 2: Quality assessment of diagnostic accuracy for the included studies.
Diagnostic accuracy of miR-205 for lung cancer
The pooled results of sensitivity, specificity, diagnostic odds ratio (DOR), and the area under the summary receiver operator characteristic curve (AUC) were 0.88, 0.78, 25.86, and 0.90, respectively (Table 2, Figures 3 and 4), revealing that miR-205 achieved a relatively high overall accuracy for detection of lung cancer. The combined positive likelihood ratio (PLR) and negative likelihood ratio (NLR) were 4.00 and 0.16, respectively, which further suggested that miR-205 has sufficient power to confirm or exclude lung cancer (Table 2, Figure 3). Nevertheless, the I2 values of pooled sensitivity and specificity were 89.45 % and 89.80 %, respectively, indicating that there is a significant heterogeneity among the included studies.
Table 2: Summary results for diagnostic accuracy of miR-205 for lung cancer
Analysis |
N |
SEN(95% CI) |
SPE(95% CI) |
PLR(95% CI) |
NLR(95% CI) |
DOR(95% CI) |
AUC(95% CI) |
|---|---|---|---|---|---|---|---|
Ethnicity |
|
|
|
|
|
|
|
Asian |
4 |
0.88(0.77-0.94) |
0.81(0.52-0.94) |
4.59 (1.42-14.90) |
0.15(0.06-0.36) |
30.43(4.16-222.26) |
0.91(0.89-0.93) |
non-Asian |
8 |
0.89(0.73-0.96) |
0.76(0.65-0.85) |
3. 75 (2.38-5.90) |
0.14(0.05-0.40) |
26.56(7.19-98.17) |
0.88(0.84-0.90) |
Specimen |
|
|
|
|
|
|
|
tissue |
7 |
0.92(0.84-0.97) |
0.83(0.69-0.92) |
5.56 (2.75-11.26) |
0.09(0.04-0.22) |
60.35(14.59-249.67) |
0.95(0.93-0.97)* |
blood |
5 |
0.78(0.62-0.88) |
0.69(0.54-0.81) |
2.54 (1.72-3.76) |
0.32(0.19-0.54) |
8.01(3.92-16.35) |
0.80(0.76-0.83)* |
Size |
|
|
|
|
|
|
|
>100 |
5 |
0.85(0.69-0.94) |
0.77(0.50-0.92) |
3.66 (1.35-9.95) |
0.19(0.07-0.51) |
19.07(3.00-121.20) |
0.89(0.86-0.91) |
≤100 |
7 |
0.91(0.75-0.97) |
0.79(0.69-0.86) |
4.24 (2.78-6.49) |
0.12(0.04-0.35) |
35.16(9.78-126.44) |
0.89(0.86-0.91) |
Overall |
12 |
0.88(0.78-0.94) |
0.78(0.66-0.86) |
4.00(2.47-6.49) |
0.16(0.08-0.30) |
25.86(9.29-71.95) |
0.90(0.87-0.92) |
N, number of studies; SEN, sensitivity; 95% CI, 95% confidence interval; SPE, specificity; PLR, positive likelihood ratio; NLR, negative likelihood ratio; DOR, diagnostic odds ratio; AUC, area under ROC curve; *statistically significant results.
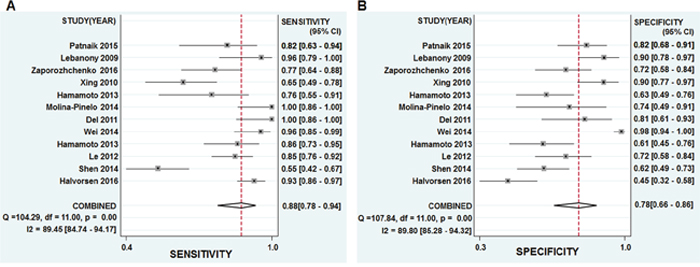
Figure 3: Forest plots of sensitivities and specificities from test accuracy studies of miR-205 in the diagnosis of lung cancer.
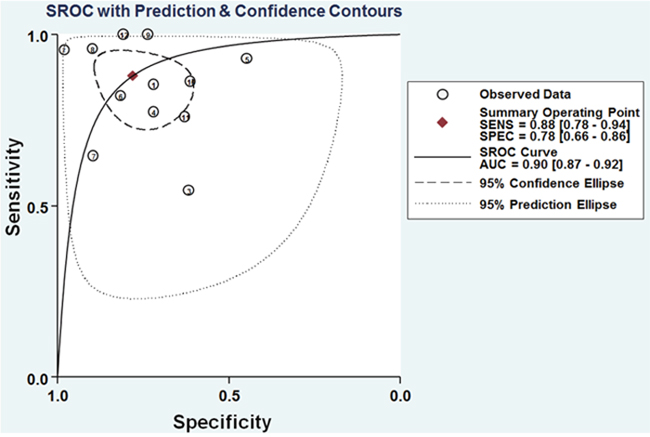
Figure 4: SROC curves of miR-205 for the diagnosis of lung cancer.
Nomogram of Fagan was used to estimate the clinical diagnostic values of miR-205 in detection of lung cancer. In details, for any people with a pre-test probability of 25 % of patients with lung cancer, positive results of miR-205 show the post-test probability of correctly diagnosing cancer would rise to 57%, while negative results of miR-205 mean the post-test probability would drop to 5 % (Figure 5). Thus, miR-205 is an important diagnostic biomarker for lung cancer.
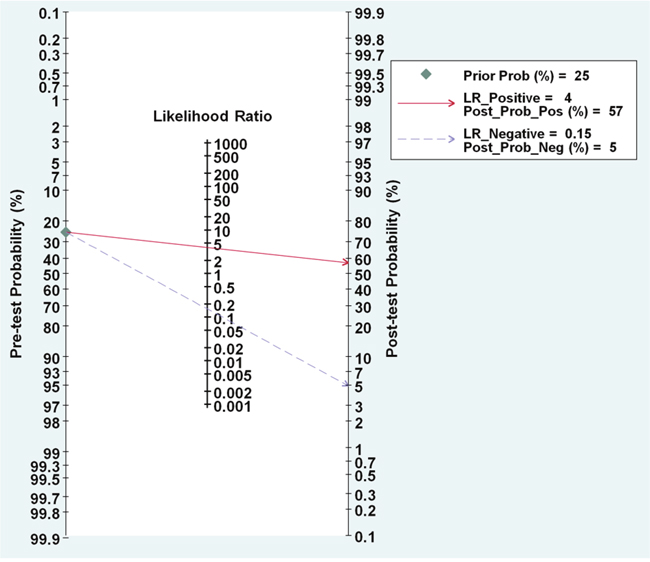
Figure 5: Nomogram of Fagan describes the probability miR-205 to confirm or exclude lung cancer patients.
Diagnostic threshold effect
The threshold effect caused by differences in the sensitivity and specificity is a major source of heterogeneity in diagnostic tests. Hence, spearman correlation coefficient of sensitivity and specificity was calculated to assess threshold effect. According to the analysis, spearman correlation coefficient in total 12 studies was 0.33, with a P value of 0.11 (P > 0.05), which indicated that the heterogeneity was not caused by the threshold effect.
Subgroup analysis
Subgroup analysis was performed based on ethnicity (Asian vs. Non-Asian), specimens (tissue vs. blood), and sample size (≤ 100 vs > 100) (Table 2). There was no obvious significance between Asian and non-Asian population. The subgroup analysis based on specimens indicated tissue samples have better diagnostic accuracy than blood samples for lung cancer, with sensitivity of 0.92 versus 0.78, specificity of 0.83 versus 0.69, PLR of 5.56 versus 2.54, NLR of 0.09 versus 0.32, DOR of 60.35 versus 8.01, and AUC of 0.95 versus 0.80, respectively. Meanwhile, a large sample size exhibited the similar diagnostic accuracy to studies on a small sample size.
Sensitivity analysis and publication bias
Sensitivity analysis was conducted and 1 outliner was found (Figure 6). After exclusion, the sensitivity changed from 0.88 to 0.87, specificity increased from 0.78 to 0.73, showing that there were no significant changes with our overall analysis. Combined with goodness of fit and bivariate normality analyses, we confirmed the robustness of our meta-analysis.
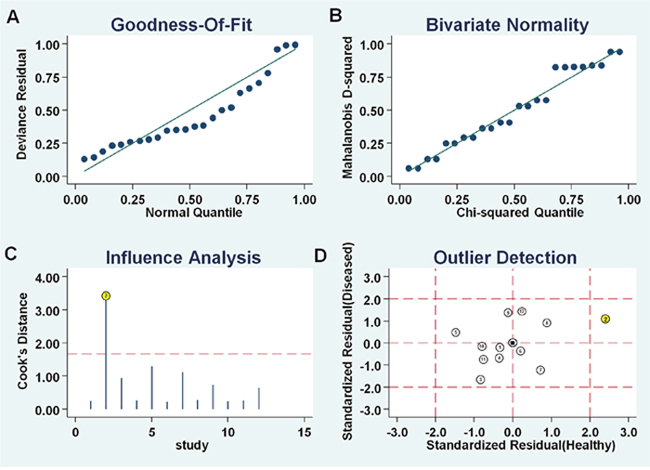
Figure 6: Influence analysis and outlier detection. (A) goodness of fit, (B) bivariate normality, (C) influence analysis, and (D) outlier detection.
Deeks’ funnel plot was performed to evaluate the publication bias of the included studies. The funnel plots of diagnostic results indicated no obvious publication bias in this diagnostic meta-analysis (Figure 7). The P value of Deek’s test was 0.54.
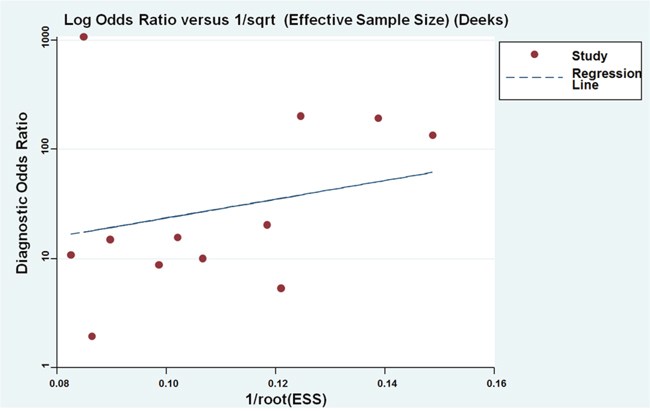
Figure 7: Funnel plots for the assessment of potential diagnosis bias in miR-205 assays.
Prognostic meta-analysis
Study characteristics and quality assessment
The main features of the 6 included studies for prognosis are listed in Table 3. There were 756 participants in the 6 qualified studies. Of these studies, 2 studies investigated overall survival (OS) of lung patients, 1 reported recurrence-free survival (RFS), and 3 focused on OS as well as disease-free survival (DFS)/RFS of patients. For ethnicity, 3 studies investigated Caucasian, 2 evaluated Asian, and 1 focused on Caucasian and African. For cancer type, 4 studies focused on NSCLC, 1 focused on SCLC, and 1 focused on lung cancer. The follow-up time ranged from 9.9 months to 60 months. Five studies detected the expression of miR-205 in tissue samples except Le’s study [26], which determined its expression in blood samples. The quality of the included studies was assessed by Newcastle–Ottawa Quality Assessment Scale (NOS, Supplementary Figure 2), and the quality score ranged from 5 to 7. Thus, all the included studies were regarded as moderate and high quality (Figure 8 and Table 3).
Table 3: Characteristics and quality assessment of prognostic clinical trials included in the meta-analysis
Author |
Year |
Country |
Ethnicity |
Cancer type |
Number |
Specimen |
Results |
Cut off |
Follow-up (month) |
P |
HR |
LL |
UP |
NOS |
|---|---|---|---|---|---|---|---|---|---|---|---|---|---|---|
Markou |
2008 |
Greece |
Caucasian |
NSCLC |
48 |
tissue |
OS |
2.0 |
50 |
0.610 |
1.27 |
0.52 |
3.13 |
5 |
|
|
|
|
|
|
|
DFS |
2.0 |
50 |
0.476 |
1.32 |
0.62 |
2.86 |
5 |
Zhang |
2012 |
China |
Asian |
NSCLC |
105 |
tissue |
OS |
Mean |
16.25 |
<0.001 |
42.33 |
1.51 |
148.52 |
6 |
Le |
2012 |
China |
Asian |
NSCLC |
82 |
serum |
OS |
Mean |
30 |
0.689 |
1.23 |
0.45 |
3.37 |
7 |
|
|
|
|
|
|
|
DFS |
Mean |
30 |
0.169 |
0.5 |
0.18 |
1.35 |
7 |
Lu |
2012 |
USA |
Caucasian |
lung cancer |
357 |
tissue |
RFS |
Mean |
60 |
0.005 |
0.85 |
0.77 |
0.95 |
5 |
Begum |
2015 |
USA |
Caucasian/African |
NSCLC |
114 |
tissue |
RFS |
Mean |
46.3 |
0.459 |
1.22 |
0.72 |
2.06 |
7 |
|
|
|
|
|
|
|
OS |
Mean |
46.3 |
0.228 |
1.39 |
0.81 |
2.35 |
7 |
Mancuso |
2016 |
Italy |
Caucasian |
SCLC |
50 |
cytologic samples |
OS |
Median |
9.9 |
0.226 |
1.46 |
0.79 |
2.69 |
7 |
SCLC, small cell lung cancer; NSCLC, non-small cell lung cancer; DFS, disease-free survival; OS, overall survival; RFS, recurrence-free survival; HR, hazard ratio; LL, lower limit of 95% confidence interval; UL, upper limit of 95% confidence interval; NOS, Newcastle–Ottawa Quality Assessment Scale.
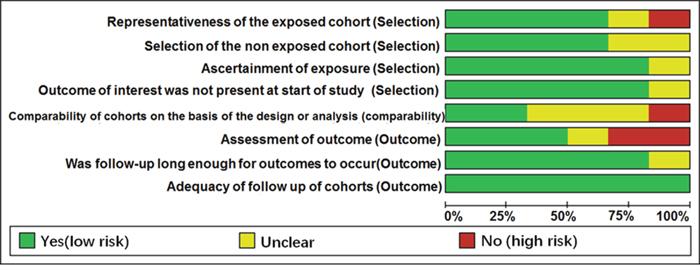
Figure 8: Quality assessment of prognostic accuracy for the included studies.
Correlation between miR-205 expression and OS
A total of 5 studies were used for OS analysis. Moderate heterogeneity was found among the studies on miR-205 (P = 0.075, I2= 53 %). Therefore, the pooled hazard ratio (HR) was summarized by using a random-effect model. Our results failed to demonstrate any significant association between miR-205 expression and OS (pooled HR = 1.61, 95% CI: 0.93 – 2.81, z=1.69, P = 0.091, Figure 9A).
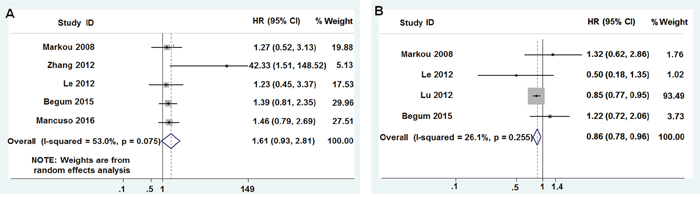
Figure 9: Forest plots of studies evaluating the miR-205 expression level and prognosis. (A) Survival data are reported as overall survival (OS) and (B) relapse-free survival (RFS) or disease-free survival (DFS).
Correlation between miR-205 expression and DFS/RFS
A total of 4 studies were used for DFS/RFS analysis. Low heterogeneity was found among the studies on miR-205 (P=0.255, I2=26.1%). Therefore, the pooled HR was summarized by using a fixed-effect model. Our results indicated that the increased miR-205 expression had a protective role in the prognosis of patients with lung cancer (pooled HR=0.86, 95% CI: 0.78-0.96, z=2.83, P=0.005, Figure 9B).
Publication bias
Egger’s test was applied to assess the publication bias. The P values of Egger’s test for OS and DFS/RFS were 0.144 and 0.648, respectively, suggesting no obvious publication bias exists in this meta-analysis. However, a low sensitivity will be found in the results of the Begg’s test when the number of eligible studies is < 10 [38], so it was not used for this study.
DISCUSSION
Recently, the application of miRNAs as biomarkers for cancer diagnosis and prognosis has gained much attention in recent years [39]. Accumulating evidence supports that their abnormal expression levels associated with various tumors, such as lung cancer, breast cancer, and cervical cancer [40, 41]. More importantly, miRNAs are extremely stable and present in various biological materials, like serum, plasma, and tissue. MiRNAs are also easy to be measured by means of multiple methods [42, 43]. Therefore, miRNAs can be used as reliable biomarkers for diagnosis and prognosis of cancer. In this study, we demonstrated that miR-205 is overexpressed in patients with lung cancer, which is a promising biomarker for diagnosis and prognosis of lung cancer.
MiR-205 is a diagnostic biomarker for lung cancer
Among these tumor-specific miRNAs, miR-205 is one of the most frequently studied miRNAs [18, 23–37, 39]. Dysregulation of miR-205 was observed in many types of cancers, including lung cancer [39]. The expression of miR-205 appears to be tissue or tumor type-specific, which is useful to classify human cancers [44], distinguish tumor subtypes [18], and correlate with prognosis [24]. MiR-205 directly repressed PTEN expression and was upregulated in multiple subtypes of NSCLC [45]. MiRNA profiling of plasma fractions revealed that miR-205 levels increased in tumor-specific exosomes of patients with SCC, but its levels decreased strikingly after surgery [46]. The expression of miR-205 improved the diagnostic sensitivity for patients with SCC compared with no-SCC [18, 30, 31].
The above mentioned studies indicated that miR-205 might serve as a wonderful biomarker for diagnosis of lung cancer [18, 23, 26, 30, 35, 36], but others didn’t support its roles in lung cancer detection [34, 37]. Therefore, we further evaluated the roles of miR-205 in diagnosis of lung cancer and found that miR-205 presented diagnostic sensitivity of 0.88 (95% CI = 0.78 – 0.94), specificity of 0.78 (95% CI = 0.66 – 0.86) and AUC of 0.90 (95% CI = 0.87 – 0.92). These three representative parameters confirmed the accuracy of miR-205 as a promising predictor for examining lung cancer. And our results showed that the DOR value was 25.86, which also proved that miR-205 is a useful biomarker for lung cancer detection.
MiRNA expression varies from different specimens, ethnicities, and cancer types, etc. Here, we demonstrated that miR-205 had precisely diagnostic value in lung cancer by using tissue and blood samples, especially using tissue samples. Similarly, Jiang et al [47] showed that miR-205 expression was significantly higher in NSCLC tissues and serum, which was a good diagnostic biomarker for NSCLC. As to ethnicity, He et al [48] showed that miR-205, as a critical therapeutic target, expressed differently between Chinese patients with prostate cancer and Western patients. Differently in this study, we failed to find an obvious difference between Asian population and non-Asian population.
MiR-205 is a prognostic biomarker for lung cancer
Furthermore, miR-205 is important for the prognosis of patients with lung cancer. It has been identified as a potentially useful predictor of survival for patients with SCLC [29]. Zhang et al [25] found that high levels of miR-205 in patients with SCC lead to an increased probability of mortality, but low expression levels of miR-205 indicated the reduced short term (<10 months) mortality [37]. Lu et al [27] demonstrated that miR-205 was a great potential target for histology-specific treatment or prevention of recurrent lung cancer. The latest findings revealed that miR-205 serves as a potential biomarker for the prognosis of advanced NSCLC, and suppression of miR-205 expression decreased A549 cell biological activity by regulating Akt/mTOR/P21 signaling pathway [39]. However, some studies showed that overexpression of miR-205 had no prognostic implication for patients with NSCLC, since it was not associated with reduced DFS (or OS) and any clinic pathological feature of the patients [26, 28, 31].
To further solve the controversial results of miR-205 in prognosis of lung cancer, for the first time, we conducted this meta-analysis to evaluate the relationship between miR-205 expression and the prognosis of patients with lung cancer. Although several studies supported that increased miR-205 expression may predict a worse OS [25, 49], our results didn’t support this point. On the contrary, the pooled outcome of DFS/RFS analysis in this study demonstrated that that higher miR-205 expression is a promising prognostic factor for lung cancer. Increased miR-205 expression is predictive of a better prognosis, with pooled HR of 0.86, 95% CI: 0.78-0.96, and this association was statistically significant (z = 2.83, P = 0.005). Our finding was supported by Zhang et al [49], who reported that miR-205 was a promising biomarker for predicting the DFS/RFS of patients with breast cancer.
Strengths and limitations of this meta-analysis
This study had several strengths. To our knowledge, we performed a meta-analysis to evaluate the diagnostic and prognostic efficiency of miR-205 for patients with lung cancer for the first time. Moreover, different sample sources were investigated, with the aim of identifying the most suitable one for clinical application. In addition, we used comprehensive methods, including strict literature screening and quality evaluation process, to reduce bias.
Limitations do exist in the meta-analysis. Firstly, the blind design was not used in some diagnostic studies, which affects the diagnostic accuracy. Secondly, the sample size in this meta-analysis was relatively small. Thirdly, considering heterogeneity existed among these studies.
In summary, this study demonstrated that miR-205 may be used as a promising biomarker for diagnosis and prognosis for lung cancer. Our findings require further evaluation in future large-scale prospective studies.
MATERIALS AND METHODS
Literature search
A systematical computerized search was performed for relevant publications that investigated the roles of miR-205 in the diagnosis and prognosis of lung cancer in Embase, PubMed, Web of Science databases, and Ovid platform (up to March 31, 2017) for the terms (“lung cancer” or “lung neoplasms” or “lung tumor” or “lung tumour” or “lung malignancy” or “lung neoplasia”) and (“microRNA-205” or “miRNA-205” or “miR-205” or “hsa-miR-205”). We further manually searched the bibliographies of articles to identify the missed suitable articles.
Literature selection
The included studies in this meta-analysis satisfied all of the following inclusion criteria: (1) patients with lung cancer; (2) the expression levels of miR-205 in blood, serum, plasma, cytologic samples, or lung cancer tissues; and (3) sufficient data on the association between miR-205 expression levels and lung cancer diagnosis or prognosis. The exclusion criteria were as follows: (1) duplicate publications; (2) review paper, case report, letter, and meta-analysis; (3) unqualified data; and (4) non-English publications.
Data extraction
Two reviewers (Jing-Hua Li and Shan-Shan Sun) independently carefully reviewed the full text and extracted the relevant data. A third person (Ning Li) resolved the differences until all arrived at a set of similar statements. After that, the following data were extracted from each study: name of the first author, published year, country, study population characteristics (ethnicity, sample size, cancer types, specimen, follow-up time, and source of control), and relevant data for meta-analysis. For diagnostic studies, data of two-by-two tables were extracted, including false negatives (FN), true negatives (TN), true positives (TP), and false positives (FP) etc. For prognostic studies, HR of miR-205 for OS, RFS and DFS, with corresponding 95% CIs and P value were directly extracted from the studies, or extracted from the Kaplan-Meier curves by using a method as Tierney’s study [50].
Quality assessment
The methodological quality assessment of diagnostic study was conducted by independent team members according to the guidelines of the QUADAS-2 tool [40], which is composed of 7 item check list, and each item will be assessed as 1 score (“yes”), 0 score (“no” / “unclear”). For prognostic studies, NOS was applied to assess the quality of observational studies [51]. It consists of the following 3 parts: selection (4 items), comparability (2 items) and outcome (3 items). Thus, the quality of study was determined on a scale ranged from 0 to 9 points. Studies with seven or more points were regarded as high quality [52].
Statistical analysis
Meta-analysis was conducted using STATA 13.0 (Stata Corporation: College Station, TX, USA) and Review Manager 5.3 (Copenhagen: Nordic Cochrane Centre, the Cochrane Collaboration, 2014) software. The bivariate meta-analysis model was employed to calculate the pooled results of sensitivity, specificity, PLR, NLR, and DOR along with their 95% CIs, and generate the summary receiver operator characteristic (SROC) curve. The AUC represents an analytical summary of test performance [53, 54]. Moreover, the amount heterogeneity among studies caused by the threshold effects was examined using spearman correlation coefficient [55]. The non-threshold effect was assessed by the Cochran’s-Q and I-squared statistics index. A low P value (< 0.05) for heterogeneity or high I-squared (> 50%) suggests presence of heterogeneity caused by non-threshold effect. If the heterogeneity caused by non-threshold effects existed, stratified analysis (ethnicity, specimen types, and sample size) would be used to explore the sources of heterogeneity. The Fagan’s nomogram was conducted to explore the clinical diagnostic value of miR-205 in detection of cancer. The Deek’s funnel plot method was used to explore publication bias, with P < 0.05 indicates obvious publication bias.
For the prognostic meta-analysis, HRs and their 95% CIs were used to assess the impact of miR-205 expression on survival of patients with lung cancer. Cochran’s-Q and I-squared statistics index were used to assess the heterogeneity of the pooled results. A low P value (< 0.05) for heterogeneity or high I-squared (> 50%) suggests that the random-effects model would be applied, otherwise, the fixed-effects model was used. Moreover, the Begg’s test and Egger’s test were used to check the publication bias. All values of the P < 0.05 were considered represent statistical significance.
FUNDING
This study was supported by the National Natural Science Foundation of China Grant (Nos. 31371321, 31440061), the Shandong Science and Technology Committee (Nos. ZR2016CL09, 2015GSF118073), and Shandong Province Taishan Scholar Program.
CONFLICTS OF INTEREST
The authors declare no conflicts of interest.
REFERENCES
1. Yang J, Zhu J, Zhang YH, Chen YS, Ding LL, Kensler TW, Chen JG. Lung cancer in a rural area of China: rapid rise in incidence and poor improvement in survival. Asian Pac J Cancer Prev. 2015; 16:7295-7302.
2. DeSantis CE, Lin CC, Mariotto AB, Siegel RL, Stein KD, Kramer JL, Alteri R, Robbins AS, Jemal A. Cancer treatment and survivorship statistics, 2014. CA Cancer J Clin. 2014; 64:252-271.
3. Wink KC, Roelofs E, Solberg T, Lin L, Simone CB 2nd, Jakobi A, Richter C, Lambin P, Troost EG. Particle therapy for non-small cell lung tumors: where do we stand? A systematic review of the literature. Front Oncol. 2014; 4:292.
4. Miller YE. Pathogenesis of lung cancer: 100 year report. Am J Resp Cell Mol Biol. 2005; 33:216-223.
5. Siegel RL, Miller KD, Jemal A. Cancer Statistics, 2017. CA Cancer J Clin. 2017; 67:7-30.
6. Jemal A, Ma J, Rosenberg PS, Siegel R, Anderson WF. Increasing lung cancer death rates among young women in southern and midwestern States. J Clin Oncol. 2012; 30:2739-2744.
7. Manegold C. Treatment algorithm in 2014 for advanced non-small cell lung cancer: therapy selection by tumour histology and molecular biology. Adv Med Sci. 2014; 59:308-313.
8. Shaw AT, Kim DW, Nakagawa K, Seto T, Crino L, Ahn MJ, De Pas T, Besse B, Solomon BJ, Blackhall F, Wu YL, Thomas M, O'Byrne KJ, et al. Crizotinib versus chemotherapy in advanced ALK-positive lung cancer. N Engl J Med. 2013; 368:2385-2394.
9. Charkiewicz R, Niklinska W, Zalewski G, Charkiewicz A, Kozlowski M, Sulewska A, Chyczewski L. New monoallelic combination of KRAS gene mutations in codons 12 and 13 in the lung adenocarcinoma. Adv Med Sci. 2013; 58:83-89.
10. Fang YX, Gao WQ. Roles of microRNAs during prostatic tumorigenesis and tumor progression. Oncogene. 2014; 33:135-147.
11. Visone R, Croce CM. MiRNAs and cancer. Am J Pathol. 2009; 174:1131-1138.
12. Wu Y, Crawford M, Mao Y, Lee RJ, Davis IC, Elton TS, Lee LJ, Nana-Sinkam SP. Therapeutic delivery of microRNA-29b by cationic lipoplexes for lung cancer. Mol Ther Nucleic Acids. 2013; 2:e84.
13. Lei L, Huang Y, Gong W. miR-205 promotes the growth, metastasis and chemoresistance of NSCLC cells by targeting PTEN. Oncol Rep. 2013; 30:2897-2902.
14. Miao LJ, Huang SF, Sun ZT, Gao ZY, Zhang RX, Liu Y, Wang J. MiR-449c targets c-Myc and inhibits NSCLC cell progression. FEBS Lett. 2013; 587:1359-1365.
15. Mallick R, Patnaik SK, Yendamuri S. MicroRNAs and lung cancer: biology and applications in diagnosis and prognosis. J Carcinog. 2010; 9:8.
16. Yang J, Zhang JY, Chen J, Xu Y, Song NH, Yin CJ. Prognostic role of microRNA-221 in various human malignant neoplasms: a meta-analysis of 20 related studies. PLoS One. 2014; 9:e87606.
17. Yu L, Todd NW, Xing L, Xie Y, Zhang H, Liu Z, Fang H, Zhang J, Katz RL, Jiang F. Early detection of lung adenocarcinoma in sputum by a panel of microRNA markers. Int J Cancer. 2010; 127:2870-2878.
18. Lebanony D, Benjamin H, Gilad S, Ezagouri M, Dov A, Ashkenazi K, Gefen N, Izraeli S, Rechavi G, Pass H, Nonaka D, Li J, Spector Y, et al. Diagnostic assay based on hsa-miR-205 expression distinguishes squamous from nonsquamous non-small-cell lung carcinoma. J Clin Oncol. 2009; 27:2030-2037.
19. Yanaihara N, Caplen N, Bowman E, Seike M, Kumamoto K, Yi M, Stephens RM, Okamoto A, Yokota J, Tanaka T, Calin GA, Liu CG, Croce CM, Harris CC. Unique microRNA molecular profiles in lung cancer diagnosis and prognosis. Cancer Cell. 2006; 9:189-198.
20. Bai J, Zhu X, Ma J, Wang W. miR-205 regulates A549 cells proliferation by targeting PTEN. Int J Clin Exp Pathol. 2015; 8:1175-1183.
21. Liu H, Park J, Manning C, Goehlmann HW, Marshall DJ. Metastatic signature in lung cancer is associated with sensitivity to anti-integrin alpha(V) monoclonal antibody intetumumab. Genes Chromosomes Cancer. 2014; 53:349-357.
22. Larzabal L, de Aberasturi AL, Redrado M, Rueda P, Rodriguez MJ, Bodegas ME, Montuenga LM, Calvo A. TMPRSS4 regulates levels of integrin alpha5 in NSCLC through miR-205 activity to promote metastasis. Br J Cancer. 2014; 110:764-774.
23. Patnaik S, Mallick R, Kannisto E, Sharma R, Bshara W, Yendamuri S, Dhillon SS. MiR-205 and MiR-375 microRNA assays to distinguish squamous cell carcinoma from adenocarcinoma in lung cancer biopsies. J Thorac Oncol. 2015; 10:446-453.
24. Markou A, Tsaroucha EG, Kaklamanis L, Fotinou M, Georgoulias V, Lianidou ES. Prognostic value of mature microRNA-21 and microRNA-205 overexpression in non-small cell lung cancer by quantitative real-time RT-PCR. Clin Chem. 2008; 54:1696-1704.
25. Zhang YK, Zhu WY, He JY, Chen DD, Huang YY, Le HB, Liu XG. miRNAs expression profiling to distinguish lung squamous-cell carcinoma from adenocarcinoma subtypes. J Cancer Res Clin Oncol. 2012; 138:1641-1650.
26. Le HB, Zhu WY, Chen DD, He JY, Huang YY, Liu XG, Zhang YK. Evaluation of dynamic change of serum miR-21 and miR-24 in pre- and post-operative lung carcinoma patients. Med Oncol. 2012; 29:3190-3197.
27. Lu Y, Govindan R, Wang L, Liu PY, Goodgame B, Wen W, Sezhiyan A, Pfeifer J, Li YF, Hua X, Wang Y, Yang P, You M. MicroRNA profiling and prediction of recurrence/relapse-free survival in stage I lung cancer. Carcinogenesis. 2012; 33:1046-1054.
28. Begum S, Hayashi M, Ogawa T, Jabboure FJ, Brait M, Izumchenko E, Tabak S, Ahrendt SA, Westra WH, Koch W, Sidransky D, Hoque MO. An integrated genome-wide approach to discover deregulated microRNAs in non-small cell lung cancer: clinical significance of miR-23b-3p deregulation. Sci Rep. 2015; 5:13236.
29. Mancuso G, Bovio E, Rena O, Rrapaj E, Mercalli F, Veggiani C, Paganotti A, Andorno S, Boldorini R. Prognostic impact of a 3-MicroRNA signature in cytological samples of small cell lung cancer. Cancer Cytopathol. 2016; 124:621-629.
30. Xing L, Todd NW, Yu L, Fang H, Jiang F. Early detection of squamous cell lung cancer in sputum by a panel of microRNA markers. Mod Pathol. 2010; 23:1157-1164.
31. Del Vescovo V, Cantaloni C, Cucino A, Girlando S, Silvestri M, Bragantini E, Fasanella S, Cuorvo LV, Palma PD, Rossi G, Papotti M, Pelosi G, Graziano P, et al. miR-205 expression levels in nonsmall cell lung cancer do not always distinguish adenocarcinomas from squamous cell carcinomas. Am J Surg Pathol. 2011; 35:268-275.
32. Hamamoto J, Soejima K, Yoda S, Naoki K, Nakayama S, Satomi R, Terai H, Ikemura S, Sato T, Yasuda H, Hayashi Y, Sakamoto M, Takebayashi T, Betsuyaku T. Identification of microRNAs differentially expressed between lung squamous cell carcinoma and lung adenocarcinoma. Mol Med Rep. 2013; 8:456-462.
33. Molina-Pinelo S, Gutierrez G, Pastor MD, Hergueta M, Moreno-Bueno G, Garcia-Carbonero R, Nogal A, Suarez R, Salinas A, Pozo-Rodriguez F, Lopez-Rios F, Agullo-Ortuno MT, Ferrer I, et al. MicroRNA-dependent regulation of transcription in non-small cell lung cancer. PLoS One. 2014; 9:e90524.
34. Shen J, Liao J, Guarnera MA, Fang H, Cai L, Stass SA, Jiang F. Analysis of MicroRNAs in sputum to improve computed tomography for lung cancer diagnosis. J Thorac Oncol. 2014; 9:33-40.
35. Huang W, Jin Y, Yuan Y, Bai C, Wu Y, Zhu H, Lu S. Validation and target gene screening of hsa-miR-205 in lung squamous cell carcinoma. Chin Med J (Engl). 2014; 127:272-278.
36. Halvorsen AR, Bjaanaes M, LeBlanc M, Holm AM, Bolstad N, Rubio L, Penalver JC, Cervera J, Mojarrieta JC, Lopez-Guerrero JA, Brustugun OT, Helland A. A unique set of 6 circulating microRNAs for early detection of non-small cell lung cancer. Oncotarget. 2016; 7:37250-37259. https://doi.org/10.18632/oncotarget.9363.
37. Zaporozhchenko IA, Morozkin ES, Skvortsova TE, Ponomaryova AA, Rykova EY, Cherdyntseva NV, Polovnikov ES, Pashkovskaya OA, Pokushalov EA, Vlassov VV, Laktionov PP. Plasma miR-19b and miR-183 as potential biomarkers of lung cancer. PLoS One. 2016; 11:e0165261.
38. Ioannidis JP, Trikalinos TA. The appropriateness of asymmetry tests for publication bias in meta-analyses: a large survey. CMAJ. 2007; 176:1091-1096.
39. Duan B, Guo T, Sun H, Cai R, Rui Q, Xi Z. miR-205 as a biological marker in non-small cell lung cancer. Biomed Pharmacother. 2017; 91:823-830.
40. Shidfar A, Costa FF, Scholtens D, Bischof JM, Sullivan ME, Ivancic DZ, Vanin EF, Soares MB, Wang J, Khan SA. Expression of miR-18a and miR-210 in normal breast tissue as candidate biomarkers of breast cancer risk. Cancer Prev Res (Phila). 2017; 10:89-97.
41. Su Y, Fang H, Jiang F. Integrating DNA methylation and microRNA biomarkers in sputum for lung cancer detection. Clin Epigenetics. 2016; 8:109.
42. Gautam A, Kumar R, Dimitrov G, Hoke A, Hammamieh R, Jett M. Identification of extracellular miRNA in archived serum samples by next-generation sequencing from RNA extracted using multiple methods. Mol Biol Rep. 2016; 43:1165-1178.
43. Cortez MA, Bueso-Ramos C, Ferdin J, Lopez-Berestein G, Sood AK, Calin GA. MicroRNAs in body fluids—the mix of hormones and biomarkers. Nat Rev Clin Oncol. 2011; 8:467-477.
44. Lu J, Getz G, Miska EA, Alvarez-Saavedra E, Lamb J, Peck D, Sweet-Cordero A, Ebert BL, Mak RH, Ferrando AA, Downing JR, Jacks T, Horvitz HR, Golub TR. MicroRNA expression profiles classify human cancers. Nature. 2005; 435:834-838.
45. Cai J, Fang L, Huang Y, Li R, Yuan J, Yang Y, Zhu X, Chen B, Wu J, Li M. miR-205 targets PTEN and PHLPP2 to augment AKT signaling and drive malignant phenotypes in non-small cell lung cancer. Cancer Res. 2013; 73:5402-5415.
46. Aushev VN, Zborovskaya IB, Laktionov KK, Girard N, Cros MP, Herceg Z, Krutovskikh V. Comparisons of microRNA patterns in plasma before and after tumor removal reveal new biomarkers of lung squamous cell carcinoma. PLoS One. 2013; 8:e78649.
47. Jiang M, Zhang P, Hu G, Xiao Z, Xu F, Zhong T, Huang F, Kuang H, Zhang W. Relative expressions of miR-205-5p, miR-205-3p, and miR-21 in tissues and serum of non-small cell lung cancer patients. Mol Cell Biochem. 2013; 383:67-75.
48. He HC, Han ZD, Dai QS, Ling XH, Fu X, Lin ZY, Deng YH, Qin GQ, Cai C, Chen JH, Jiang FN, Liu X, Zhong WD. Global analysis of the differentially expressed miRNAs of prostate cancer in Chinese patients. BMC Genomics. 2013; 14:757.
49. Zhang JY, Sun MY, Song NH, Deng ZL, Xue CY, Yang J. Prognostic role of microRNA-205 in multiple human malignant neoplasms: a meta-analysis of 17 studies. BMJ Open. 2015; 5:e006244.
50. Tierney JF, Stewart LA, Ghersi D, Burdett S, Sydes MR. Response to: practical methods for incorporating summary time-to-event data into meta. Authors' reply. Trials. 2013; 14:391.
51. Wade R, Corbett M, Eastwood A. Quality assessment of comparative diagnostic accuracy studies: our experience using a modified version of the QUADAS-2 tool. Res Synth Methods. 2013; 4:280-286.
52. Margulis AV, Pladevall M, Riera-Guardia N, Varas-Lorenzo C, Hazell L, Berkman ND, Viswanathan M, Perez-Gutthann S. Quality assessment of observational studies in a drug-safety systematic review, comparison of two tools: the Newcastle-Ottawa Scale and the RTI item bank. Clin Epidemiol. 2014; 6:359-368.
53. Reitsma JB, Glas AS, Rutjes AW, Scholten RJ, Bossuyt PM, Zwinderman AH. Bivariate analysis of sensitivity and specificity produces informative summary measures in diagnostic reviews. J Clin Epidemiol. 2005; 58:982-990.
54. Rutter CM, Gatsonis CA. A hierarchical regression approach to meta-analysis of diagnostic test accuracy evaluations. Stat Med. 2001; 20:2865-2884.
55. Higgins JP, Thompson SG. Quantifying heterogeneity in a meta-analysis. Stat Med. 2002; 21:1539-1558.