
Introduction
Myelodysplastic syndromes (MDS) are clonal hematopoietic stem cell disorders characterized by ineffective hematopoiesis leading to blood cytopenias, especially anemia, and often evolving to acute myeloid leukemia (AML) [1]. MDS largely predominate in the elderly [2-4]. They are classified based on morphology and blast cell percentage in the blood and the bone marrow [5]. Main prognostic factors of MDS, for progression to AML and survival, include the number and importance of the cytopenia, the percentage of marrow blasts and finally bone marrow cytogenetic abnormalities [6]. Those factors are combined in an International Prognostic Scoring System that distinguishes 4 subgroups with different risk of progression to AML and survival (low, intermediate 1 (int-1), intermediate 2 (int-2) and high). Low and int-1 subgroups are often considered together as favorable or low risk MDS, int-2 and high subgroups are classified as unfavorable or high risk MDS (HR-MDS). IPSS scoring has been recently revised allowing better stratification of MDS patients [7].
Aracytine-based chemotherapy yields complete remission (CR) rates of 50 % in HR-MDS [8], but is limited to a minority of MDS patients, whose age and general condition do not preclude such treatment. In addition, duration of CR is generally short (about 1 year) and most patients relapse. Lower intensity chemotherapy regimens, mainly low dose aracytine have been largely used in elderly MDS patients, with CR and partial remission (PR) rates of only 20% [9-11]. In addition, these chemotherapy regimens have poor efficacy in patients with an unfavourable karyotype [12].
Several consistent studies demonstrated that increased and aberrant gene hyper-methylation occur during progression from low to high-risk MDS [13]. Based on the hypothesis that hyper-methylation might favour leukemogenesis by silencing tumor suppressor genes, demethylating agents including AZA have been introduced for the treatment of MDS with the aim to antagonize this process [14, 15]. Two phase-III studies demonstrated a survival benefit of AZA over conventional care regimen [16, 17]. Nevertheless, only 50 to 60% of the patients respond to AZA and most of responders relapse within 12 to 15 months. In relapse or refractory patients, median survival is around 6 months [18]. Therefore new treatments are urgently needed for these patients. In this line, several drugs have been tested in those patients, with so far no demonstrated effect on survival.
To get insight into the mechanisms of AZA resistance, we generated AZA-resistant SKM-1 cells from the parental SKM-1 MDS/AML cell line, initially isolated from a patient with a refractory anemia with an excess of blasts (RAEB-2) in transformation [19]. We described herein, the phenotypic and genotypic features of both SKM1-S and SKM1-R cells. We found that SKM1-R cells exhibit different morphological and phenotypic features as compared to SKM1-S cells, with no global genotypic alterations. Finally, pangenomic profiling of both cell lines shows preferential modulation of genes involved in cell migration, death and survival.
Results and Discussion
Phase contrast images of SKM1-S and SKM1-R cell lines revealed that conversely to SKM1-S cells that grew individually, SKM1-R cells formed clones containing several tens of cells (Figures 1A and B). Fluorescence microscopy experiments confirmed increased size and ploidy in SKM1-R cells stained with both DAPI (blue) and phalloïdine to visualize the actin network (red) (Figure 1E). Electron microscope images also showed that SKM1-R cells exhibited increased size and ploïdy (Figure 1F). As shown on Figure 1 C and D, most of cells exhibited micronuclei, with some cells containing up to eight of these structures (arrows). Finally, quantitative flow cytometry analysis of DNA content indicated that less than 5% of SKM1-S cells were tetraploïd whereas up to 40% of SKM1-R cells exhibited tetraploidy. Importantly, around 20% of SKM1-R cells had an 8N DNA content and 8% had a 16N DNA content (Figure 1F). The same distribution of DNA content was maintained during 96h of culture. In conclusion, SKM1-R cells were found to be near tetraploid as compared to their SKM1-S counterpart, that were hyperdiploid. Besides ploidy, the global caryotype assessed by conventional cytogenetic (Figures 2A and 2B) or SNP array analysis of both cell clones (Figures 2C and 2D) was strictly identical between SKM1-S and SKM1-R cells. Indeed, no evidence of cytogenetic abnormalities and no SNP alterations were found in SKM1-R cells compared to their SKM1-S counterpart. Most of the time, tetraploidy results from the endoduplication of an previously haploid karyotype. This could be indeed the case here, since no other chromosomal abnormalities arose in the SKM1-S versus SKM1-R clone. The reasons underlying tetraploidy in SKM1-R cell is currently unknown. We have shown previously that foretinib, a Polo Like Kinase 1 (PLK1) inhibitor induced polyploidy in an imatinib-resistant K562 cell line via a caspase-2-dependent mechanism [20]. However, PLK1 was found to be expressed at identical levels in SKM1-S and SKM1-R cell lines (results not shown). Although SKM1-R cells have been described previously to exhibit impaired mitochondrial apoptosis in response to AZA[21], caspase-2 expression and activity were not affected in these cells (data not shown). It would be of interest to determine whether AZA triggers caspase-2 activation in SKM1-S and SKM1-R cells and whether foretinib is able to restore cell death in SKM1-R cells.
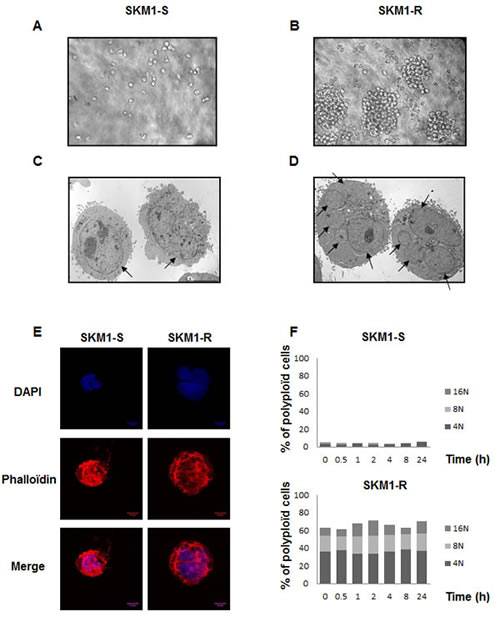
Figure 1: Morphologic features of SKM1-S and SKM1-R cells: Panels A and B: Phase contrast analysis of SKM1-S and SKM1-R cells (X100). Panels C and D: Electron microscopy images of SKM1-S and SKM1-R cells at different magnification (X4000). Panel E: SKM1-S and SKM1-R cells were co-stained with DAPI (blue) and phalloïdine and analyzed by confocal microscopy (red). Panel F: Quantification of ploïdy in SKM1-S and SKM1-R cells: SKM1 cells were washed, fixed in ethanol 70%, and finally left over night at -20°C. The cells were next incubated in PBS, containing 3µg/ml RNase A and 40µg/ml of propidium iodide (PI) for 30min at 4°C. Cell distribution across the different phases of the cell cycle and/or DNA content was analyzed with a Miltenyi cytometer. Histograms represent the percentage of cells with DNA content of 2N, 4N, 8N and 16N
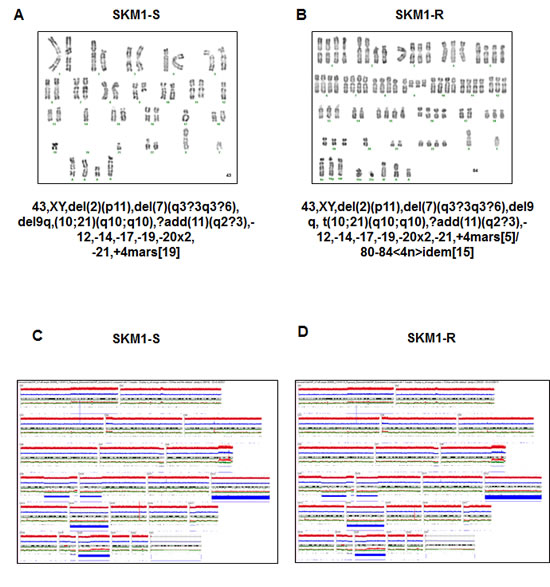
Figure 2: Cytogenetic characteristics of SKM1-S and SKM1-R cells. Panels A and B: Conventional karyotype of SKM1-S and SKM1-R cell lines. Panels C and D: Molecular karyotype of the SKM1-S and SKM1-R cell lines in SNP array.
In addition, long-term incubation of SKM1-S cells with different concentrations of AZA (up to 96h) failed to reproduce tetraploidy suggesting that polyploidy is a feature of AZA-resistant cells but is not a direct consequence of AZA treatment. Interestingly, increased ploidy has been already reported in a multiple myeloma cell line resistant to the proteasome inhibitor bortezomib [22]. In this line, the observation that the SKM1-R cell line is nearly tetraploid could be physiologically relevant. Indeed, it has been reported earlier that the plasma cells of patients who developed bortezomib resistance evolved from hyperdiploidy to tetraploidy [23]. The relationship between tetraploidy and AZA resistance is not clear at present but one could speculate that modulation of gene expression in SKM1-R cells, such as increased cyclin D1 expression that normally lead to mitotic arrest and apoptosis in SKM1-S could be overcome in some SKM1-R cells leading to impaired apoptosis, survival, amplification and abnormal cytokinesis. It has been also reported that tetraploidy is a rare event and a poor pronostic factor in MDS [24]. In line with these findings, it would be interesting to compare if tetraploidy is more frequently observed in primary bone marrow cells from AZA-resistant MDS and AML patients.
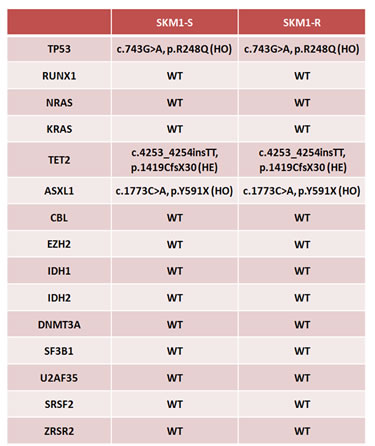
A significant advance in the pathogenesis of myeloid malignancies is the recent discovery of mutations in gene encoding enzymes involved in the regulation of DNA conformation [25-27]. We thus sequenced the 14 most frequently mutated genes in MDS to characterize molecularly our cell lines and to investigate whether long-term treatment of SKM1-R cells with AZA may impact on the frequency of such mutations (for the primer sequences, please refer to sup Table 1). As shown on Table 1, mutations in TP53, TET2 and ASLX1 were detected in both SKM1-S and SKM1-R cells, whereas expression of the other genes tested was not affected. We concluded that AZA does not modify the status of mutations of SKM1 cells. Interestingly, mutations of both TET2 and ASLX1 were found in SKM-1 cells, as it is the case in a significant proportion of MDS and AML patients. Therefore our SKM1-R cell line represents an excellent cell line model, to investigate the mechanisms of AZA resistance but to decipher the functional roles of TET2 and ASXL1 in the context of MDS.
Table 1: Analysis of the most frequently MDS-associated gene mutations in SKM1-S and SKM1-R cells.
Finally, to identify genes potentially involved in the resistance of SKM1-R cells to AZA, we performed microarray analysis of both SKM1-S and SKM1-R cells (Figure 3A). Pangenomic profiling revealed up-regulation of a panel of genes involved in cellular movement, cell death and survival, cellular compromise, cellular growth and proliferation (Figure 3B). Our micro-array analysis also evidenced down-regulation of genes required for cell to cell signaling and interaction, free radical scavenging and cellular development in SKM1-R cells (Figure 3C). Finally, supplemental Table 2 shows the list of the best 89 genes discriminating WT from AZA-resistant SKM1 cells. Among them, 80% were down regulated and 20% up regulated. This different pattern of gene expression could be useful to identify and characterize new potential targetable pathways in MDS and to validate new therapeutic strategies for myeloid malignancies.
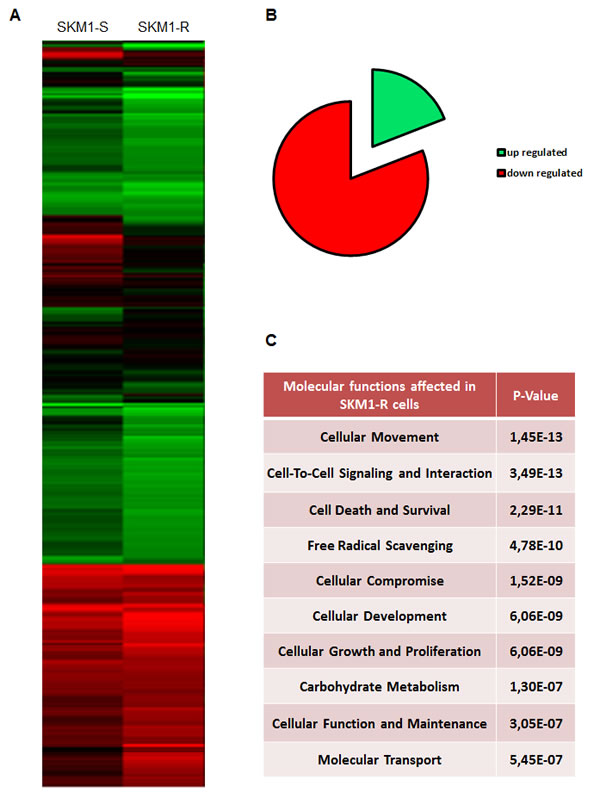
Figure 3: Pangenomic analysis of SKM1-S and SKM1-R cells Panel A: Hierarchical clustering of samples using the best genes discriminating the SKM1-S and SKM1-R cells. RNA samples from SKM1-S and SKM1-R cells (in basal condition) were harvested and expression profiles were determined using pangenomic arrays. Gene expression patterns were determined by the 2-way hierarchical clustering method using the 422 genes selected for discriminating the SKM1-S and SKM1-R cells. Each square represents the expression level of a given gene and sample, colors vary from green to red for the lowest to the highest gene expression levels, respectively. The distance corresponds to a Manhattan distance. Panel B shows the 10 most affected molecular functions in SKM1-R cell. Panel C depicts the repartition of the 89 most regulated genes in SKM1-R versus SKM1-S cells.
Materials and Methods
Electronic microscopy
The cells were fixed with 2% formaldehyde, in 0.1M Na cacodylate, pH 7.4 for 1 h at 41°C. The pellets were rinsed in cacodylate buffer, post-fixed in 1% OsO4 for 1 h, dehydrated through graded alcohols, and embedded in epoxy resin. Oriented 1mm sections were obtained with diamond knives and multiple areas were thin sectioned, mounted on copper mesh grids, and stained with uranyl acetate and lead citrate. Ultrathin sections were examined on a Jeol 1200 XII electron microscope.
Confocal microscopy
The cells prepared for fluorescence staining were grown on glass coverslips. They were washed with ice-cold PBS and were successively fixed and permeabilized with 1% PFA and PBS plus 0.1% Triton X-100, respectively. Then, the cells were incubated for 1 h with phalloidin. Finally, the cells were incubated with 1 mg/ml DAPI, mounted on glass slides in Fluoromount-G (Southern Biotechnology Associates, 0100-01) and photographed with a confocal laser microscope (Carl Zeiss, LSM-510-Meta).
Ploidy and cell cycle analysis
After treatment, the cells were washed, fixed in ethanol 70% and, finally, left overnight at -20°C. Cells were next incubated in PBS, 3 μg/ml RNase A and 40 μg/ml of propidium iodide (PI) for 30 min at 4°C. Cell distribution across the different phases of the cell cycle or DNA content was analyzed with a Miltenyi cytometer [20].
Conventional cytogenetic
Cytogenetic analyses were performed on metaphase cells derived from 24-h unstimulated SKM1-S and SKM1-R cell lines. Complete karyotyping was done with a minimum of 20 metaphases analyzed. Briefly, the cells were synchronized using fluorodeoxyuridine, uridine and thymidine. Colcemid was added to culture (0.05 g/ml) for half an hour. After incubation in hypotonic solution for 30 min (0.075 MKCL), cells were fixed with Carnoby’s solution (3 parts methanol to 1 part glacial acetic acid). After G-banding, karyotypes were interpreted according to the 2009 International System for Human Cytogenetic Nomenclature.
SNP array
We performed genome wide single nucleotide polymorphism (SNP) analysis using SNP 6.0 arrays (Affymetrix, High Wycombe, U.K) on SKM1-S and SKM1-R cell lines. DNA was prepared for hybridization according to the manufacturers’ recommendations. Affymetrix CEL files for each sample were analyzed using the Genotyping Console software (v3.0.2). Genotyping was performed using Birdseed V2 algorithm. Unpaired Copy Number and LOH analysis was performed with Regional GC correction. Copy number and UPD were also analyzed using the Copy Number Analyzer for GeneChip (CNAG version 3.3.0.1) algorithm (http://www.genome.umin.jp/CNAGtop2.html) [28].
Gene expression analyses
Microarray analyses were performed on the GeneChip Human Gene 1.0 ST Array (Affymetrix, Santa Clara, CA 95051, USA), according to the manufacturer’s instructions. Microarray data are archived in GEO, and on the MEDIANTE database developed by the laboratory (Lebrigand and Barbry, bioinformatics 2011). Normalization was performed using RMA and log2 ratio was calculated for 1 different contrast: WT NT versus AZA-R NT. The best discriminating genes were selected using the following threshold: log2 (intensity) >7 in at least one experimental condition and log2 (ratio) >2 for at least one contrast. Hierarchical clustering was done with the Multi-Experiment Viewer (MeV) program, using a Manhattan distance metric and average linkage. Biological theme analysis was performed using Ingenuity Pathway Analysis software™ (IPA™).
Gene mutations analysis
TP53 mutation screening was performed using Sanger sequencing. Exons 5 to 8 of TP53 were amplified from genomic DNA using the intronic primers indicated in Supplemental Table 1. The purified PCR products were sequenced in both directions using the BigDye® Terminator Cycle Sequencing Kit (Applied Bio-systems, Foster City, CA) and analyzed on the Applied Biosystems 3730xl Genetic Analyzer. The Seqscape software version 2.7 (Applied Biosystems) was used to detect sequence variations. Mutations in ASXL1 (exon 12), CBL (exons 8-9), DNMT3A (exons 8-9 and 11-23), IDH1R132, IDH2R140, IDH2R172, N-/K-RAS (exons 2-3), RUNX1 (exons 3-8), and TET2 (exons 3-11) were screened by Sanger sequencing, as previously described [29-36].
Acknowledgements
This work was supported by INSERM, The Ligue Nationale Contre le Cancer (Equipe labellisée 2011-2013), the Association pour la Recherche contre le Cancer (ARC), the Fondation de France (FDF) and by the appel d’offre à projet INCA translationnel 2012-045. We thank the C3M imaging facility and the Labex Signalife.
References
1. Tefferi A and Vardiman JW. Myelodysplastic syndromes. N Engl J Med. 2009; 361(19):1872-1885.
2. Fenaux P. Myelodysplastic syndromes: From pathogenesis and prognosis to treatment. Semin Hematol. 2004; 41(2 Suppl 4):6-12.
3. Mufti G, List AF, Gore SD and Ho AY. Myelodysplastic syndrome. Hematology Am Soc Hematol Educ Program. 2003:176-199.
4. Mufti GJ. Pathobiology, classification, and diagnosis of myelodysplastic syndrome. Best Pract Res Clin Haematol. 2004; 17(4):543-557.
5. Bennett JM, Catovsky D, Daniel MT, Flandrin G, Galton DA, Gralnick HR and Sultan C. Proposals for the classification of the acute leukaemias. French-American-British (FAB) co-operative group. Br J Haematol. 1976; 33(4):451-458.
6. Greenberg P, Cox C, LeBeau MM, Fenaux P, Morel P, Sanz G, Sanz M, Vallespi T, Hamblin T, Oscier D, Ohyashiki K, Toyama K, Aul C, Mufti G and Bennett J. International scoring system for evaluating prognosis in myelodysplastic syndromes. Blood. 1997; 89(6):2079-2088.
7. Greenberg PL, Tuechler H, Schanz J, Sanz G, Garcia-Manero G, Sole F, Bennett JM, Bowen D, Fenaux P, Dreyfus F, Kantarjian H, Kuendgen A, Levis A, Malcovati L, Cazzola M, Cermak J, et al. Revised International Prognostic Scoring System (IPSS-R) for myelodysplastic syndromes. Blood. 2012.
8. Gardin C, Chaibi P, de Revel T, Rousselot P, Turlure P, Miclea JM, Nedellec G and Dombret H. Intensive chemotherapy with idarubicin, cytosine arabinoside, and granulocyte colony-stimulating factor (G-CSF) in patients with secondary and therapy-related acute myelogenous leukemia. Club de Reflexion en Hematologie. Leukemia. 1997; 11(1):16-21.
9. Cheson BD and Simon R. Low-dose ara-C in acute nonlymphocytic leukemia and myelodysplastic syndromes: a review of 20 years’ experience. Semin Oncol. 1987; 14(2 Suppl 1):126-133.
10. Hellstrom-Lindberg E, Robert KH, Gahrton G, Lindberg G, Forsblom AM, Kock Y and Ost A. Low-dose ara-C in myelodysplastic syndromes (MDS) and acute leukemia following MDS: proposal for a predictive model. Leuk Lymphoma. 1994; 12(5-6):343-351.
11. Aul C and Schneider W. The role of low-dose cytosine arabinoside and aggressive chemotherapy in advanced myelodysplastic syndromes. Cancer. 1989; 64(9):1812-1818.
12. Estey EH, Pierce S and Keating MJ. Identification of a group of AML/MDS patients with a relatively favorable prognosis who have chromosome 5 and/or 7 abnormalities. Haematologica. 2000; 85(3):246-249.
13. Jiang Y, Dunbar A, Gondek LP, Mohan S, Rataul M, O’Keefe C, Sekeres M, Saunthararajah Y and Maciejewski JP. Aberrant DNA methylation is a dominant mechanism in MDS progression to AML. Blood. 2009; 113(6):1315-1325.
14. Maio M, Coral S, Fratta E, Altomonte M and Sigalotti L. Epigenetic targets for immune intervention in human malignancies. Oncogene. 2003; 22(42):6484-6488.
15. Ailenberg M and Silverman M. Trichostatin A-histone deacetylase inhibitor with clinical therapeutic potential-is also a selective and potent inhibitor of gelatinase A expression. Biochem Biophys Res Commun. 2002; 298(1):110-115.
16. Fenaux P, Mufti GJ, Hellstrom-Lindberg E, Santini V, Finelli C, Giagounidis A, Schoch R, Gattermann N, Sanz G, List A, Gore SD, Seymour JF, Bennett JM, Byrd J, Backstrom J, Zimmerman L, et al. Efficacy of azacitidine compared with that of conventional care regimens in the treatment of higher-risk myelodysplastic syndromes: a randomised, open-label, phase III study. Lancet Oncol. 2009; 10(3):223-232.
17. Silverman LR, Demakos EP, Peterson BL, Kornblith AB, Holland JC, Odchimar-Reissig R, Stone RM, Nelson D, Powell BL, DeCastro CM, Ellerton J, Larson RA, Schiffer CA and Holland JF. Randomized controlled trial of azacitidine in patients with the myelodysplastic syndrome: a study of the cancer and leukemia group B. J Clin Oncol. 2002; 20(10):2429-2440.
18. Prebet T, Gore SD, Esterni B, Gardin C, Itzykson R, Thepot S, Dreyfus F, Rauzy OB, Recher C, Ades L, Quesnel B, Beach CL, Fenaux P and Vey N. Outcome of high-risk myelodysplastic syndrome after azacitidine treatment failure. J Clin Oncol. 2011; 29(24):3322-3327.
19. Cluzeau T, Robert G, Karsenti J, Luciano F, Puissant A, Raynaud S, Mannone L, Cassuto J, Mounier N and Auberger P. Azacitidine-resistant SKM1 MDS cells are defective for mitochondrial apoptosis and exhibit increased basal autophagy. Leukemia research (MDS Foundation meeting abstracts), May 2011; 231. 2011; Vol 35, Sup 1.
20. Dufies M, Jacquel A, Robert G, Cluzeau T, Puissant A, Fenouille N, Legros L, Raynaud S, Cassuto JP, Luciano F and Auberger P. Mechanism of action of the multikinase inhibitor Foretinib. Cell Cycle. 2011; 10(23):4138-4148.
21. Cluzeau T, Robert G, Puissant A, Jean-Michel K, Cassuto JP, Raynaud S and Auberger P. Azacitidine-resistant SKM1 myeloid cells are defective for AZA-induced mitochondrial apoptosis and autophagy. Cell Cycle. 2011; 10(14):2339-2343.
22. Balsas P, Galan-Malo P, Marzo I and Naval J. Bortezomib resistance in a myeloma cell line is associated to PSMbeta5 overexpression and polyploidy. Leuk Res. 2012; 36(2):212-218.
23. Yuan J, Shah R, Kulharya A and Ustun C. Near-tetraploidy clone can evolve from a hyperdiploidy clone and cause resistance to lenalidomide and bortezomib in a multiple myeloma patient. Leuk Res. 2010; 34(7):954-957.
24. Iyer RV, Sait SN, Matsui S, Block AW, Barcos M, Slack JL, Wetzler M and Baer MR. Massive hyperdiploidy and tetraploidy in acute myelocytic leukemia and myelodysplastic syndrome. Cancer Genet Cytogenet. 2004; 148(1):29-34.
25. Cluzeau T, Robert G, Jacquel A and Auberger P. How Recent Advances in High-Risk Myelodysplastic Syndrome Physiopathology May Impact Future Treatments. Curr Pharm Des. 2013.
26. Bejar R, Stevenson K, Abdel-Wahab O, Galili N, Nilsson B, Garcia-Manero G, Kantarjian H, Raza A, Levine RL, Neuberg D and Ebert BL. Clinical effect of point mutations in myelodysplastic syndromes. N Engl J Med. 2011; 364(26):2496-2506.
27. Yoshida K, Sanada M, Shiraishi Y, Nowak D, Nagata Y, Yamamoto R, Sato Y, Sato-Otsubo A, Kon A, Nagasaki M, Chalkidis G, Suzuki Y, Shiosaka M, Kawahata R, Yamaguchi T, Otsu M, et al. Frequent pathway mutations of splicing machinery in myelodysplasia. Nature. 2011; 478(7367):64-69.
28. Cluzeau T, Moreilhon C, Mounier N, Karsenti JM, Gastaud L, Garnier G, Re D, Montagne N, Gutnecht J, Auberger P, Fuzibet JG, Cassuto JP and Raynaud S. Total genomic alteration as measured by SNP-array-based molecular karyotyping is predictive of overall survival in a cohort of MDS or AML patients treated with azacitidine. Blood Cancer J. 2013; 3:e155.
29. Gelsi-Boyer V, Trouplin V, Adelaide J, Bonansea J, Cervera N, Carbuccia N, Lagarde A, Prebet T, Nezri M, Sainty D, Olschwang S, Xerri L, Chaffanet M, Mozziconacci MJ, Vey N and Birnbaum D. Mutations of polycomb-associated gene ASXL1 in myelodysplastic syndromes and chronic myelomonocytic leukaemia. Br J Haematol. 2009; 145(6):788-800.
30. Dunbar AJ, Gondek LP, O’Keefe CL, Makishima H, Rataul MS, Szpurka H, Sekeres MA, Wang XF, McDevitt MA and Maciejewski JP. 250K single nucleotide polymorphism array karyotyping identifies acquired uniparental disomy and homozygous mutations, including novel missense substitutions of c-Cbl, in myeloid malignancies. Cancer Res. 2008; 68(24):10349-10357.
31. Renneville A, Boissel N, Nibourel O, Berthon C, Helevaut N, Gardin C, Cayuela JM, Hayette S, Reman O, Contentin N, Bordessoule D, Pautas C, Botton S, Revel T, Terre C, Fenaux P, et al. Prognostic significance of DNA methyltransferase 3A mutations in cytogenetically normal acute myeloid leukemia: a study by the Acute Leukemia French Association. Leukemia. 2012; 26(6):1247-1254.
32. Boissel N, Nibourel O, Renneville A, Gardin C, Reman O, Contentin N, Bordessoule D, Pautas C, de Revel T, Quesnel B, Huchette P, Philippe N, Geffroy S, Terre C, Thomas X, Castaigne S, et al. Prognostic impact of isocitrate dehydrogenase enzyme isoforms 1 and 2 mutations in acute myeloid leukemia: a study by the Acute Leukemia French Association group. J Clin Oncol. 2010; 28(23):3717-3723.
33. Boissel N, Nibourel O, Renneville A, Huchette P, Dombret H and Preudhomme C. Differential prognosis impact of IDH2 mutations in cytogenetically normal acute myeloid leukemia. Blood. 2011; 117(13):3696-3697.
34. Braun T, Itzykson R, Renneville A, de Renzis B, Dreyfus F, Laribi K, Bouabdallah K, Vey N, Toma A, Recher C, Royer B, Joly B, Vekhoff A, Lafon I, Sanhes L, Meurice G, et al. Molecular predictors of response to decitabine in advanced chronic myelomonocytic leukemia: a phase 2 trial. Blood. 2011; 118(14):3824-3831.
35. Preudhomme C, Renneville A, Bourdon V, Philippe N, Roche-Lestienne C, Boissel N, Dhedin N, Andre JM, Cornillet-Lefebvre P, Baruchel A, Mozziconacci MJ and Sobol H. High frequency of RUNX1 biallelic alteration in acute myeloid leukemia secondary to familial platelet disorder. Blood. 2009; 113(22):5583-5587.
36. Delhommeau F, Dupont S, Della Valle V, James C, Trannoy S, Masse A, Kosmider O, Le Couedic JP, Robert F, Alberdi A, Lecluse Y, Plo I, Dreyfus FJ, Marzac C, Casadevall N, Lacombe C, et al. Mutation in TET2 in myeloid cancers. N Engl J Med. 2009; 360(22):2289-2301.