
INTRODUCTION
Gastric cancer (GC) is the third leading cause of cancer-related death in men and the fourth in women worldwide. There were approximately 951,600 new GC cases and 723,100 GC-related deaths in 2012 [1]. TNM stage is the most important prognostic factor in GC [2–4]. However, there is variability in clinical course among patients with the same stage disease [5]. Biomarkers are important to predict which patients have a high risk of recurrence.
We recently demonstrated that lymph node ratio (LNR) is an independent prognostic factor in pathological stage III (pStage III) GC patients. Patients with 14th JGCA / 7th UICC pStage IIIC GC and a high LNR had the worst prognosis [6, 7]. The LNR is the ratio of the number of metastatic lymph nodes to the number of dissected lymph nodes [8]. Multi-variate analysis indicated LRN has prognostic value in advanced GC, regardless of stage, and is a more accurate prognostic marker than N stage [5, 9–12]. LNR could also adjust stage migration [5]. The LNR can indicate the success of lymph node dissection and reflect patient immune response [6].
A high LNR is correlated with a poor prognosis in advanced GC patients. We previously found that a high LNR was associated with EGFR expression in advanced GC [13]. However, our study only focused on genes in the first priority group. Here, we investigated the expression of genes in the second, third, and fourth priority groups. Our results indicate the long non-coding RNAs (lncRNAs) H19 and PEG10 are associated with a high LNR. We also demonstrated a mutual relationship between H19 and PEG10 expression, and confirmed that these genes were associated with GC aggressive behavior in vitro.
RESULTS
Verification of the prognostic significance of the LNR in pStage IIIC GC patients
We previously reported that the LNR was a strong independent prognostic factor in patients with stage II/III advanced GC who underwent curative gastrectomy and received postoperative S-1 adjuvant therapy at our institution between 2000 and 2010 [6, 7]. However, this prognostic relevance was restricted to pStage IIIC GC patients. Here, it was evaluated in 37 patients with pStage IIIC GC who were treated at our institution between 2000 and 2010 (Figure 1A, p = 0.001, Supplementary Table 1, 5-year recurrence-free survival [RFS]; LNR < 16.7%, 81.8%; LNR ≥ 16.7%, 17.3%). The results were validated in an independent cohort of 15 similar patients who were treated between 2011 and 2015 (Figure 1B, p = 0.09, Supplementary Table 2). The 5-year RFS rate was 100% in the low LNR group (LNR < 16.7%) and 42.2% in the high LNR group (LNR ≥ 16.7%).
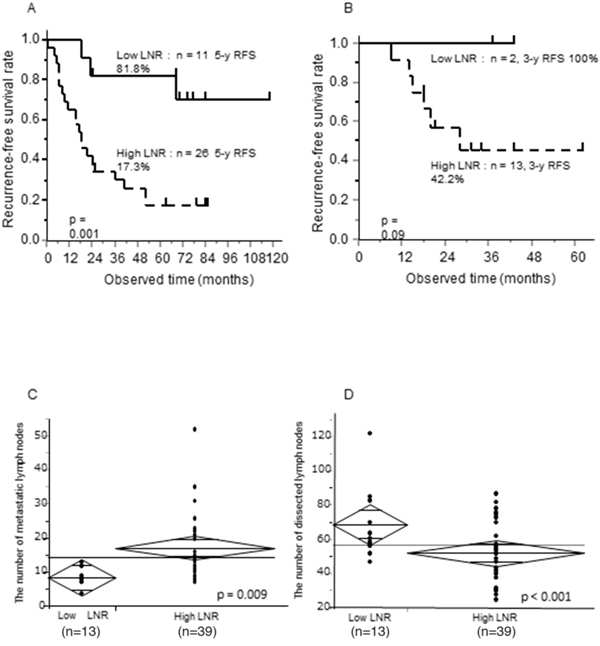
Figure 1: Prognostic significance of the LNR, 5-year RFS according to LNR status, and relationship between the LNR and number of metastatic or dissected lymph nodes in pStage IIIC GC patients. (A, B) Kaplan Meier curves of 5-year RFS according to low or high LNR (LNR cut-off, 16.7%) (A) in pStage IIIC GC patients treated at our institution between 2000 and 2010, and (B) in pStage IIIC GC treated between 2011 and 2015. (C, D) T-tests between the LNR and (C) the number of metastatic lymph nodes or (D) the number of dissected lymph nodes.
We assessed the relationship of the LNR with the number of either dissected or metastatic lymph nodes in pStage IIIC GC patients (Figure 1C and 1D). There was a positive correlation between the number of metastatic lymph nodes and the LNR (p = 0.009), while there was a negative correlation between the number of dissected lymph nodes and the LNR (p < 0.001). These results suggested that the LNR reflected tumor aggressiveness, the host immune response, or stage migration in pStage IIIC GC patients.
Selection of candidate high LNR-associated genes associated in pStage III GC patients
Among the second, third, and fourth priority genes identified in our previous study as strongly associated with high LNR, 18 genes with high expression (raw expression values > 100) were not further evaluated (Figure 2A). Genes in the second, third, and fourth priority groups had raw expression values > 100 in at least one patient in the Affymetrix microarray data. Signals > 100 were reproducibly detected by RT-PCR (Figure 2A) [14]. Data in the red columns represents raw expression values between 100 and 200. Data in the purple columns represents values > 200. We presented an mRNA microarray data to represent the expression of candidate genes with raw expression values > 200 (Figure 2B).
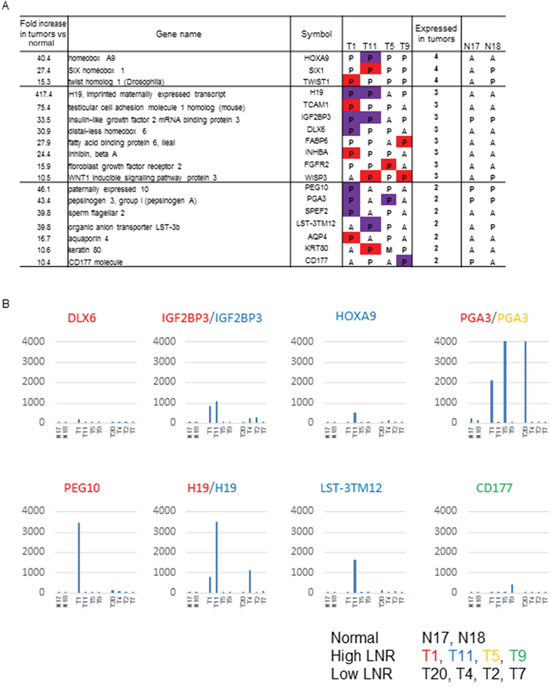
Figure 2: Genes identified as strongly associated with a high LNR in the expression microarray. (A) Genes in the second, third, and fourth priority groups showing a high expression in tumors. The table shows tissue specimens with raw expression of 100 to 200 in red, and ≥ 200 in purple, in the comparison of GC patients with high and low LNRs. P: present, M: marginal, A: absent in expression by microarray. (B) Gene expression values of candidate high LNR-associated genes with FI > 200 in tumor tissue from GC patients with high LNRs (n = 4) (T1, T11, T5, T9; middle group of patients), low LNRs (n = 4) (T20, T4, T2, T7; patient group on the right), and controls (non-cancerous tissue; n = 2) (N17, N18; first two patients). Raw microarray data (uncorrected). The β-catenin signal was reproduciblefrom approximately 4,000 to 10,000. The color of the gene name corresponds to each patient with a high LNR.
The final five candidate genes (PEG10, H19, IGF2BP3, PGA3, and CD177) were selected for the following reasons: PEG10 showed the highest expression in a T1 (high LNR) patient, IGF2BP3 and H19 showed high expression in both T1 and T11 (high LNR) patients, PGA3 showed high expression in both T1 and T3 (high LNR) patients, and CD177 showed the highest expression in a T9 (high LNR) patient. H19 and PGA3 showed high expression in T4 and T20 (low LNR) patients, respectively. However, they were selected because of their high frequency of expression in patients with high LNRs (2/4, 50% vs. 1/4, 25%). These five genes were considered candidate high LNR-associated genes.
Validation of candidate high LNR-associated genes in advanced GC patient tissue samples
We next investigated the relationship between the expression of PEG10, H19, IGF2BP3, PGA3, and CD177 and LNR in 39 patients with pStage III GC who underwent curative gastrectomy at our institution between 2008 and 2011 using RT-PCR. Of the 39 patients, 17 (43.6%) had a high and 22 (56.4%) had a low LNR (Supplementary Table 3). RT-PCR analysis revealed higher H19 and PEG10 expression in the high compared to low LNR group (p = 0.0041 and p = 0.034, respectively) (Figure 3A and 3B). Similar expression of IGF2BP3, PGA3, and CD177 was observed in the high and low LNR groups (Figure 3B). We observed frequent co-expression of H19 and PEG10 (16/39, 41%) (Figure 3B). Mutual relationships were observed between H19 and PEG10, H19 and IGF2BP3, and PEG10 and IGF2BP3 expression (Figure 3B). These correlations in gene expression could be due to selection of genes with high expression in the high LNR group. Thus, H19 and PEG10 were identified as high LNR-associated genes, and their expression was positively correlated in pStage III GC.
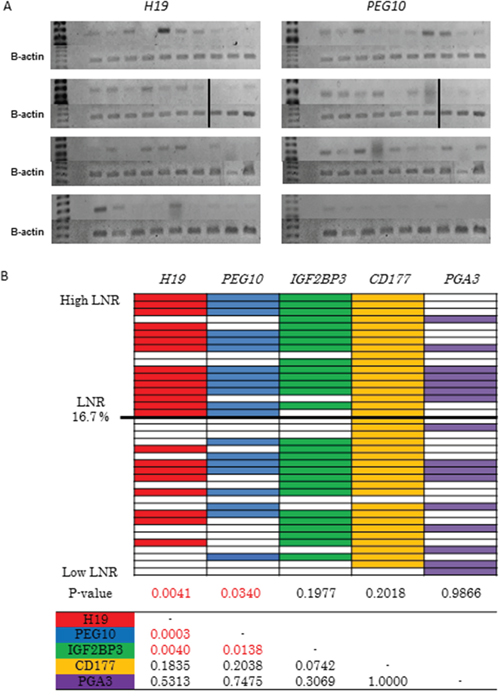
Figure 3: Selection of candidate high LNR-associated genes. (A) Analysis of H19 and PEG10 expression in pStage III GC tissue samples using RT-PCR. Patients are shown in descending order from the upper left to the lower right according to LNR. (B) RT-PCR analysis of the expression of the five candidate high LNR-associated genes in pStage III GC. Patients are shown in descending order from top to bottom according to LNR. Color indicates positive and white indicates negative. P values were calculated using Fisher's exact or chi-square tests. The table shows the relationship between the five candidate genes.
Epigenetic regulation of the H19-PEG10 axis
H19 and PEG10 mRNA expression was investigated in six GC cell lines using RT-PCR and qRT-PCR. H19 was expressed in MKN7 and MKN74 cells, while PEG10 was expressed in MKN7 and KE97 cells (Figure 4A and 4B).
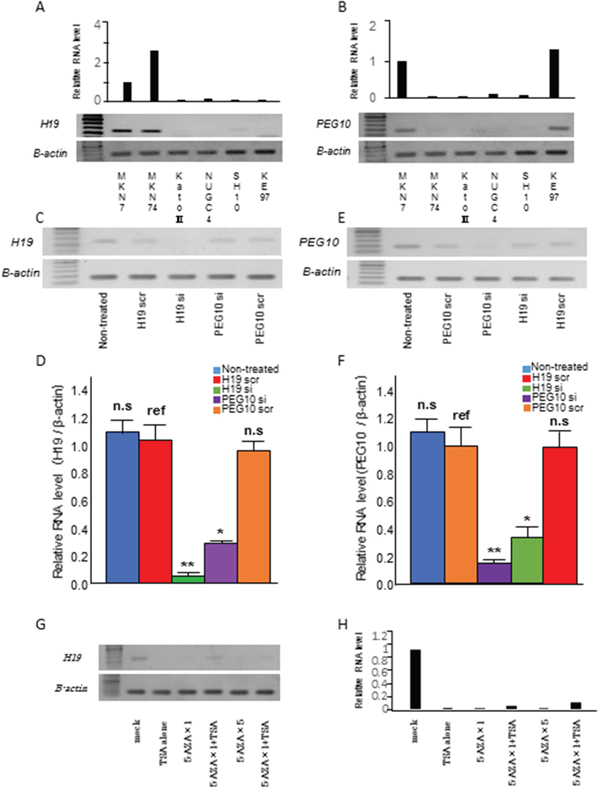
Figure 4: Relationship between H19 and PEG10 in GC cells. (A, B) Analysis of (A) H19 and (B) PEG10 expression in six GC cell lines using qRT-PCR (top) and RT-PCR (bottom). (C, D, E, and F) MKN7 cells that express both H19 and PEG10 were transfected with (C) H19 siRNA (H19 si), (D) H19 scrRNA (H19 scr), (E) PEG10 siRNA (PEG10 si), or (F) PEG10 scrRNA (PEG10 scr). H19 and PEG10 RNA were analyzed using RT-PCR (top) and qRT-PCR (bottom) 48 h post-transfection. T tests were performed to compare the mean values of each RNA between scrambled RNA and siRNA. The numbers represent the mean ± standard deviation (s.d.; n = 3). *p < 0.05, ** p < 0.01. ref: reference, n.s.: not significant. (G and H) Epigenetic regulation of H19 expression in MKN7 cells. H19 expression was analyzed using RT-PCR (G) and qRT-PCR (H) in MKN7 cells treated with the 5-Aza-dC and/or TSA. H19 expression was analyzed after treatment with 300 nM TSA alone, 1 μM 5-Aza-dC, 1 μM 5-Aza-dC and 300 nM TSA, 5 μM 5-Aza-dC, 5 μM 5-Aza-dC and 300 nM TSA were added in order from left to right.
We knocked down endogenous H19 and PEG10 expression in MKN7 cells using siRNA. Knockdown was confirmed using both RT-PCR (Figure 4C and 4E) and qRT-PCR (Figure 4D and 4F). Interestingly, H19 knockdown reduced PEG10 mRNA expression. Conversely, PEG10 knockdown reduced H19 mRNA expression. These data suggested that H19 and PEG10 promoted each other’s expression. PEG10 was not expressed in MKN74 cells despite high expression of H19, while PEG10 was highly expressed in KE97 cells, which did not express H19. These data indicated that the correlation between H19 and PEG10 may not be present in all cancer cell lines.
H19 expression is controlled by methylation of a differentially methylated region (DMR). Therefore, we investigated whether H19 expression was regulated by demethylation and/or histone deacetylation. H19 expression in MKN7 cells was reduced by treatment with a demethylating agent (5-Aza-dC) or histone deacetylase (trichostatin A [TSA]) (Figure 4G and 4H) through an indirect mechanism.
H19 knockdown suppresses proliferation, invasion, and anchorage-independent growth, and decreases chemo-resistance in GC cell lines
We investigated the effects of H19 or PEG10 knockdown in MKN7 and MKN74 cells, which have high H19 mRNA expression, on transformation phenotypes. H19 knockdown in MKN7 cells decreased proliferation, invasion, and anchorage-independent growth compared to control cells transfected with scramble in WST-1, matrigel invasion, and colony formation assays, respectively (Figure 5A, 5B, and 5C, respectively). Similarly, H19 knockdown in MKN74 cells decreased proliferation, invasion, and anchorage-independent growth versus controls (Figure 5D, 5E, and 5F, respectively).
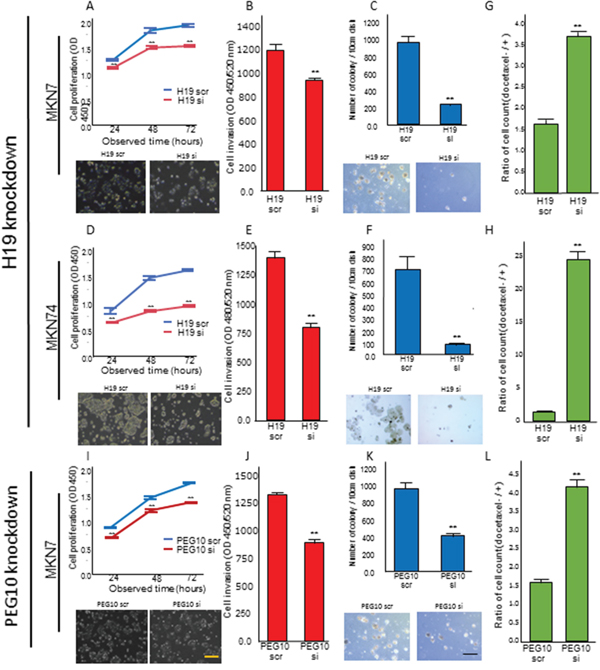
Figure 5: H19 or PEG10 knockdown decreased proliferation, invasion, anchorage-independent growth, and chemo-resistance. (A, B, and C) MKN7 cells were transfected with the indicated H19 siRNA, and analyzed using (A) proliferation, (B) invasion, and (C) anchorage-independent growth assays. The numbers represent the mean ± s.d. (n = 3). **p < 0.01. (D, E, and F) MKN74 cells were transfected with the indicated H19 siRNA and analyzed using (D) proliferation, (E) invasion, and (F) anchorage-independent growth assays. The numbers represent the mean ± s.d. (n = 3). **p < 0.01. (I, J, and K) MKN7 cells were transfected with the indicated PEG10 siRNA, followed by (I) proliferation, (J) invasion, and (K) anchorage-independent growth analyses. The numbers represent the mean ± s.d. (n = 3). **p < 0.01. Representative phase-contrast microscopy images for two independent experiments are shown in A, C, D, F, I, and K. The length of the black and yellow lines are 100 μm and 25 μm, respectively. (G, H, and L) Measurement of the number of viable cells 48 h after 0.25 mM docetaxel treatment in (G) H19 or (L) PEG10 knockdown MKN7 cells, and (H) H19 knockdown MKN74 cells. The numbers represent the mean ± s.d. (n = 3). **p < 0.01.
We next investigated the effect of H19 knockdown on the chemo-sensitivity of MKN7 and MKN74 cells using the microtubule inhibitor docetaxel. Docetaxel is frequently used as a chemotherapeutic for patients with advanced GC [15–17]. In both MKN7 and MKN74 cells, H19 knockdown resulted in reduced cell viability and enhanced chemo-sensitivity (Figure 5G and 5H).
PEG10 knockdown suppresses proliferation, invasion, and anchorage-independent growth, and decreases chemo-resistance in GC cells
We knocked down PEG10 in MKN7 cells, which highly express both PEG10 and H19. These genes promoted each other’s expression in MKN7 cells. PEG10 knockdown in MKN7 cells decreased proliferation, invasion, and anchorage-independent growth in WST-1, matrigel invasion, and soft agar assays in vitro, respectively (Figure 5I, 5J, and 5K). Furthermore, PEG10 knockdown enhanced the sensitivity of MKN7 cells to docetaxel, similar to the effects of H19 knockdown, leading to reduced cell viability (Figure 5L).
An H19-PEG10 / IGF2BP3 axis promotes the malignant phenotype of GC cells
We hypothesized that the relationship between H19 and PEG10 in MKN7 cells could impact transformation in GC cells. Although H19 did not induce PEG10 expression in MKN74 cells, H19 knockdown suppressed transformation (Figure 5D, 5E, 5F, and 5H). We therefore investigated the molecular mechanism by which H19 knockdown suppressed transformation in MKN74 cells. H19 acts as a sponge for let-7, miR-200, and miR-34, which results in the induction of IGF2BP3, c-Myc, and Zeb1 expression, respectively. This leads to induction ofepithelial-mesenchymal transition (EMT) as a consequence of the suppression of E-cadherin expression via increased expression of Zeb1 and Snail1 [18–27]. We examined whether H19 knockdown altered the expression of IGF2BP3, c-Myc, Zeb1, Snail1, or E-cadherin in MKN74 cells (Figure 6). H19 knockdown in MKN74 cells decreased the expression of IGF2BP3, c-Myc, Zeb1, and Snail1, and increased the expression of E-cadherin (Figure 6). IGF2BP3 expression was correlated with H19 expression (Figure 3B), and was generally associated with a high LNR in primary GC.
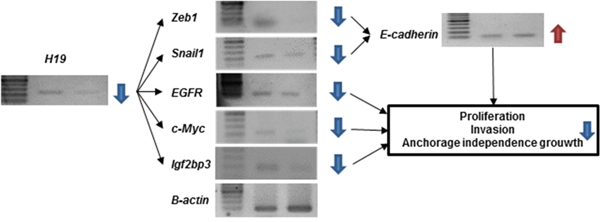
Figure 6: Analysis of downstream signaling and malignant phenotypes following H19 knockdown in MKN74 cells. Downstream signaling pathway components involved in malignant behavior were analyzed in MKN74 cells after H19 knockdown by RT-PCR. Reduced H19 expression led to a decrease in Zeb1, Snail1, EGFR, c-Myc, and IGF2BP3 expression. An increase in E-cadherin expression.
DISCUSSION
The LNR can reflect both the number of metastatic and dissected lymph nodes [6–8]. It can adjust stage migration and surgical lymph node dissection. Our data indicate it predicts the prognosis of pStage IIIC GC patients (Figure 1) [6]. Stage migration is frequently observed in pStage IIIC GC patients. Thus, a high LNR is indicative of aggressive GC. H19 expression was tightly correlated with high LNR. Additionally, high expression of PEG10, IGF2BP3, and EGFR [13] was correlated with high LNR. H19 expression was associated with PEG10 and IGF2BP3 expression.
We demonstrated that H19 and PEG10 promote each other’s expression in GC cells. We investigated the role of the H19-PEG10 axis in GC cell proliferation, anchorage-independent growth, invasion, and chemo-sensitivity. H19 is involved in EMT and promotes cancer cell proliferation, invasion, and metastasis [28–38]. H19 has two major functions: it acts as a reservoir of miR-675 [33, 34], and it acts as a molecular sponge to regulate miRNA and protein availability [18].
Knockdown of H19 resulted a large change in the expression of EMT-associated proteins. The H19-encoded miR-675 promotes skeletal muscle differentiation and regeneration [34]. MiR-675 promotes tumor progression by suppressing the expression of target genes including Rb [32], RUNX1 [33], TGFBI [35], and Twist1 [39]. MiR-675 also promotes stabilization and activation of EGFR and c-Met, which enhances cell proliferation and migration [40]. The indirect association between miR-675 and EGFR supports our finding that EGFR expression decreased after H19 knockdown. Thus, targeting H19, in addition to EGFR, may improve the prognosis of patients with advanced GC and a high LNR. Future studies will examine EGFR and H19 expression in GC patients with high LNRs.
H19 antagonizes a variety of miRNAs that are involved in metastasis [18]. For example, it antagonizes let-7, a potent tumor suppressor [20, 21], which post-transcriptionally represses the expression of metastasis-promoting genes including c-Myc and IGF2BP3 [22]. H19 also acts as a sponge for the miR-200 family through a similar mechanism. The miR-200 family suppresses Zeb1/2 expression (Zeb1/2-miR-200 loop), which suppresses E-cadherin expression [23, 24]. In addition, H19 suppresses miR-34, which suppresses Snail1 expression (Snail1-miR-34 loop) [25–27]. H19 suppresses both negative feedback loops, thereby inhibiting mesenchymal-epithelial transition. Thus, H19 plays an important role in EMT.
We also found that H19 is an upstream regulator of IGF2BP3 expression. Although IGF2BP3 expression was not associated with LNR in the microarray analysis of pStage III GC patients, the frequency of expression was high (71.8%, 28/39), indicating a relationship with H19 expression. IGF2BPs (1, 2, and 3) play important roles in RNA trafficking, stabilization, localization, and cell migration, particularly during the early stages of human and mouse embryogenesis [41, 42]. IGF2BPs are expressed in developing epithelia, the placenta, and muscle, but expression is undetectable in normal adult tissues [43]. IGF2BP3 is re-expressed in several malignant tissues [44–49]. Indeed, IGF2BP3 was shown to promote the association between the RNA-induced silencing complex with specific transcripts, and influence tumor-associated RNA regulation by modulating miRNA-mRNA interactions [50]. IGF2BP3 is regulated by let-7, which in turn is sequestered by H19 [22]. Thus, the H19-IGF2BP3 axis may explain these molecular interactions. IGF2BP3 is upregulated by EGFR [51], which promotes tumor cell migration and invasion by inducing expression of pre-migration/invasion genes [52–58]. EGFR also promotes aggressive phenotypes in tumor cells [59–62]. Although we only observed a relationship between the EGFR and H19-IGF2BP3 and high LNR, we described the existence of a let-7-IGFF2BP3 feedback loop mediated by the molecular sponge activity of H19, and regulation of IGF2BP3 by EGFR and miR-675. These mechanisms may in part explain the aggressive behavior of GC cells.
We have identified an H19-PEG10 axis in GC. PEG10 has recently attracted attention regarding its potential role in cancer proliferation, invasion, and metastasis [63–68]. The effects of H19 knockdown were similar to those of PEG10 knockdown. PEG10 is a paternally expressed gene located on human chromosome 7q21 [69]. Aberrant PEG10 expression has been associated with various human malignancies [61–66]. PEG10 stimulates cell proliferation through interaction with ALK1, which inhibits TGF-β signaling [70], or with SIAH1, an inducer of apoptosis [71, 72]. PEG10 promotes cell cycle progression from G0/G1 and regulates Snail expression via TGF-β signaling [65]. PEG10 also participates in a positive feedback loop with c-Myc [73]. H19 was also reported to participate in a positive feedback loop involving c-Myc [19]. The involvement of c-Myc in the positive feedback loop including H19 and PEG10 may be part of the mechanism underlying H19-PEG10 axis function. Knockdown of H19 or PEG10 induced the expression of EMT-related genes. Thus, the H19-PEG10 axis should be considered a potential therapeutic target in GC.
H19 overexpression has been reported in various human cancers including GC [74–78]. We observed differences in expression in GC cell lines (Figure 4A). H19 is located on human chromosome 11p15.5. Expression is controlled by parental imprinting at the IGF2/H19 locus (H19 is maternally expressed) [79–81]. Imprinting of the H19 gene is accomplished by methylation of the DMR in normal cells [79, 80]. CpG methylation of promoters is a dynamic process. We analyzed H19 expression in MKN7 cells treated with 5-Aza-dC and TSA. H19 expression was suppressed in MKN7 cells as a result of demethylation and/or histone deacetylation (Figure 4G). H19 expression may be suppressed by reactivation of a tumor suppressor gene that regulates H19, and targeting this epigenetic regulation may be effective for the treatment of GC patients with H19 overexpression.
H19 was detected in blood samples from GC patients [82]. The abundance of H19 in plasma suggests that it plays a systemic role in cancer progression. H19 generates miR-675, which is an oncogenic miRNA [29–40]. Further studies are required to analyze the systemic distribution of miR-675 in plasma as well as the distribution in the peritoneal cavity, which is the major site of GC recurrence. We demonstrated overexpression of H19 in GC patients with aggressive disease and lymph node metastasis. These patients have a poor prognosis, even after standard postoperative adjuvant chemotherapy [6]. H19 knockdown suppressed chemo-resistance, suggesting that H19 expression is important for GC progression. H19 expression in the tumor microenvironment is of systemic and local significance.
In summary, the H19-PEG10/IGF2BP3 axis may explain the aggressive features of primary GC (i.e. invasion, metastasis, and chemo-resistance). Therapeutics that target this axis (and lncRNAs) could augment the effects of chemotherapy.
MATERIALS AND METHODS
Patient samples for validation of LNR as a prognostic factor
We first confirmed the relationship between LNR and prognosis in GC. We previously demonstrated that LNR could predict prognosis in pStage II/III GC patients who underwent curative gastrectomy and received S-1 adjuvant therapy. Prognostic stratification based on LNR was only possible in pStage IIIC GC patients [6]. We selected 37 patients with pStage IIIC GC who were treated at our institution between 2000 and 2010 [6]. We updated their prognosis and analyzed the prognostic value of the LNR (Supplementary Table 1). Additionally, 15 patients with pStage IIIC GC were enrolled between 2011 and 2015, and prognostic analysis performed (Supplementary Table 2). The LNR cut-off value was 16.7% [6].
Tissue samples for selection and validation of candidate high LNR-associated genes
We analyzed tumor specimens from 39 patients with pStage III GC who underwent curative gastrectomy and received S-1 adjuvant chemotherapy at our institution between 2008 and 2011 (Supplementary Table 3). None of the patients received chemotherapy or radiotherapy prior to surgery. All tissue samples were collected at the Kitasato University Hospital and analyzed according to the Declaration of Helsinki. Written informed consent was obtained from all patients and healthy donors before sample collection. The study was approved by the Ethics Committee of Kitasato University.
Microarray gene expression analysis
We previously described a method of mRNA expression microarray analysis of candidate high LNR-associated gens [13]. Here, we comprehensively analyzed genes in the second, third, and fourth priority groups, which included genes that had high expression in two, three, or four tumors, respectively.
Cell lines and culture
We analyzed six GC cell lines (MKN7, MKN74, Kato-III, NUGC4, SH-10-TC, and KE97). The MKN7 cell line was obtained from the Cell Resource Center for Biomedical Research Institute of Development, Aging, and Cancer at Tohoku University (Sendai, Japan). The other five GC cell lines were purchased from the RIKEN BioResource Center (Ibaraki, Japan). These cell lines represent the two main types of GC [83], the intestinal type (MKN7 and MKN74 cells) and the diffuse type (Kato-III, SH-10-TC, KE97, and NUGC4 cells) [84–86]. All media contained 10% fetal bovine serum and penicillin-streptomycin (GIBCO, Carlsbad, CA, USA).
RNA extraction, reverse transcription PCR (RT-PCR), and quantitative RT-PCR (qRT-PCR)
RNA extraction from gastric tissue and cell lines, and reverse transcription to generate cDNA were performed as described previously [13]. RT-PCR was performed on equal amounts of cDNA. The qRT-PCR reactions were conducted in triplicate. Target gene levels were normalized to β-actin and analyzed using the CT method. The PCR conditions and sequences of the primer and probes are shown in Supplementary Table 4.
H19 and PEG10 siRNA transfection
The siRNAs targeting human H19 and PEG10 were purchased from Sigma-Aldrich (St Louis, MO, USA). The H19 siRNA sequences were as follows: sense, 5’-ccaacaucaaagacaccau-3’; antisense, 5’-auggugucuuugauguugg-3’ [87]. The PEG10 siRNA sequences were as follows: sense, 5’-gucgcugucugcucugauu dt-3’; antisense, 5’-aaucagagcagacagcgac-3’ [68]. We used MISSION siRNA Universal Negative Control (Sigma-Aldrich) as a control. Cells were seeded in 10 cm dishes overnight and grown to 30–40% confluence. Cells were then transfected with 600 pmol of siRNA using the Lipofectamine 2000 (InvitrogenLife Technologies, Carlsbad, CA, USA) in OPTI-MEM medium (GIBCO) according to the manufacturer’s instructions. After 48 h, the cells were harvested and analyzed by RT-PCR and qRT-PCR.
Cell proliferation and invasion assays
MKN7 and MKN74 cells were seeded at a density of 3.0 × 10³ cells/well and 4.0×10³ cells/well, respectively, in 96-well plates for cell proliferation assays. The cells were transfected with the relevantoligonucleotides, and cell proliferation quantified after 24, 48, and 72 hours using the Premix WST-1 Cell Proliferation Assay System (Takara Bio, Tokyo, Japan) according to the manufacturer’s protocol. Invasion assays were performed by measuring the ability of transfected cells to migrate through a Transwell chamber using the CytoSelectTM 96-Well Cell Invasion Assay (Basement Membrane, Fluorometric Format) (Cell Biolabs, Inc., San Diego, CA, USA) according to the manufacturer’s protocol. The fluorescence intensity was measured by the absorbance at 450 nm in the proliferation assays and at 450 nm/520 nm in the invasion assays using a microplate reader (Molecular Devices, LLC. Sunnyvale, CA, USA).
Anchorage-independent colony formation assays
Anchorage-independent cell growth was analyzed by plating 0.36% top agarose (Bacto™ Agar, Becton, Dickinson and Company, Franklin Lakes, NJ, USA) containing 1.0 × 10⁵ cells on a surface of 0.72% bottom agarose in 6-well plates [88]. Cells were fed weekly by overlaying fresh soft-agar solution, and colonies imaged after 2–3 weeks of incubation. Two independent experiments were performed and each experiment was performed in triplicate.
Chemo-sensitivity assays
Chemo-sensitivity assays were performed with docetaxel (Taxotere, Sanofi), which is useful as a single-agent or combination chemotherapy for the treatment of advanced GC [89, 90]. Docetaxel was administered at a final concentration of 0.25 μM following siRNA transfection. After 48 h of docetaxel treatment, cells were detached using Trypsin-EDTA (GIBCO) and viable cells counted using a Countess automated cell counter (Invitrogen Life Technologies).
Treatment of MKN7 cells with 5-Aza-dC and TSA
In order to investigate whether the expression of H19 was regulated by methylation of a DMR, MKN7 cells were treated with 1 μM or 5 μM 5-Aza-dC, a demethylating agent, (Sigma-Aldrich) dissolved in 50% acetic acid (Wako pure Chemical Industries, Osaka, Japan) once every 24 h for 4 days. Controls were mock-treated with an equal volume of PBS (GIBCO) once every 24 h for 4 days. In addition, 300 nM of the histone deacetylase inhibitor TSA (Sigma-Aldrich) was added to the cells for the final 24 h. Cells were detached on day 5 using Trypsin-EDTA and mRNA extracted using the RNeasy Mini Kit (Qiagen) for gene expression analysis [91].
Statistical analysis
Categorical variables were analyzed using χ2 or Fisher’s exact tests. Differences in continuous variables between groups were evaluated using analysis of variance (ANOVA). Cumulative, 5-year RFS was estimated using the Kaplan-Meier method, and statistical differences were analyzed using log rank tests. RFS was measured from the date of surgery to that of recurrence or the last follow-up. A p < 0.05 was considered statistically significant. Factors with p < 0.05 on univariate analysis were subjected to multivariate analysis using a Cox proportional hazards model to identify independent prognostic factors. All analyses were performed using JMP version 11.1 (SAS Institute Japan, Tokyo, Japan).
Abbreviations
LNR: lymph node ratio; GC: gastric cancer; pStage: pathological stage; lncRNA: long non-coding RNA; miR: micro-RNA; mRNA: messenger RNA; RT-PCR: reverse transcription polymerase chain reaction; qRT-PCR: quantitative reverse transcription polymerase chain reaction; siRNA: small interfering RNA; RFS: recurrence free survival; ANOVA: analysis of variance; 5-Aza-dc: 5-aza-2’-deoxycytidine; TSA: trichostatin A; DMR: differentially methylated region; EMT: epithelial mesenchymal transition.
Author contributions
Study conception and design: S.I, K.Y, and M.W.
Data acquisition: S.I, K.Y, A.E, and M.W.
Data analysis and interpretation: S.I and K.Y.
Drafting the article: S.I, K.Y.
Revising the article: S.I, K.Y, and M.W.
All authors reviewed the manuscript.
ACKNOWLEDGMENTS
We thank FORTE Science Communications (Tokyo, Japan) and English Edit OT in Oncotarget for professional editorial assistance.
CONFLICTS OF INTEREST
The authors declare that there are no conflicts of interest.
FUNDING
None.
REFERENCES
1. Torre LA, Bray F, Siegel RL, Ferlay J, Lortet-Tieulent J, Jemal A. Global cancer statistics, 2012. CA Cancer J Clin. 2015; 65:87-108.
2. Yamashita K, Sakuramoto S, Kikuchi S, Katada N, Kobayashi N, Watanabe M. Validation of staging systems for gastric cancer. Gastric Cancer. 2008; 11:111-118.
3. Kikuchi S, Futawatari N, Sakuramoto S, Katada N, Yamashita K, Shibata T, Nemoto M, Watanabe M. Comparison of staging between the old (6th edition) and new (7th edition) TNM classifications in advanced gastric cancer. Anticancer Res. 2011; 31:2361-2365.
4. Nashimoto A, Akazawa K, Isobe Y, Miyashiro I, Katai H, Kodera Y, Tsujitani S, Seto Y, Furukawa H, Oda I, Ono H, Tanabe S, Kaminishi M. Gastric cancer treated in 2002 in Japan: 2009 annual report of the JGCA nationwide registry. Gastric Cancer. 2013; 16:1-27.
5. Wang J, Dang P, Raut CP, Pandalai PK, Maduekwe UN, Rattner DW, Lauwers GY, Yoon SS. Comparison of a lymph node ratiobased staging system with the 7th AJCC system for gastric cancer: analysis of 18,043 patients from the SEER database. Ann Surg. 2012; 255:478-485.
6. Ema A, Yamashita K, Sakuramoto S, Wang G, Mieno H, Nemoto M, Shibata T, Katada N, Kikuchi S, Watanabe M. Lymph node ratio is a critical prognostic predictor in gastric cancer treated with S-1 chemotherapy. Gastric Cancer. 2014; 17:67-75.
7. Yamashita K, Hosoda K, Ema A, Watanabe M. Lymph node ratio as a novel and simple prognostic factor in advanced gastric cancer. Eur J Surg Oncol. 2016; 42:1253-60.
8. Yamashita K, Ooki A, Sakuramoto S, Kikuchi S, Katada N, Kobayashi N, Watanabe M. Lymph node metastasis density (ND)-factor association with malignant degree and ND40 as “non-curative factor” in gastric cancer. Anticancer Res. 2008; 28:435-441.
9. Bando E, Yonemura Y, Taniguchi K, Fushida S, Fujimura T, Miwa K. Outcome of ratio of lymph node metastasis in gastric carcinoma. Ann Surg Oncol. 2002; 9:775-784.
10. Kunisaki C, Shimada H, Nomura M, Matsuda G, Otsuka Y, Ono H, Akiyama H. Clinical impact of metastatic lymph node ratio in advanced gastric cancer. Anticancer Res. 2005; 25:1369-1375.
11. Saito H, Fukumoto Y, Osaki T, Yamada Y, Fukuda K, Tatebe S, Tsujitani S, Ikeguchi M. Prognostic significance of the ratio between metastatic and dissected lymph nodes (n ratio) in patients with advanced gastric cancer. J Surg Oncol. 2008; 97:132-135.
12. Fukuda N, Sugiyama Y, Midorikawa A, Mushiake H. Prognostic significance of the metastatic lymph node ratio in gastric cancer patients. World J Surg. 2009; 33:2378-2382.
13. Ema A, Waraya M, Yamashita K, Kokubo K, Kobayashi H, Hoshi K, Shinkai Y, Kawamata H, Nakamura K, Nishimiya H, Katada N, Watanabe M. Identification of EGFR expression status association with metastatic lymph node density (ND) by expression microarray analysis of advanced gastric cancer. Cancer Med. 2015; 4:90-100.
14. Yamashita K, Upadhyay S, Osada M, Hoque MO, Xiao Y, Mori M, Sato F, Meltzer SJ, Sidransky D. Pharmacologic unmasking of epigenetically silenced tumor suppressor genes in esophageal squamous cell carcinoma. Cancer Cell. 2002; 2:485-495.
15. Koizumi W, Kim YH, Fujii M, Kim HK, Imamura H, Lee KH, Hara T, Chung HC, Satoh T, Cho JY, Hosaka H, Tsuji A, Takagane A, et al. Addition of docetaxel to S-1 without platinum prolongs survival of patients with advanced gastric cancer: a randomized study (START). J Cancer Res Clin Oncol. 2014; 140:319-328.
16. Oki E, Emi Y, Kusumoto T, Sakaguchi Y, Yamamoto M, Sadanaga N, Shimokawa M, Yamanaka T, Saeki H, Morita M, Takahashi I, Hirabayashi N, Sakai K, et al. Phase II study of docetaxel and S-1 (DS) as neoadjuvant chemotherapy for clinical stage III resectable gastric cancer. Ann Surg Oncol. 2014; 21:2340-2346.
17. Van Cutsem E, Boni C, Tabernero J, Massuti B, Middleton G, Dane F, Reichardt P, Pimentel FL, Cohn A, Follana P, Clemens M, Zaniboni A, Moiseyenko V, et al. Docetaxel plus oxaliplatin with or without fluorouracil or capecitabine in metastatic or locally recurrent gastric cancer: a randomized phase II study. Ann Oncol. 2015; 26:149-156.
18. Liang WC, Fu WM, Wong CW, Wang Y, Wang WM, Hu GX, Zhang L, Xiao LJ, Wan DC, Zhang JF, Waye MM. The lncRNA H19 promotes epithelial to mesenchymal transition by functioning as miRNA sponges in colorectal cancer. Oncotarget. 2015; 6:22513-22525. https://doi.org/10.18632/oncotarget.4154.
19. Barsyte-Lovejoy D, Lau SK, Boutros PC, Khosravi F, Jurisica I, Andrulis IL, Tsao MS, Penn LZ. The c-Myc oncogene directly induces the H19 noncoding RNA by allele-specific binding to potentiate tumorigenesis. Cancer Res. 2006; 66:5330-5337.
20. Kallen AN, Zhou XB, Xu J, Qiao C, Ma J, Yan L, Lu L, Liu C, Yi JS, Zhang H, Min W, Bennett AM, Gregory RI, et al. The imprinted H19 lncRNA antagonizes let-7 microRNAs. Mol Cell. 2013; 52:101-112.
21. Ma C, Nong K, Zhu H, Wang W, Huang X, Yuan Z, Ai K. H19 promotes pancreatic cancer metastasis by derepressing let-7's suppression on its target HMGA2-mediated EMT. Tumour Biol. 2014; 35:9163-9169.
22. Yan L, Zhou J, Gao Y, Ghazal S, Lu L, Bellone S, Yang Y, Liu N, Zhao X, Santin AD, Taylor H, Huang Y. Regulation of tumor cell migration and invasion by the H19/let-7 axis is antagonized by metformin-induced DNA methylation. Oncogene. 2015; 34:3076-3084.
23. Park SM, Gaur AB, Lengyel E, Peter ME. The miR-200 family determines the epithelial phenotype of cancer cells by targeting the E-cadherin repressors ZEB1 and ZEB2. Genes Dev. 2008; 22:894-907.
24. Gregory PA, Bert AG, Paterson EL, Barry SC, Tsykin A, Farshid G, Vadas MA, Khew-Goodall Y, Goodall GJ. The miR-200 family and miR-205 regulate epithelial to mesenchymal transition by targeting ZEB1 and SIP1. Nat Cell Biol. 2008; 10:593-601.
25. Kim NH, Kim HS, Li XY, Lee I, Choi HS, Kang SE, Cha SY, Ryu JK, Yoon D, Fearon ER, Rowe RG, Lee S, Maher CA, et al. A p53/miRNA-34 axis regulates Snail1-dependent cancer cell epithelial-mesenchymal transition. J Cell Biol. 2011; 195:417-433.
26. Siemens H, Jackstadt R, Hünten S, Kaller M, Menssen A, Götz U, Hermeking H. miR-34 and SNAIL form a double-negative feedback loop to regulate epithelial-mesenchymal transitions. Cell Cycle. 2011; 10:4256-4271.
27. Brabletz T. To differentiate or not–routes towards metastasis. Nat Rev Cancer. 2012; 12:425-436.
28. Matouk IJ, Raveh E, Abu-lail R, Mezan S, Gilon M, Gershtain E, Birman T, Gallula J, Schneider T, Barkali M, Richler C, Fellig Y, Sorin V, et al. Oncofetal H19 RNA promotes tumor metastasis. Biochim Biophys Acta. 2014; 1843:1414-1426.
29. Keniry A, Oxley D, Monnier P, Kyba M, Dandolo L, Smits G, Reik W. The H19 lincRNA is a developmental reservoir of miR-675 that suppresses growth and Igf1r. Nat Cell Biol. 2012; 14:659-665.
30. Dey BK, Pfeifer K, Dutta A. The H19 long noncoding RNA gives rise to microRNAs miR-675-3p and miR-675-5p to promote skeletal muscle differentiation and regeneration. Genes Dev. 2014; 28:491-501.
31. Kim NH, Choi SH, Lee TR, Lee CH, Lee AY. Cadherin 11, a miR-675 target, induces N-cadherin expression and epithelial-mesenchymal transition in melasma. J Invest Dermatol. 2014; 134:2967-2976.
32. Tsang WP, Ng EK, Ng SS, Jin H, Yu J, Sung JJ, Kwok TT. Oncofetal H19-derived miR-675 regulates tumor suppressor RB in human colorectal cancer. Carcinogenesis. 2010; 31:350-358.
33. Zhuang M, Gao W, Xu J, Wang P, Shu Y. The long non-coding RNA H19-derived miR-675 modulates human gastric cancer cell proliferation by targeting tumor suppressor RUNX1. Biochem Biophys Res Commun. 2014; 448:315-322.
34. Gao WL, Liu M, Yang Y, Yang H, Liao Q, Bai Y, Li YX, Li D, Peng C, Wang YL. The imprinted H19 gene regulates human placental trophoblast cell proliferation via encoding miR-675 that targets Nodal Modulator 1 (NOMO1). RNA Biol. 2012; 9:1002-1010.
35. Zhu M, Chen Q, Liu X, Sun Q, Zhao X, Deng R, Wang Y, Huang J, Xu M, Yan J, Yu J. lncRNA H19/miR-675 axis represses prostate cancer metastasis by targeting TGFBI. FEBS J. 2014; 281:3766-3775.
36. Li H, Yu B, Li J, Su L, Yan M, Zhu Z, Liu B. Overexpression of lncRNA H19 enhances carcinogenesis and metastasis of gastric cancer. Oncotarget. 2014; 5:2318-2329. https://doi.org/10.18632/oncotarget.1913.
37. Kim NH, Choi SH, Kim CH, Lee CH, Lee TR, Lee AY. Reduced MiR-675 in exosome in H19 RNA-related melanogenesis via MITF as a direct target. J Invest Dermatol. 2014; 134:1075-1082.
38. Cai X, Cullen BR. The imprinted H19 noncoding RNA is a primary microRNA precursor. RNA. 2007; 13:313-316.
39. Hernandez JM, Elahi A, Clark CW, Wang J, Humphries LA, Centeno B, Bloom G, Fuchs BC, Yeatman T, Shibata D. miR-675 mediates downregulation of Twist1 and Rb in AFP-secreting hepatocellular carcinoma. Ann Surg Oncol. 2013; 20:S625-S635.
40. Vennin C, Spruyt N, Dahmani F, Julien S, Bertucci F, Finetti P, Chassat T, Bourette RP, Le Bourhis X, Adriaenssens E. H19 non coding RNA-derived miR-675 enhances tumorigenesis and metastasis of breast cancer cells by downregulating c-Cbl and Cbl-b. Oncotarget. 2015; 6:29209-29223. https://doi.org/10.18632/oncotarget.4976.
41. Nielsen J, Christiansen J, Lykke-Andersen J, Johnsen AH, Wewer UM, Nielsen FC. A family of insulin-like growth factor II mRNA-binding proteins represses translation in late development. Mol Cell Biol. 1999; 19:1262-1270.
42. Mueller-Pillasch F, Pohl B, Wilda M, Lacher U, Beil M, Wallrapp C, Hameister H, Knöchel W, Adler G, Gress TM. Expression of the highly conserved RNA binding protein KOC in embryogenesis. Mech Dev. 1999; 88:95-99.
43. Mueller-Pillasch F, Lacher U, Wallrapp C, Micha A, Zimmerhackl F, Hameister H, Varga G, Friess H, Büchler M, Beger HG, Vila MR, Adler G, Gress TM. Cloning of a gene highly overexpressed in cancer coding for a novel KH-domain containing protein. Oncogene. 1997; 14:2729-2733.
44. Jiang Z, Chu PG, Woda BA, Rock KL, Liu Q, Hsieh CC, Li C, Chen W, Duan HO, McDougal S, Wu CL. Analysis of RNA-binding protein IMP3 to predict metastasis and prognosis of renal-cell carcinoma: a retrospective study. Lancet Oncol. 2006; 7:556-564.
45. Li C, Rock KL, Woda BA, Jiang Z, Fraire AE, Dresser K. IMP3 is a novel biomarker for adenocarcinoma in situ of the uterine cervix: an immunohistochemical study in comparison with p16(INK4a) expression. Mod Pathol. 2007; 20:242-247.
46. Lu D, Yang X, Jiang NY, Woda BA, Liu Q, Dresser K, Mercurio AM, Rock KL, Jiang Z. IMP3, a new biomarker to predict progression of cervical intraepithelial neoplasia into invasive cancer. Am J Surg Pathol. 2011; 35:1638-1645.
47. Simon R, Bourne PA, Yang Q, Spaulding BO, di Sant'Agnese PA, Wang HL, Xu H. Extrapulmonary small cell carcinomas express K homology domain containing protein overexpressed in cancer, but carcinoid tumors do not. Hum Pathol. 2007; 38:1178-1183.
48. Yantiss RK, Woda BA, Fanger GR, Kalos M, Whalen GF, Tada H, Andersen DK, Rock KL, Dresser K. KOC (K homology domain containing protein overexpressed in cancer): a novel molecular marker that distinguishes between benign and malignant lesions of the pancreas. Am J Surg Pathol. 2005; 29:188-195.
49. Zheng W, Yi X, Fadare O, Liang SX, Martel M, Schwartz PE, Jiang Z. The oncofetal protein IMP3: a novel biomarker for endometrial serous carcinoma. Am J Surg Pathol. 2008; 32:304-315.
50. Ennajdaoui H, Howard JM, Sterne-Weiler T, Jahanbani F, Coyne DJ, Uren PJ, Dargyte M, Katzman S, Draper JM, Wallace A, Cazarez O, Burns SC, Qiao M, et al. IGF2BP3 modulates the interaction of invasion-associated transcripts with RISC. Cell Rep. 2016; 15:1876-1883.
51. Samanta S, Sharma VM, Khan A, Mercurio AM. Regulation of IMP3 by EGFR signaling and repression by ERbeta: implications for triple-negative breast cancer. Oncogene. 2012; 31:4689-4697.
52. Jeng YM, Chang CC, Hu FC, Chou HY, Kao HL, Wang TH, Hsu HC. RNA-binding protein insulin-like growth factor II mRNA-binding protein 3 expression promotes tumor invasion and predicts early recurrence and poor prognosis in hepatocellular carcinoma. Hepatology. 2008; 48:1118-1127.
53. Vikesaa J, Hansen TV, Jonson L, Borup R, Wewer UM, Christiansen J, Nielsen FC. RNA binding IMPs promote cell adhesion and invadopodia formation. EMBO J. 2006; 25:1456-1468.
54. Suvasini R, Shruti B, Thota B, Shinde SV, Friedmann-Morvinski D, Nawaz Z, Prasanna KV, Thennarasu K, Hegde AS, Arivazhagan A, Chandramouli BA, Santosh V, Somasundaram K. Insulin growth factor-2 binding protein 3 (IGF2BP3) is a glioblastoma-specific marker that activates phosphatidylinositol 3-kinase/mitogen-activated protein kinase (PI3K/MAPK) pathways by modulating IGF-2. J Biol Chem. 2011; 286:25882-25890.
55. Havens AM, Jung Y, Sun YX, Wang J, Shah RB, Bühring HJ, Pienta KJ, Taichman RS. The role of sialomucin CD164 (MGC-24v or endolyn) in prostate cancer metastasis. BMC Cancer. 2006; 6:195.
56. Zeng ZS, Cohen AM, Guillem JG. Loss of basement membrane type IV collagen is associated with increased expression of metalloproteinases 2 and 9 (MMP-2 and MMP-9) during human colorectal tumorigenesis. Carcinogenesis. 1999; 20:749-755.
57. Belotti D, Paganoni P, Manenti L, Garofalo A, Marchini S, Taraboletti G, Giavazzi R. Matrix metalloproteinases (MMP9 and MMP2) induce the release of vascular endothelial growth factor (VEGF) by ovarian carcinoma cells: implications for ascites formation. Cancer Res. 2003; 63:5224-5229.
58. Scorilas A, Karameris A, Arnogiannaki N, Ardavanis A, Bassilopoulos P, Trangas T, Talieri M. Overexpression of matrix-metalloproteinase-9 in human breast cancer: a potential favourable indicator in node-negative patients. Br J Cancer. 2001; 84:1488-1496.
59. Ashktorab H, Daremipouran M, Wilson M, Siddiqi S, Lee EL, Rakhshani N, Malekzadeh R, Johnson AC, Hewitt SM, Smoot DT. Transactivation of the EGFR by AP-1 is induced by Helicobacter pylori in gastric cancer. Am J Gastroenterol. 2007; 102:2135-2146.
60. Xu L, Nilsson MB, Saintigny P, Cascone T, Herynk MH, Du Z, Nikolinakos PG, Yang Y, Prudkin L, Liu D, Lee JJ, Johnson FM, Wong KK, et al. Epidermal growth factor receptor regulates MET levels and invasiveness through hypoxia-inducible factor-1alpha in non-small cell lung cancer cells. Oncogene. 2010; 29:2616-2627.
61. Van Meter TE, Broaddus WC, Rooprai HK, Pilkington GJ, Fillmore HL. Induction of membrane-type-1 matrix metalloproteinase by epidermal growth factor-mediated signaling in gliomas. Neuro Oncol. 2004; 6:188-199.
62. Li Z, Xu X, Bai L, Chen W, Lin Y. Epidermal growth factor receptor-mediated tissue transglutaminase overexpression couples acquired tumor necrosis factor-related apoptosis-inducing ligand resistance and migration through c-FLIP and MMP-9 proteins in lung cancer cells. J Biol Chem. 2011; 286:21164-21172.
63. Bang H, Ha SY, Hwang SH, Park CK. Expression of PEG10 is associated with poor survival and tumor recurrence in hepatocellular carcinoma. Cancer Res Treat. 2015; 47:844-852.
64. Deng X, Hu Y, Ding Q, Han R, Guo Q, Qin J, Li J, Xiao R, Tian S, Hu W, Zhang Q, Xiong J. PEG10 plays a crucial role in human lung cancer proliferation, progression, prognosis and metastasis. Oncol Rep. 2014; 32:2159-2167.
65. Akamatsu S, Wyatt AW, Lin D, Lysakowski S, Zhang F, Kim S, Tse C, Wang K, Mo F, Haegert A, Brahmbhatt S, Bell R, Adomat H, et al. The placental gene PEG10 promotes progression of neuroendocrine prostate cancer. Cell Rep. 2015; 12:922-936.
66. Zang W, Wang T, Huang J, Li M, Wang Y, Du Y, Chen X, Zhao G. Long noncoding RNA PEG10 regulates proliferation and invasion of esophageal cancer cells. Cancer Gene Ther. 2015; 22:138-144.
67. Li X, Xiao R, Tembo K, Hao L, Xiong M, Pan S, Yang X, Yuan W, Xiong J, Zhang Q. PEG10 promotes human breast cancer cell proliferation, migration and invasion. Int J Oncol. 2016; 48:1933-1942.
68. Xiong J, Qin J, Zheng Y, Peng X, Luo Y, Meng X. PEG10 promotes the migration of human Burkitt's lymphoma cells by up-regulating the expression of matrix metalloproteinase-2 and -9. Clin Invest Med. 2012; 35:E117-E125.
69. Ono R, Kobayashi S, Wagatsuma H, Aisaka K, Kohda T, Kaneko-Ishino T, Ishino F. A retrotransposon-derived gene, PEG10, is a novel imprinted gene located on human chromosome 7q21. Genomics. 2001; 73:232-237.
70. Lux A, Beil C, Majety M, Barron S, Gallione CJ, Kuhn HM, Berg JN, Kioschis P, Marchuk DA, Hafner M. Human retroviral gag- and gag-pol-like proteins interact with the transforming growth factor-beta receptor activin receptor-like kinase 1. J Biol Chem. 2005; 280:8482-8493.
71. Okabe H, Satoh S, Furukawa Y, Kato T, Hasegawa S, Nakajima Y, Yamaoka Y, Nakamura Y. Involvement of PEG10 in human hepatocellular carcinogenesis through interaction with SIAH1. Cancer Res. 2003; 63:3043-3048.
72. Matsuo K, Satoh S, Okabe H, Nomura A, Maeda T, Yamaoka Y, Ikai I. SIAH1 inactivation correlates with tumor progression in hepatocellular carcinomas. Genes Chromosomes Cancer. 2003; 36:283-291.
73. Li CM, Margolin AA, Salas M, Memeo L, Mansukhani M, Hibshoosh H, Szabolcs M, Klinakis A, Tycko B. PEG10 is a c-MYC target gene in cancer cells. Cancer Res. 2006; 66:665-672.
74. Kondo M, Suzuki H, Ueda R, Osada H, Takagi K, Takahashi T, Takahashi T. Frequent loss of imprinting of the H19 gene is often associated with its overexpression in human lung cancers. Oncogene. 1995; 10:1193-1198.
75. Lottin S, Adriaenssens E, Dupressoir T, Berteaux N, Montpellier C, Coll J, Dugimont T, Curgy JJ. Overexpression of an ectopic H19 gene enhances the tumorigenic properties of breast cancer cells. Carcinogenesis. 2002; 23:1885-1895.
76. Jia HL, Ye QH, Qin LX, Budhu A, Forgues M, Chen Y, Liu YK, Sun HC, Wang L, Lu HZ, Shen F, Tang ZY, Wang XW. Gene expression profiling reveals potential biomarkers of human hepatocellular carcinoma. Clin Cancer Res. 2007; 13:1133-1139.
77. Jiang X, Yan Y, Hu M, Chen X, Wang Y, Dai Y, Wu D, Wang Y, Zhuang Z, Xia H. Increased level of H19 long noncoding RNA promotes invasion, angiogenesis, and stemness of glioblastoma cells. J Neurosurg. 2016; 124:129-136.
78. Zhu Z, Song L, He J, Sun Y, Liu X, Zou X. Ectopic expressed long non-coding RNA H19 contributes to malignant cell behavior of ovarian cancer. Int J Clin Exp Pathol. 2015; 8:10082-10091.
79. Hark AT, Schoenherr CJ, Katz DJ, Ingram RS, Levorse JM, Tilghman SM. CTCF mediates methylation-sensitive enhancer-blocking activity at the H19/Igf2 locus. Nature. 2000; 405:486-489.
80. Bell AC, Felsenfeld G. Methylation of a CTCF-dependent boundary controls imprinted expression of the Igf2 gene. Nature. 2000; 405:482-485.
81. Bartolomei MS, Zemel S, Tilghman SM. Parental imprinting of the mouse H19 gene. Nature. 1991; 351:153-155.
82. Zhou X, Yin C, Dang Y, Ye F, Zhang G. Identification of the long non-coding RNA H19 in plasma as a novel biomarker for diagnosis of gastric cancer. Sci Rep. 2015; 5:11516.
83. Lauren P. The two histological main types of gastric carcinoma: diffuse and so-called intestinal-type carcinoma. an attempt at a histo-clinical classification. Acta Pathol Microbiol Scand. 1965; 64:31-49.
84. Dote H, Toyooka S, Tsukuda K, Yano M, Ota T, Murakami M, Naito M, Toyota M, Gazdar AF, Shimizu N. Aberrant promoter methylation in human DAB2 interactive protein (hDAB2IP) gene in gastrointestinal tumour. Br J Cancer. 2005; 92:1117-1125.
85. Yokozaki H. Molecular characteristics of eight gastric cancer cell lines established in Japan. Pathol Int. 2000; 50:767-777.
86. Wang WX, Xiong J, Tang Y, Zhu JJ, Li M, Zhao Y, Yang GX, Xia G, Hu JF. Rearranged abietane diterpenoids from the roots of Clerodendrum trichotomum and their cytotoxicities against human tumor cells. Phytochemistry. 2013; 89:89-95.
87. Zhang EB, Han L, Yin DD, Kong R, De W, Chen J. c-Myc-induced, long noncording H19 affects cell proliferation and predicts a poor prognosis in patients with gastric cancer. Med Oncol. 2014; 31:914.
88. Ooki A, Yamashita K, Kikuchi S, Sakuramoto S, Katada N, Watanabe M. Phosphatase of regenerating liver-3 as a convergent therapeutic target for lymph node metastasis in esophageal squamous cell carcinoma. Int J Cancer. 2010; 127:543-554.
89. Nishiyama M, Wada S. Docetaxel: its role in current and future treatments for advanced gastric cancer. Gastric Cancer. 2009; 12:132-141.
90. Van Cutsem E, Moiseyenko VM, Tjulandin S, Majlis A, Constenla M, Boni C, Rodrigues A, Fodor M, Chao Y, Voznyi E, Risse ML, Ajani JA; V325 Study Group. Phase III study of docetaxel and cisplatin plus fluorouracil compared with cisplatin and fluorouracil as first-line therapy for advanced gastric cancer: a report of the V325 Study Group. J Clin Oncol. 2006; 24:4991-4997.
91. Kikuchi M, Yamashita K, Waraya M, Minatani N, Ushiku H, Kojo K, Ema A, Kosaka Y, Katoh H, Sengoku N, Enomoto T, Tanino H, Sawanobori M, et al. Epigenetic regulation of ZEB1-RAB25/ESRP1 axis plays a critical role in phenylbutyrate treatment-resistant breast cancer. Oncotarget. 2016; 7:1741-1753. https://doi.org/10.18632/oncotarget.6480.