
INTRODUCTION
Liver cancer is the sixth most prevalent neoplasm [1], an estimated 782,500 new liver cancer cases occurred worldwide during 2012 [2], whereas it has become the third most frequent cause of death from cancer [3]. Chronic Hepatitis B or C viral infection, alcohol consumption, cigarette smoking, non-alcoholic steatohepatitis and aflatoxin exposure have been identified as key risk factors for this cancer [4–7].
One universal epidemiologic characteristic of liver cancer is the prominent male dominance [8]. It is the fifth most common cancer in men and the ninth in women [9, 10]. Stimulatory effects of androgen and the protective effects of estrogen has been suggested as the cause [11]. Potential sexual dimorphism in liver cancer is possibly caused by the differential recruitment of Foxa-1/2 transcription factors and the corresponding androgen and estrogen receptors [12]. However, the causes for the gender difference still need further investigation.
Obesity is growing globally, the worldwide prevalence of obesity has doubled from 1980 to 2008 [13]. There were multiple evidences suggesting that excess body weight increases liver cancer risk [14–17]. As an example, patients with a history of obesity have a 2.47-fold higher liver cancer risk [18]. However, the gender difference for the effect of body mass index (BMI) on liver cancer incidence is uncertain. Thus, this meta-analysis was conducted to quantitatively and precisely evaluate the gender difference of this relevance.
RESULTS
Literature search and study characteristics
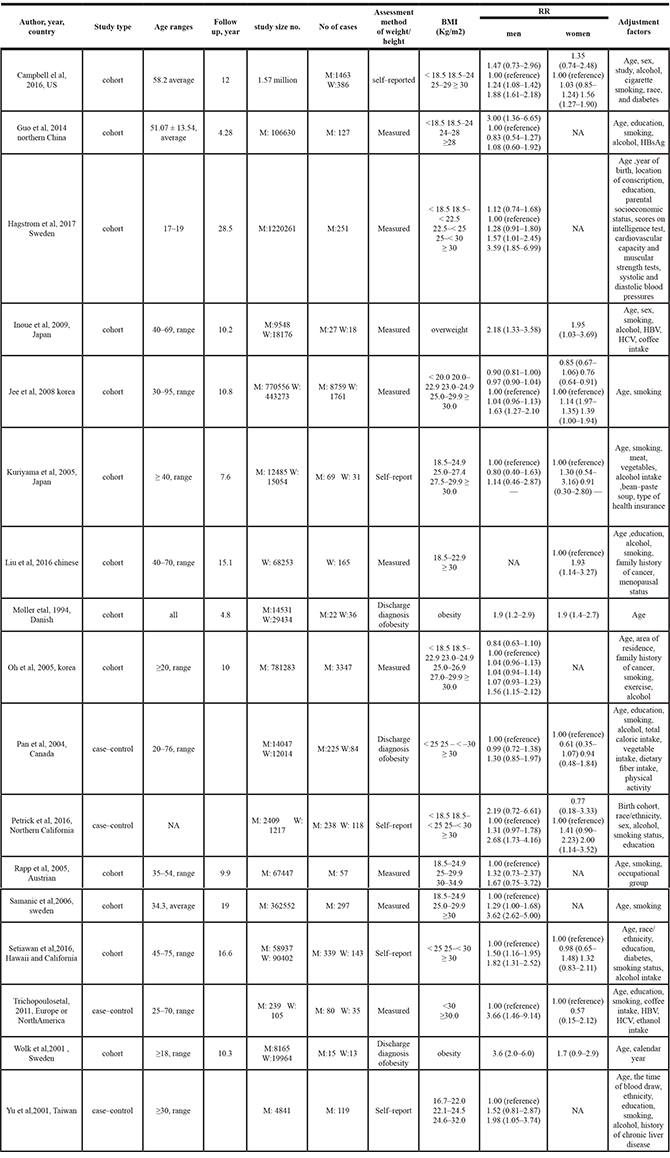
As shown in Figure 1, for BMI and liver cancer incidence, we identified 17 relevant articles [19–35], including 13 cohort studies [19, 20, 23–28, 30, 31, 33–35] and 4 case-control studies [21, 22, 29, 32], with a total of 18225 cases. All studies reported outcomes of both sex. The quality score of studies ranged from 6 stars to 9 stars (Supplementary Table 1) according to the 9-star Newcastal-Ottawa Scale [30]. Characteristics of studies included in the meta-analysis were presented in Table 1.
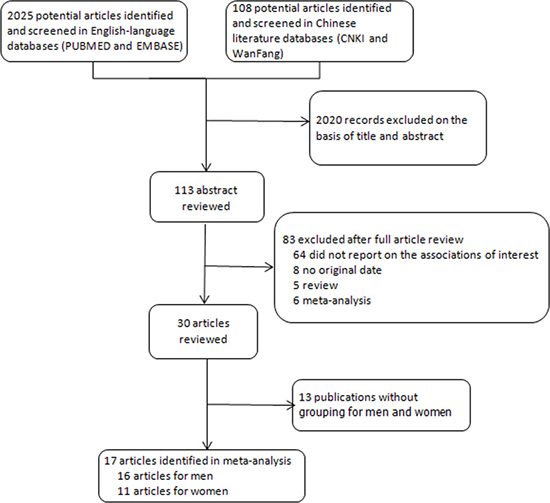
Figure 1: Flow diagram of the study selection in this meta-analysis.
Table 1: Characteristics of included studies
Association between BMI and liver cancer incidence
Compared to the reference category (normal weight), a positive association was observed between high BMI and liver cancer incidence (overweight: 1.16 (1.08–1.25); obesity: 1.83 (1.60–2.09)) (Supplementary Figure 1).
Subgroup analysis for the association between BMI and liver cancer incidence
Subgroup analysis by sex were conducted to further examine the association of BMI and liver cancer incidence. As shown in Figure 2 and Table 2, the RRs of liver cancer incidence for men and women in the category of obesity were 2.04 (1.70–2.44) and 1.56 (1.37–1.78). Interaction analysis was conducted to compare the RRs between men and women and the P for interaction is 0.02, which indicated that the risk of liver cancer incidence was significantly higher in men than in women. Instead, the interaction analysis indicated there was no significant difference between the RRs of overweight men and women (1.18(1.01,1.30) vs. 1.11(1.00,1.24), P for interaction = 0.47) (Table 2).
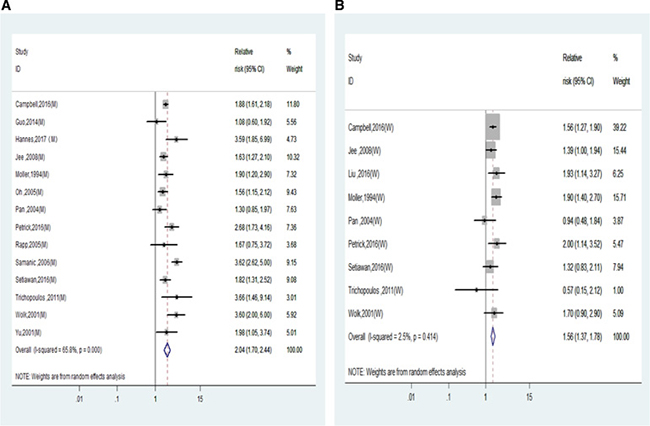
Figure 2: Relative risks of liver cancer incidence in obesity of overall population. (A) Forest plots of liver cancer incidence RR in obese men; (B) Forest plots of liver cancer incidence RR in obese women. RR, relative risk; BMI, body mass index.
Table 2: Subgroup analyses of BMI and liver cancer incidence
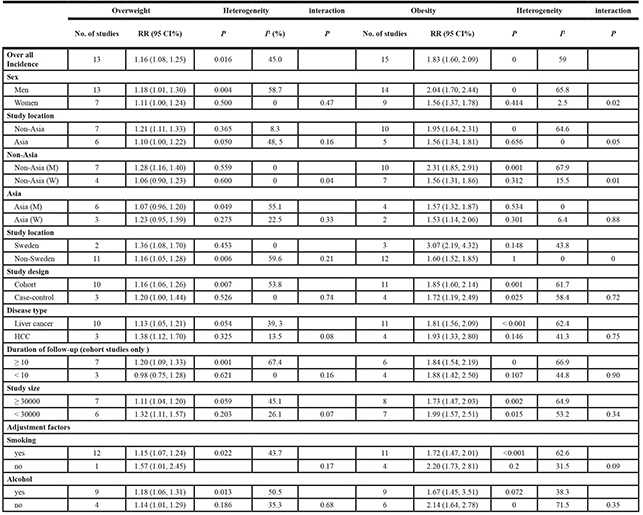
The prevalence of obesity is markedly different between in Western countries and in Asian countries [36]. Thus we compared the RRs between in non-Asian countries and Asian countries. In the subgroup analysis by study location, the RRs for liver cancer incidence in non-Asian were 1.21 (1.11, 1.33) and 1.95 (1.64,2.31) respectively for overweight and obesity (Supplementary Figure 2 and Table 2), while the corresponding RRs for Asian were 1.10 (1.00, 1.22) and 1.56 (1.34, 1.81). The RR of liver cancer incidence was slightly higher in non-Asian obesity than Asian obesity (P for interaction = 0.05) (Table 2). However, the RR was significantly higher in Sweden studies than that in non-Sweden studies (3.07 (2.19–4.32) vs. 1.68 (1.52–1.85), P for interaction = 0.00, Table 2).
Furthermore, the RRs of liver cancer incidence for men and women were calculated and compared in non-Asia countries and Asia countries separately. As shown in Figure 3 and Table 2, the RRs of liver cancer incidence were significantly higher in men than in women in non-Asian studies (2.31 (1.85–2.91) vs. 1.56 (1.31–1.86), P for interaction = 0.01) but not in Asian men and women (1.57 (1.32–1.87) vs. 1.53 (1.14–2.06), P for interaction = 0.88).
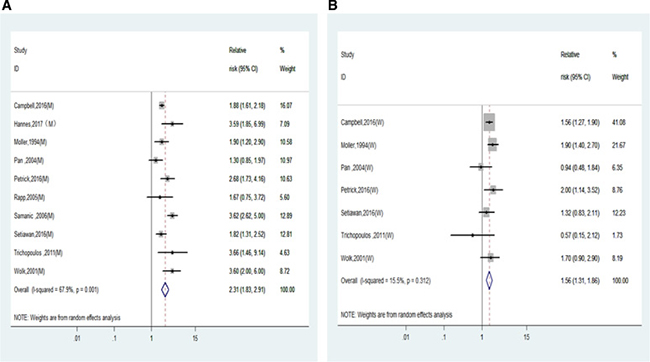
Figure 3: Relative risks of liver cancer incidence in obesity of non-Asian population. (A) Forest plots of liver cancer incidence RR in obese men; (B) Forest plots of liver cancer incidence RR in obese women. RR, relative risk; BMI, body mass index.
There were no differences between HCC and overall liver cancer, study design, disease type, duration of follow-up, study size, adjustment factors (Table 2).
Dose-response meta-analysis
Furthermore, we assessed the dose-response relationship between BMI and liver cancer incidence with 8 studies [23–25, 27, 30, 33–35]. And we found a nonlinear dose-response (P = 0.000) relationship between BMI and the risk of liver cancer incidence. This meta-analysis showed an increased liver cancer incidence of 4% for each 1 kg/m2 increment in BMI as shown in Figure 4A. When adjusted for sex, the risk of liver cancer incidence was increased faster in men (Figure 4B) than in women (Figure 4C). As example, at the point of BMI = 32 kg/m2, the RRs for men and women were 1.61 (1.45–1.79) and 1.41 (1.02–1.94) respectively (Figure 4B and 4C). Similarly, nonlinear dose-response (P = 0.000) meta-analysis was found in non-Asian studies, which showed an increased risk of 7% for each 1 kg/m2 increment in BMI as shown in Figure 4D. The risk increment was more significant in men (Figure 4E) than in women (Figure 4F). As example, the corresponding RR at the point of BMI = 32 kg/m2 for men and women were 2.34 (1.94–2.82) vs. 1.32 (0.83–2,10) (Figure 4E and 4F). Notably, there was only one study available for the does-response meta-analysis in non-Asian women (Figure 4F), this plot need further verification.
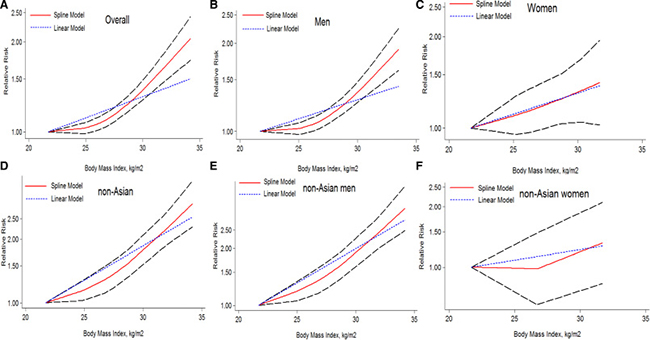
Figure 4: The dose-response analysis of BMI and liver cancer incidence risk. The short dash line represents the linear relationship (per 1 kg/m2 increment). The solid line and the long dash line represent the estimated RR and its 95% CI respectively: (A) overall (1.04 (1.02–1.07) p = 0.000); (B) men (1.04(1.01–1.07) p = 0.000); (C) women (1.03 (1.01–1.06) p = 0.018); (D) non-Asian (1.07 (1.04–1.10) p = 0.000); (E) non-Asian men (1.08 (1.06–1.11) p = 0.000); (F) non-Asian women(1.02 (0.98–1.07) p = 0.301). RR, relative risk; CI, confidence interval; BMI: body mass index.
Meta-regression analysis and sensitivity analysis
Heterogeneity were detected in overweight and obesity men (Table 2). The meta-regression analysis was performed to investigate whether the association between BMI and liver cancer risk was modified by study location, publication year, study size, etc. We found that the study location can explain heterogeneity in overweight group (Non-Asia: I2 = 8.3%, Asia: I2 = 48.5%). Study location of Sweden could explain heterogeneity in obesity group (Sweden: I2 = 43.8%, Non-Sweden: I2 = 0%). The heterogeneities decreased significantly when these Sweden studies were stratified in the group (Table 2) verifying these heterogeneities were contributed by these Sweden studies.
Sensitivity analysis
In a influence analysis in which one study at a time was removed and the rest was analyzed, the summary RR were not materially altered between BMI and liver cancer incidence risk (Supplementary Figure 3). Similarly, the summary RR were not materially altered in the overall obesity men and women (Supplementary Figure 4), as well as non-Asian obesity men and women (Supplementary Figure 5), supporting the robustness of our results.
Publication bias
For BMI and liver cancer incidence in the overweight group, the Egger’s test showed the possibility of publication bias for the analysis (p = 0.022) (Supplementary Figure 6A). However, when the“trim and fill”approach was performed, data was unchanged, suggesting that the effect of publication bias could be negligible. No evidence for publication bias was indicated by Egger’s regression test in the literature on BMI and liver cancer incidence in overall obesity group (P = 0.900) (Supplementary Figure 6B), as well as non-Asian overweight (p = 0.877) and obesity (p = 0.794) (Supplementary Figure 7). Similarly, no publication bias addressing the effect of overall obesity (men: p = 0.429;women: p = 0.370) (Figure 5) as well as non-Asian obesity (men: p = 0.266; women: p = 0.294) (Figure 6).
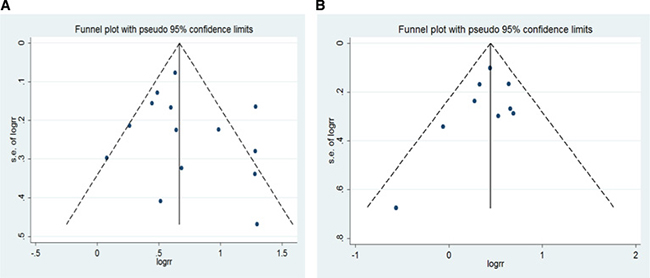
Figure 5: Funnel plot for all studies included in the meta-analysis of BMI and liver cancer incidence risk. (A) obese men (p = 0.429 by Egger’s test); (B) obese women (p = 0.370 by Egger’s test).
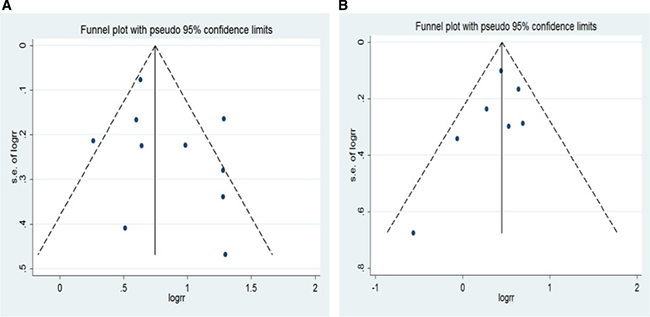
Figure 6: Funnel plot for non-Asian studies included in the meta-analysis of obesity and liver cancer incidence risk. (A) obese men (p = 0.266 by Egger’s test); (B) obese women (p = 0.294 by Egger’s test).
Trial sequential analysis
We will conduct a formal trial sequential analysis (TSA) [37] by using the optimal event size to help to construct sequential monitoring boundaries for our meta-analysis. TSA analysis were conducted for the studies in overall overweight (Supplementary Figure 8A), overall obesity (Supplementary Figure 8B), non-Asian overweight (Supplementary Figure 9A), non-Asian obesity (Supplementary Figure 9B), overall obesity men (Figure 7A), overall obesity women (Figure 7B), non-Asian obesity men (Figure 8A) and non-Asian obesity women (Figure 8B). These cumulative Z-curves did cross the conventional boundaries for benefit and the accrued information size (AIS) boundaries. These results indicated that conclusive evidences were established and that further trials were not required.
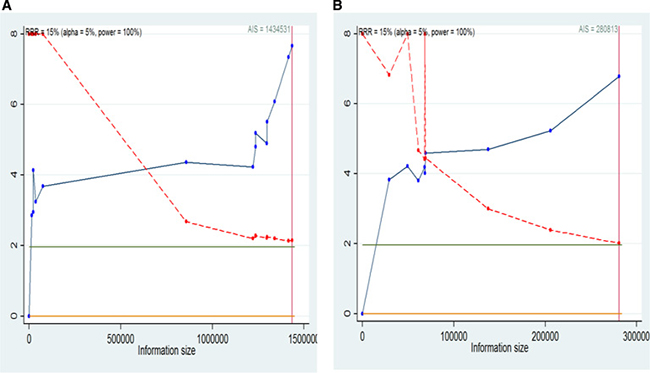
Figure 7: Trial sequential analysis for BMI and liver cancer incidence in overall men and women. (A) Trial sequential analysis of men. The AIS = 1434531,α = 0.05, power = 100%; (B) Trial sequential analysis of women. The AIS = 280813,α = 0.05, power = 100%. A full blue cumulative Z-curve did cross the conventional boundary for benefit and did cross the AIS boundary. RRR, relative risk reduction; AIS, accrued information size.
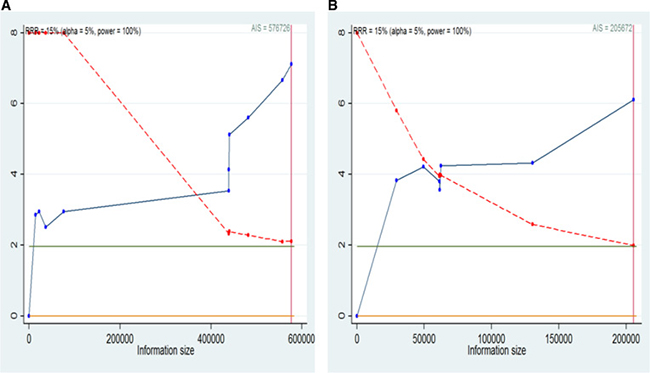
Figure 8: Trial sequential analysis for BMI and liver cancer incidence in non-Asian men and women. (A) Trial sequential analysis of men. The AIS = 576726, α = 0.05, power = 100%; (B) Trial sequential analysis of women. The AIS = 205672,α = 0.05, power = 100%. A full blue cumulative Z-curve did cross the conventional boundary for benefit and did cross the AIS boundary. RRR , relative risk reduction; AIS, accrued information size.
Power analysis
Power analysis were conducted and the power value (Table 3) was 97.17%, 100%, 99.6%, 100%, 100%, 99.99%, 99.99% and 99.99% for the studies in overall overweight (RR = 1.16), overall obesity (RR = 1.83), non-Asian overweight (RR = 1.21), non-Asian obesity (RR = 1.95), overall obesity men (RR = 2.04), overall obesity women (RR = 1.56), non-Asian obesity men (RR = 2.31) and non-Asian obesity women (RR = 1.56) respectively. These power values suggested the quality of evidence were determined to be high.
Table 3: Power value of the evidence in this meta-analysis
Type |
No. of studies |
Overweight (Power %) |
No. of studies |
Obesity (Power %) |
|---|---|---|---|---|
Overall |
13 |
97.17 |
15 |
100 |
Men |
- |
- |
14 |
100 |
Women |
- |
- |
9 |
99.99 |
Non-Asian |
7 |
99.6 |
10 |
100 |
Non-Asian(men) |
- |
- |
10 |
99.99 |
Non-Asian(women) |
- |
- |
7 |
99.99 |
DISCUSSION
Men develop liver cancer more often than women. However, the causes for the gender difference still need to be explored. In this meta-analysis, the liver cancer incidence risk in obesity was found to be higher in non-Asian men than in non-Asian women. Further dose-response analysis showed that a tendency towards higher liver cancer incidence was also seen in men.
The association between BMI of liver cancer incidence is well documented [15–17]. Instead, we tested the gender difference of the BMI effect on liver cancer risks. The previous meta-analysis [14, 16, 38] tried to test the gender difference for the effect of BMI on liver cancer risks with the combination risk data of liver cancer incidence and mortality. However, liver cancer incidence and mortality are defined differently and the combination in these studies make the association analysis vague.
In our meta-analysis, 17 studies were included and we applied TSA to reduce the risk of type I error and testify whether the evidence of our results was reliable. These results indicated that conclusive evidence was established and that further trials were not required. In addition, the power analysis suggests that the meta-analysis have high statistical power. Based on these solid risk data, interaction statistics between men and women have been further analyzed. In addition, a dose-response meta-analysis is firstly conducted for BMI and liver cancer incidence in our work. And thus the gender difference revealed in our meta-analysis is informative.
As countries move towards higher economic level, the prevalence of obesity shift from the female to the male population [39]. However, visceral fat deposition is significantly higher in men than in women whereas subcutaneous fat accumulates more in women [40], which may be contributed by the potential role of sex hormones in instructing adipocyte metabolic programs [41]. It is thought that visceral fat deposition potentially originate from high androgen receptor density [42] and estrogen promotes the accumulation of subcutaneous fat [40]. In addition, Estrogen and estrogen receptor signaling have been found to have a protective role in liver cancer initiation and progression via the IL-6/STAT inflammatory pathways [43, 44]. Visceral fat deposition in obesity men, especially in liver, may involved in these process and contribute partially the strikingly higher male liver cancer incidence [41].
Notably, it was reported that higher free estrogen in women may promote the cell proliferation and growth in breast cancer [37, 45], kidney cancer [46, 47] and lung cancer [48, 49], but it could suppress liver cancer cell proliferation and growth [11, 50]. These discrepancy of estrogen effect may partially explain the high incidence of breast cancer, kidney cancer and lung cancer in women, but low incidence of liver cancer in women. Meanwhile, the bioavailable estradiol also increase in overweight and obese postmenopausal women, but may act differently as in the premenopausal women [45]. Unfortunately, there was no sufficient information to compare the risk of pre-menopausal women and post-menopausal women in these included studies.
Of note, overweight/obesity and its related morbidities are a growing health problem claiming 2.8 million lives annually [51], the obesity may partially contribute to the development of liver cancer. Obesity is an avoidable factor, as is smoking and alcohol. Our study suggested that an effective intervention to reduce BMI will reduce liver cancer risks, particularly in non-Asian men. On the other hand, the majority of the burden of liver cancer is in developing countries, where almost 80% of the cases are associated with chronic hepatitis B virus (HBV) or hepatitis C virus (HCV) infections, instead of obesity [52], which may be helpful to explain why the BMI–liver cancer association is higher in non-Asian than in Asian populations.
There were several potential limitations in our study that should be considered. First, although the studies had been adjusted for important risk factors, unmeasured factors related to BMI may still have influenced results of individual studies. Second, the relatively small number of studies limited conclusions from further subgroup analyses. Third, some important confounders had not been measured with sufficient precision. Only some article had considered alcohol consumption, cigarette smoking, hepatitis infection status, dietary factors and physical activity. Lack of adjustment for these important risk factors limited the ability to generalize between obesity and liver cancer.
In conclusion, the association of BMI with risk of liver cancer varies by gender. The obese men had significant higher liver cancer incidence than obese women, especially in non-Asian countries. Even stricter body weight control is strongly suggested for liver cancer prevention, especially for men in non-Asian countries.
MATERIALS AND METHODS
Search strategy
We searched English-language databases (PUBMED and EMBASE) and Chinese literature databases (CNKI and WanFang) to January 12, 2017 for studies on the relationship between BMI and liver cancer risk. Our research consisted of terms related to ‘body mass index’, ‘BMI’, or ‘obesity’ or ‘excess body weight’ or ‘overweight’; ‘liver cancer’ or ‘hepatocellular carcinoma’ or ‘HCC’; ‘risk’ or ‘incidence’ to identify eligible studies. No language limits were set. In addition, the reference lists of selected research papers were manually reviewed to find additional articles.
Study selection
Studies were included in the meta-analysis if they fulfilled the following criteria: (1) published as an original article; (2) Cohort or case–control studies study in which liver cancer incidence or mortality was an outcome; (3) having clear description of normal weight, overweight and obesity defined by BMI; (4) the studies reporting risk estimates with the corresponding 95% confidence intervals (95% CI) or sufficient information to calculate them; (5) the RR and corresponding 95% CI were at least adjusted for age; (6) reported outcomes of men and women separately. When the same population was shared by multiple studies, only the study with most detailed information or the largest sample size was included.
Data extraction
Three authors (KFY, ZML and LSW) separately screened the title and abstract of the retrieved studies and then reviewed the full texts to extract studies that met the inclusion criteria of this meta-analysis (Figure 1). NO study was excluded because the author of the study was unable to contact the published researcher. Data extraction in this meta-analysis recorded the following elements: name of the first author, publication year, study location, study type, age, follow-up years, sample size of gender, BMI measure method, BMI categories and risk estimate for each BMI category and adjustment factors. OR was used in these case-control studies and RR was used in these cohort studies. The conversion OR to RR is potentially helpful in meta-analyses, where different metrics can prevent studies from being combined [53]. The effect measure of choice for cohort studies was risk ratio (RR) and that of case-control studies was odds ratio (OR). When more than one RR was provided in a study, all of them were extracted and applied the data according to subgroup analysis.
Quality assessment
The Newcastle-Ottawa Scale (NOS) procedure was used to assess the quality of the study. Three parameters of quality including selection, comparability, and outcome (cohort studies) or exposure (case-control studies) were included [54–56]. The NOS awards a maximum of nine points to each case- control study: four for the quality of selection (adequate case definition, representativeness of cases, selection of controls, definition of controls), two for comparability (confounding) and three for the quality of the exposure (ascertainment of exposure, same method of ascertainment of cases and controls). It awards a maximum of nine points to each cohort study: four for the quality of selection (representativeness, selection of non-exposed cohort, ascertainment of exposure, no disease at start of study), two for comparability (confounding) and three for the quality of the outcome (assessment of outcome, length of follow-up and adequacy of follow-up). Studies with NOS values of six or greater were considered moderate to high-quality studies and those with a NOS value of less than six were regarded low-quality studies.
A high-quality study was defined as a study with ≥ 7 points [55].
Statistical analysis
We followed the WHO international classification and defined body mass categories as follows: underweight (< 18.5 kg/m2), normal weight (18.5 to 24.9 kg/m2), overweight (25.0 to 29.9 kg/m2) and obesity (≥ 30.0 kg/m2) were applied on defining BMI-categories primarily. When non-standard BMI categories were provided, the category closing to the WHO definition was selected. Data were analyzed using a random-effects model [55, 57]. Dose-response meta-analyses were conducted by using the GLST command, of which the generalized least-squares method was used for trend estimation of summarized dose-response data, based on the Greenland and Longnecker method [58]. Influence analysis was performed to estimate the influence of each individual study on the summary results Evidence of publication bias was assessed by visual inspection of funnel plots using Egger’s regression test [59]. Interactions in subgroup were evaluated by random-effects analysis. A 2-tailed P value of < 0.05 was considered a criterion for statistical significance [60], Power calculations were performed post hoc as per the method described by Cafri et al. [61]. We based on the previous meta-analysis [62, 63] and cafri’s methodology to analysis the statistical power of relative risk of the liver cancer. The macro and SAS code used were included in the online, http://link.springer.com/article/10.3758/BRM.41.1.35. Statistical analyses were performed by Stata 12.0 (Stata Corporation, College Station, TX, USA) and P values of two-sided less than 0.05 were considered statistically significant. Heterogeneity among studies was assessed using I2 statistics, which test total variation across studies [55, 56, 64, 65].
Trial sequential analysis
In meta-analyses, it is important to minimize the risk of reaching a false-positive or false-negative conclusion. However, repeated significance tests of sparse and accumulated data are prone to yielding random errors, which increase the risk of type I errors [66]. In order to determine whether the evidence from a meta-analysis is reliable and conclusive, TSA should be used. This method assesses the risk of random errors and helps determine whether there is a need for additional trials [67]. We calculated the required information size based on a relative risk reduction of 15 % in incidence and mortality of liver cancer. The type I error (α) and power (1 – β) were set as 0.05 and 0.80, respectively. TSA was conducted using stata12.0. The blue line shows the cumulative Z-score of the meta-analysis, and the inward sloping red dash lines represent the truncated trial sequential monitoring boundaries.
ACKNOWLEDGMENTS AND FUNDING
This work is supported by grants from National Natural Science Foundation of China (81472758, U1302225,31170783) and grants from Shanghai (E09013, 17YF1416700, SKLGE-1510, 2016MHJC01&05).
CONFLICTS OF INTEREST
No conflicts of interest was declared.
REFERENCES
1. Ferlay J, Shin HR, Bray F, Forman D, Mathers C, Parkin DM. Estimates of worldwide burden of cancer in 2008: GLOBOCAN 2008. Int J Cancer. 2010; 127:2893–917. http://doi.org/10.1002/ijc.25516
2. Torre LA, Bray F, Siegel RL, Ferlay J, Lortet-Tieulent J, Jemal A. Global cancer statistics, 2012. CA Cancer J Clin. 2015; 65:87–108. http://doi.org/10.3322/caac.21262
3. El-Serag HB, Rudolph KL. Hepatocellular carcinoma: epidemiology and molecular carcinogenesis. Gastroenterology. 2007; 132:2557–76. http://doi.org/10.1053/j.gastro.2007.04.061
4. Llovet JM, Burroughs A, Bruix J. Hepatocellular carcinoma. Lancet. 2003; 362:1907–17. http://doi.org/10.1016/S0140-6736(03)14964-1
5. McGlynn KA, London WT. Epidemiology and natural history of hepatocellular carcinoma. Best Pract Res Clin Gastroenterol. 2005; 19:3–23. http://doi.org/10.1016/j.bpg.2004.10.004
6. Polesel J, Zucchetto A, Montella M, Dal Maso L, Crispo A, La Vecchia C, Serraino D, Franceschi S, Talamini R. The impact of obesity and diabetes mellitus on the risk of hepatocellular carcinoma. Ann Oncol. 2009; 20:353–7. http://doi.org/10.1093/annonc/mdn565
7. Michelotti GA, Machado MV, Diehl AM. NAFLD, NASH and liver cancer. Nat Rev Gastroenterol Hepatol. 2013; 10:656–65. http://doi.org/10.1038/nrgastro.2013.183
8. Montalto G, Cervello M, Giannitrapani L, Dantona F, Terranova A, Castagnetta LA. Epidemiology, risk factors, and natural history of hepatocellular carcinoma. Ann N Y Acad Sci. 2002; 963:13–20.
9. Jemal A, Bray F, Center MM, Ferlay J, Ward E, Forman D. Global cancer statistics. CA Cancer J Clin. 2011; 61:69–90. http://doi.org/10.3322/caac.20107
10. Ferlay J, Soerjomataram I, Dikshit R, Eser S, Mathers C, Rebelo M, Parkin DM, Forman D, Bray F. Cancer incidence and mortality worldwide: sources, methods and major patterns in GLOBOCAN 2012. Int J Cancer. 2015; 136:E359–86. http://doi.org/10.1002/ijc.29210
11. Yeh SH, Chen PJ. Gender disparity of hepatocellular carcinoma: the roles of sex hormones. Oncology. 2010; 78 (Suppl 1):172–9. http://doi.org/10.1159/000315247.
12. Li Z, Tuteja G, Schug J, Kaestner KH. Foxa1 and Foxa2 are essential for sexual dimorphism in liver cancer. Cell. 2012; 148:72–83. http://doi.org/10.1016/j.cell.2011.11.026
13. Finucane MM, Stevens GA, Cowan MJ, Danaei G, Lin JK, Paciorek CJ, Singh GM, Gutierrez HR, Lu Y, Bahalim AN, Farzadfar F, Riley LM, Ezzati M, et al. National, regional, and global trends in body-mass index since 1980: systematic analysis of health examination surveys and epidemiological studies with 960 country-years and 9.1 million participants. Lancet. 2011; 377:557–67. http://doi.org/10.1016/S0140-6736(10)62037-5
14. Wang Y, Wang B, Shen F, Fan J, Cao H. Body mass index and risk of primary liver cancer: a meta-analysis of prospective studies. Oncologist. 2012; 17:1461–8. http://doi.org/10.1634/theoncologist.2012-0066
15. Larsson SC, Wolk A. Overweight, obesity and risk of liver cancer: a meta-analysis of cohort studies. Br J Cancer. 2007; 97:1005–8. http://doi.org/10.1038/sj.bjc.6603932
16. Chen Y, Wang X, Wang J, Yan Z, Luo J. Excess body weight and the risk of primary liver cancer: an updated meta-analysis of prospective studies. Eur J Cancer. 2012; 48:2137–45. http://doi.org/10.1016/j.ejca.2012.02.063
17. Rui R, Lou J, Zou L, Zhong R, Wang J, Xia D, Wang Q, Li H, Wu J, Lu X, Li C, Liu L, Xia J, et al. Excess body mass index and risk of liver cancer: a nonlinear dose-response meta-analysis of prospective studies. PLoS One. 2012; 7:e44522. http://doi.org/10.1371/journal.pone.0044522
18. Welzel TM, Graubard BI, Quraishi S, Zeuzem S, Davila JA, El-Serag HB, McGlynn KA. Population-attributable fractions of risk factors for hepatocellular carcinoma in the United States. Am J Gastroenterol. 2013; 108:1314–21. http://doi.org/10.1038/ajg.2013.160
19. Moller H, Mellemgaard A, Lindvig K, Olsen JH. Obesity and cancer risk: a Danish record-linkage study. Eur J Cancer. 1994; 30A:344–50.
20. Wolk A, Gridley G, Svensson M, Nyren O, McLaughlin JK, Fraumeni JF, Adam HO. A prospective study of obesity and cancer risk (Sweden). Cancer Causes Control. 2001; 12:13–21.
21. Yu MW, Yang YC, Yang SY, Cheng SW, Liaw YF, Lin SM, Chen CJ. Hormonal markers and hepatitis B virus-related hepatocellular carcinoma risk: a nested case-control study among men. J Natl Cancer Inst. 2001; 93:1644–51.
22. Pan SY, Johnson KC, Ugnat AM, Wen SW, Mao Y, Canadian Cancer Registries Epidemiology Research G. Association of obesity and cancer risk in Canada. Am J Epidemiol. 2004; 159:259–68.
23. Kuriyama S, Tsubono Y, Hozawa A, Shimazu T, Suzuki Y, Koizumi Y, Suzuki Y, Ohmori K, Nishino Y, Tsuji I. Obesity and risk of cancer in Japan. Int J Cancer. 2005; 113:148–57. http://doi.org/10.1002/ijc.20529
24. Oh SW, Yoon YS, Shin SA. Effects of excess weight on cancer incidences depending on cancer sites and histologic findings among men: Korea National Health Insurance Corporation Study. J Clin Oncol. 2005; 23:4742–54. http://doi.org/10.1200/JCO.2005.11.726
25. Rapp K, Schroeder J, Klenk J, Stoehr S, Ulmer H, Concin H, Diem G, Oberaigner W, Weiland SK. Obesity and incidence of cancer: a large cohort study of over 145,000 adults in Austria. Br J Cancer. 2005; 93:1062–7. http://doi.org/10.1038/sj.bjc.6602819
26. Samanic C, Chow WH, Gridley G, Jarvholm B, Fraumeni JF, Jr. Relation of body mass index to cancer risk in 362,552 Swedish men. Cancer Causes Control. 2006; 17:901–9. http://doi.org/10.1007/s10552-006-0023-9
27. Jee SH, Yun JE, Park EJ, Cho ER, Park IS, Sull JW, Ohrr H, Samet JM. Body mass index and cancer risk in Korean men and women. Int J Cancer. 2008; 123:1892–6. http://doi.org/10.1002/ijc.23719
28. Inoue M, Noda M, Kurahashi N, Iwasaki M, Sasazuki S, Iso H, Tsugane S, Japan Public Health Center-based Prospective Study G. Impact of metabolic factors on subsequent cancer risk: results from a large-scale population-based cohort study in Japan. Eur J Cancer Prev. 2009; 18:240–7. http://doi.org/10.1097/CEJ.0b013e3283240460
29. Trichopoulos D, Bamia C, Lagiou P, Fedirko V, Trepo E, Jenab M, Pischon T, Nothlings U, Overved K, Tjonneland A, Outzen M, Clavel-Chapelon F, Kaaks R, et al. Hepatocellular carcinoma risk factors and disease burden in a European cohort: a nested case-control study. J Natl Cancer Inst. 2011; 103:1686–95. http://doi.org/10.1093/jnci/djr395
30. Guo L, Li N, Wang G, Su K, Li F, Yang L, Ren J, Chang S, Chen S, Wu S, He J, Dai M. [Body mass index and cancer incidence:a prospective cohort study in northern China]. Zhonghua Liu Xing Bing Xue Za Zhi. 2014; 35:231–6. [Article in Chinese].
31. Liu Y, Warren Andersen S, Wen W, Gao YT, Lan Q, Rothman N, Ji BT, Yang G, Xiang YB, Shu XO, Zheng W. Prospective cohort study of general and central obesity, weight change trajectory and risk of major cancers among Chinese women. Int J Cancer. 2016; 139:1461–70. http://doi.org/10.1002/ijc.30187
32. Petrick JL, Freedman ND, Demuth J, Yang B, Van Den Eeden SK, Engel LS, McGlynn KA. Obesity, diabetes, serum glucose, and risk of primary liver cancer by birth cohort, race/ethnicity, and sex: Multiphasic health checkup study. Cancer Epidemiol. 2016; 42:140–6. http://doi.org/10.1016/j.canep.2016.04.009
33. Setiawan VW, Lim U, Lipworth L, Lu SC, Shepherd J, Ernst T, Wilkens LR, Henderson BE, Le Marchand L. Sex and Ethnic Differences in the Association of Obesity With Risk of Hepatocellular Carcinoma. Clin Gastroenterol Hepatol. 2016; 14:309–16. http://doi.org/10.1016/j.cgh.2015.09.015
34. Campbell PT, Newton CC, Freedman ND, Koshiol J, Alavanja MC, Beane Freeman LE, Buring JE, Chan AT, Chong DQ, Datta M, Gaudet MM, Gaziano JM, Giovannucci EL, et al. Body Mass Index, Waist Circumference, Diabetes, and Risk of Liver Cancer for U.S. Adults. Cancer Res. 2016; 76:6076–83. http://doi.org/10.1158/0008-5472.CAN-16-0787
35. Hagstrom H, Tynelius P, Rasmussen F. High BMI in late adolescence predicts future severe liver disease and hepatocellular carcinoma: a national, population-based cohort study in 1.2 million men. Gut. 2017. http://doi.org/10.1136/gutjnl-2016-313622
36. Low S, Chin MC, Deurenberg-Yap M. Review on epidemic of obesity. Ann Acad Med Singapore. 2009; 38:57–9.
37. Pogue JM, Yusuf S. Cumulating evidence from randomized trials: utilizing sequential monitoring boundaries for cumulative meta-analysis. Control Clin Trials. 1997; 18:580–93; discussion 661–6.
38. Xue K, Li FF, Chen YW, Zhou YH, He J. Body mass index and the risk of cancer in women compared with men: a meta-analysis of prospective cohort studies. Eur J Cancer Prev. 2017; 26:94–105. http://doi.org/10.1097/CEJ.0000000000000231
39. Kanter R, Caballero B. Global gender disparities in obesity: a review. Adv Nutr. 2012; 3:491–8. http://doi.org/10.3945/an.112.002063
40. Ibrahim MM. Subcutaneous and visceral adipose tissue: structural and functional differences. Obes Rev. 2010; 11:11–8. http://doi.org/10.1111/j.1467-789X.2009.00623.x
41. Cheung OK, Cheng AS. Gender Differences in Adipocyte Metabolism and Liver Cancer Progression. Front Genet. 2016; 7:168. http://doi.org/10.3389/fgene.2016.00168
42. Freedland ES. Role of a critical visceral adipose tissue threshold (CVATT) in metabolic syndrome: implications for controlling dietary carbohydrates: a review. Nutr Metab (Lond). 2004; 1:12. http://doi.org/10.1186/1743-7075-1-12
43. Naugler WE, Sakurai T, Kim S, Maeda S, Kim K, Elsharkawy AM, Karin M. Gender disparity in liver cancer due to sex differences in MyD88-dependent IL-6 production. Science. 2007; 317:121–4. http://doi.org/10.1126/science.1140485
44. Yang W, Lu Y, Xu Y, Xu L, Zheng W, Wu Y, Li L, Shen P. Estrogen represses hepatocellular carcinoma (HCC) growth via inhibiting alternative activation of tumor-associated macrophages (TAMs). J Biol Chem. 2012; 287:40140–9. http://doi.org/10.1074/jbc.M112.348763
45. Key TJ, Appleby PN, Reeves GK, Roddam A, Dorgan JF, Longcope C, Stanczyk FZ, Stephenson HE Jr, Falk RT, Miller R, Schatzkin A, Allen DS, Fentiman IS, et al. Body mass index, serum sex hormones, and breast cancer risk in postmenopausal women. J Natl Cancer Inst. 2003; 95:1218–26.
46. Kirkman H. Estrogen-induced tumors of the kidney. III. Growth characteristics in the Syrian hamster. Natl Cancer Inst Monogr. 1959; 1:1–57.
47. Hou X, Li JJ, Chen W, Li SA. Estrogen-induced proto-oncogene and suppressor gene expression in the hamster kidney: significance for estrogen carcinogenesis. Cancer Res. 1996; 56:2616–20.
48. Tang H, Liao Y, Xu L, Zhang C, Liu Z, Deng Y, Jiang Z, Fu S, Chen Z, Zhou S. Estrogen and insulin-like growth factor 1 synergistically promote the development of lung adenocarcinoma in mice. Int J Cancer. 2013; 133:2473–82. http://doi.org/10.1002/ijc.28262
49. Abe K, Miki Y, Ono K, Mori M, Kakinuma H, Kou Y, Kudo N, Koguchi M, Niikawa H, Suzuki S, Evans DB, Sugawara S, Suzuki T, et al. Highly concordant coexpression of aromatase and estrogen receptor beta in non-small cell lung cancer. Hum Pathol. 2010; 41:190–8. http://doi.org/10.1016/j.humpath.2009.07.010
50. Villa E. Role of estrogen in liver cancer. Womens Health (Lond). 2008; 4:41–50. http://doi.org/10.2217/17455057.4.1.41
51. Alwan A, Alwan A. Global status report on noncommunicable diseases 2010. Women. 2011; 47:2562–3.
52. El-Serag HB. Epidemiology of viral hepatitis and hepatocellular carcinoma. Gastroenterology. 2012; 142:1264–73 e1. http://doi.org/10.1053/j.gastro.2011.12.061
53. Grant RL. Converting an odds ratio to a range of plausible relative risks for better communication of research findings. Bmj. 2014; 348:f7450.
54. Tan W, Gao M, Liu N, Zhang G, Xu T, Cui W. Body Mass Index and Risk of Gallbladder Cancer: Systematic Review and Meta-Analysis of Observational Studies. Nutrients. 2015; 7:8321–34. http://doi.org/10.3390/nu7105387
55. Li ZM, Wu ZX, Han B, Mao YQ, Chen HL, Han SF, Xia JL, Wang LS. The association between BMI and gallbladder cancer risk: a meta-analysis. Oncotarget. 2016; 7:43669–79. http://doi.org/10.18632/oncotarget.9664
56. Hu N, Li ZM, Liu JF, Zhang ZZ, Wang LS. An overall and dose-response meta-analysis for thyrotropin and thyroid cancer risk by histological type. Oncotarget. 2016; 7:47750–9. http://doi.org/10.18632/oncotarget.10282
57. DerSimonian R, Laird N. Meta-analysis in clinical trials. Control Clin Trials. 1986; 7:177–88.
58. Greenland S, Longnecker MP. Methods for trend estimation from summarized dose-response data, with applications to meta-analysis. Am J Epidemiol. 1992; 135:1301–9.
59. Egger M, Davey Smith G, Schneider M, Minder C. Bias in meta-analysis detected by a simple, graphical test. BMJ. 1997; 315:629–34.
60. Altman DG, Bland JM. Interaction revisited: the difference between two estimates. BMJ. 2003; 326:219.
61. Cafri G, Kromrey JD, Brannick MT. A SAS macro for statistical power calculations in meta-analysis. Behav Res Methods. 2009; 41:35–46. http://doi.org/10.3758/BRM.41.1.35
62. Zhou JG, Tian X, Cheng L, Zhou Q, Liu Y, Zhang Y, Bai YJ, Ma H. The Risk of Neutropenia and Leukopenia in Advanced Non-Small Cell Lung Cancer Patients Treated With Erlotinib: A Prisma-Compliant Systematic Review and Meta-Analysis. Medicine (Baltimore). 2015; 94:e1719. http://doi.org/10.1097/MD.0000000000001719
63. Ma H, Liu Y, Huang L, Zeng XT, Jin SH, Yue GJ, Tian X, Zhou JG. The Adverse Events of Oxycodone in Cancer-Related Pain: A Systematic Review and Meta-Analysis of Randomized Controlled Trials. Medicine (Baltimore). 2016; 95:e3341. http://doi.org/10.1097/MD.0000000000003341
64. Higgins JP, Thompson SG. Quantifying heterogeneity in a meta-analysis. Stat Med. 2002; 21:1539–58. http://doi.org/10.1002/sim.1186
65. Zhang ZZ, Chen Q, Kong CY, Li ZM, Wang LS. Circulating thyroid stimulating hormone receptor messenger RNA and differentiated thyroid cancer: A diagnostic meta-analysis. Oncotarget. 2017; 8:6623–6629. http://doi.org/10.18632/oncotarget.14251
66. Brok J, Thorlund K, Gluud C, Wetterslev J. Trial sequential analysis reveals insufficient information size and potentially false positive results in many meta-analyses. J Clin Epidemiol. 2008; 61:763–9. http://doi.org/10.1016/j.jclinepi.2007.10.007
67. Thorlund K, Devereaux PJ, Wetterslev J, Guyatt G, Ioannidis JP, Thabane L, Gluud LL, Als-Nielsen B, Gluud C. Can trial sequential monitoring boundaries reduce spurious inferences from meta-analyses? Int J Epidemiol. 2009; 38:276–86. http://doi.org/10.1093/ije/dyn179