
INTRODUCTION
Spontaneous intracerebral hemorrhage (sICH) accounts for 70% of cases of hemorrhagic stroke, and is associated with high rates of mortality and morbidity [1–3]. Secondary brain injury is thought to result from the development of an inflammatory response [4]. The immune responses developing around the hematoma consist of leukocyte infiltration, microglia activation, and release of various cytokines [5–7]. In addition, a systemic inflammatory response develops, which is reflected by the elevated number of inflammatory cells, such as neutrophils, monocytes, lymphocytes, as well as the presence of inflammatory biomarkers such as C-reactive proteins [8, 9]. Many previous studies reported a role for inflammatory biomarkers in predicting prognosis in sICH. For instance, peripheral blood leucocyte counts were significantly associated with early neurologic deterioration [4, 8] and prognosis [10]. Recently research have indicated that the neutrophil to lymphocyte ratio (NLR) is an independent predictor for clinical outcomes for various cancer types [11, 12], cardiovascular disorders and ischemic stroke [13–16]. The NLR is a reflection of innate (neutrophils) and adaptive (lymphocytes) immune responses. The elevated NLR with increasing neutrophils and lymphocyte depletion indicates the break of immune system balance. The NLR is considered a biomarker for assessing the balance of pro-tumor and anti-tumor inflammation [17], and a higher NLR indicates an increased risk for tumor development [18]. In addition, NLR have been considered a poor prognostic marker in patients with acute coronary syndromes [19] and acute ischemic stroke [20], because NLR reflects recruitment of immune cells and release of inflammatory cytokines. An elevation of peripheral neutrophils increases the damage to the blood brain barrier and neuronal damage, which results in a new phase of inflammatory reaction and further aggravates the damage to the brain tissue [21].
However, the association of NLR and the clinical outcomes in sICH is still up to debate. Previous studies showed that NLR had no significant effect on the mortality [22, 23] and 90-day poor outcomes [23, 24] after multivariate logistic regression. One study [24] showed that an elevated NLR increases the in-hospital mortality in ICH patients rather than 3-month mortality. However, some studies [13, 25, 26] demonstrated that a high NLR was an independent predictor of poor clinical outcomes. Therefore, due to the controversial conclusion, we conducted a meta-analysis to assess the prognostic role of NLR in patients with sICH.
MATERIALS AND METHODS
Collect the eligible articles
Online databases PubMed, EMBASE, and Cochrane Central Register of Controlled Trials were queried for papers published from the time of inception of the database to May 1, 2017 using the key words ‘intracerebral hemorrhage’ OR ‘intracranial hemorrhage’ AND ‘neutrophil’ AND ‘lymphocyte’. We reviewed the title and abstract of articles and found the appropriate studies. Additional reports were retrieved by reviewing the references included in the selected articles.
Include criteria and exclude criteria
We reviewed the titles and abstracts to find the related articles. Then, two reviewers reviewed the full-text of the retrieved articles independently. The articles were included if the met the following inclusion criteria: 1- patients admitted for spontaneous intracerebral hemorrhage; 2- The odds ratio and 95% confidence intervals of mortality or the poor outcomes were provided or could be calculated from the published data; 3- The article being a randomized controlled study (RCTs), cohort or case-control study. Exclusion criteria were: 1- the article is a review, case report, or animal study; 2- The article is not in English; 3- without odds ratio and without related data used to calculate odds ratio.
Data extraction
Two independent reviewers extracted the data from the included studies and discussed any inconsistencies. Data extraction was standardized based on pre-selected domains including author information, year of publication, country, study design, number of patients, patient demographics such as age and sex, National Institutes of Health Stroke Scale (NIHSS) or Glass coma scale (GCS), hematoma volume, and cut-off value of NLR, study period, odds ratio (OR) and 95% CI on the mortality and 90-day poor outcomes. If the ORs of univariate regression analysis and multivariate regression analysis were available, the values of multivariate regression analysis would be used. The mortality and the poor outcomes were considered the end points. A Rankin Scale (mRS) from 3 to 6 was considered a poor outcome.
Quality assessment of the selected articles
The quality of included studies was assessed by two reviewers independently with the Newcastle-Ottawa scale criteria [27] for cohort and case-control studies. Studies with Newcastle-Ottawa scale score > 6 were considered high quality studies.
Data analysis
The data were pooled by the Review Manager Version 5.3 (Cochrane collaboration, Oxford, UK) and publication bias was assessed by STATA 13.0 (STATA Corporation, College Station, TX). The OR and 95% confidence intervals were pooled to analyze the correlation of NLR with mortality and poor outcomes. The fixed-effects model was adopted if I² < 50% or p > 0.10, otherwise, the random-effects was used. The sensitivity analysis was used to confirm the robustness of the pool outcomes in studies with large heterogeneity [28]. In addition, subgroup analyses was performed to determine the origin of heterogeneity. Publication bias was assessed by Funnel plot with Begg rank correlation. A p value < 0.05 was set for statistical significance.
RESULTS
Literature research
The studies were searched according to the PRISMA flow diagram [29] (Figure 1). The titles and abstracts of 68 articles were reviewed. Forty-five articles failed to meet the inclusion criteria and were excluded. After assessing the full-text of the remaining 23 articles, 18 articles were excluded for not meeting the inclusion criteria (15), one article was written in Japanese and 2 articles did not include the required data. Five articles were included in the analysis.
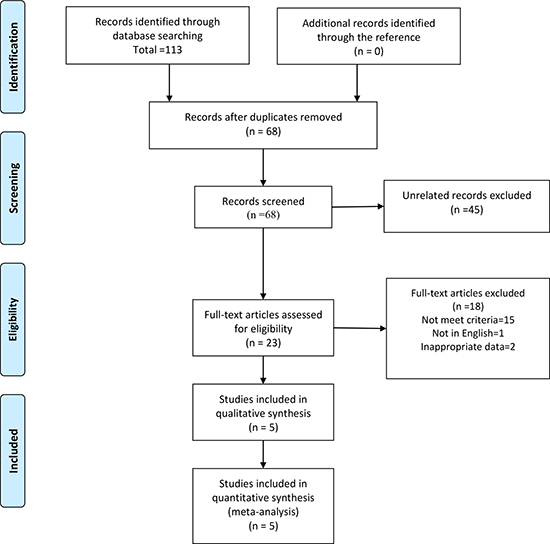
Figure 1: The flow diagram of procedure to search the eligible studies.
Characteristics of included studies
The data for 1944 subjects were retrieved from the 5 articles included in this meta-analysis. Three articles were conducted in china and two were done Europe. All articles (2 prospective and 3 retrospective) were published between 2016 and 2017. The main cut-off values for NLR ranged from 4.08 to 7.35, and two articles also reported other cut-off values to find the optimal value. All of ORs and 95% CI are based on the multiple regression analysis, except for the OR with cut-off of 8.508 reported by Giede-Jeppe [24]. All included articles were of high quality based on a Newcastle-Ottawa scale score > 6 (Table 1).
Table 1: (A) Baseline characteristics of included studies
Author |
Year |
Country |
Study design |
Patients (n) |
Sex (M/F) |
Mean age (years) |
NIHSS |
GCS |
Study period |
NOS score |
|---|---|---|---|---|---|---|---|---|---|---|
Tao, C. |
2017 |
China |
Retrospective |
336 |
216/120 |
58.5 |
- |
11 |
2010–2013 |
7 |
Sun, Y. |
2017 |
China |
Prospective |
352 |
234/118 |
64.2 |
7.2 |
- |
2011–2014 |
8 |
Giede-Jeppe, A. |
2017 |
Germany |
Prospective |
855 |
459/396 |
71.5 |
14.3 |
12.2 |
2006–2014 |
8 |
Wang, F. |
2016 |
China |
Retrospective |
224 |
141/83 |
67.9 |
- |
12.6 |
2012–2014 |
7 |
Lattanzi, S. |
2016 |
Italy |
Retrospective |
177 |
63/114 |
67.1 |
9 |
- |
2008–2015 |
8 |
NIHSS: National Institutes of Health Stroke Scale, GCS: Glass coma scale, NOS: Newcastle-Ottawa scale score.
Table 1: (B) Baseline characteristics of included studies
Author |
Hematoma volume (ml) |
Time of laboratory test |
Main cut-off value |
Other cut-off values |
poor outcome (OR)# |
mortality (OR)# |
Follow up |
|---|---|---|---|---|---|---|---|
Tao, C. |
15.8 |
admission |
6.62 |
- |
2.6 (1.4–4.7) |
5.1 (2.6–8.6) |
90-day |
Sun, Y. |
10.7 |
non-admission |
4.08 |
7.85 |
0.93 (0.34–2.57) 1.83 (0.62–5.39) |
1.51 (0.34–6.61) 0.64 (0.15–2.76) |
90-day 90-day |
Giede-Jeppe, A. |
14.4 |
admission |
4.66 4.66 |
8.508 |
0.983 (0.939–1.029) 2.251 (1.543–3.282)* |
0.967 (0.939–0.997) 0.974 (0.945–1.004) 1.626 (1.186–2.231)* |
In-hospital 90-day 90-day |
Wang, F. |
14.9 |
non-admission admission |
7.35 7.35 |
- |
– |
1.091 (1.002–1.188) 0.852 (0.608–1.194) |
In-hospital In-hospital |
Lattanzi, S. |
8.1 |
admission |
4.58 |
- |
1.16 (1.01–1.33) |
– |
90-day |
#: multivariate regression analysis, *: univariate regression analysis, OR: odds ratio.
Overall analysis
Association of NLR and in-hospital mortality
Two articles reporting data from 1079 subjects were pooled to evaluate the relationship between NLR and in-hospital mortality. The result showed that a high NLR significantly increased the in-hospital mortality with OR of 0.97 (95% CI, 0.94–0.99, p = 0.02, Figure 2) using a Fixed-effect model. No heterogeneity was detected between the 2 articles (I2 = 0%, p = 0.46).
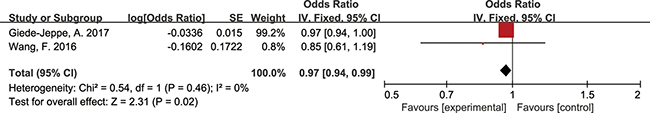
Figure 2: Forest plots for association of NLR and in-hospital mortality.
Association of NLR and 90-day mortality
Three articles reported the OR and 95% CI of NLR on mortality in 1543 patients. After pooling the data, we found that a high NLR was associated with a higher risk of death with an OR of 2.43 (95% CI, 1.01–5.83, p = 0.047, Figure 3) using a Random-effect model. The OR values have no significant change with the exclusion of a single article.
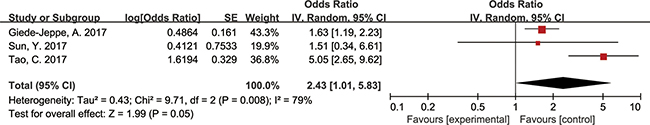
Figure 3: Forest plots for association of NLR and 90-day mortality.
Association of NLR and 90-day poor outcomes
In four articles covering 1720 patients, the association of NLR and the poor outcomes was assessed using a Random-effect model. Analysis revealed that the NLR had no statistically significant effect on poor outcomes with an OR of 1.17 (95% CI, 0.93–1.47, p = 0.18, Figure 4). After the sensitivity analysis, the OR values have no significant change with the exclusion of a single article. (Figure 5).
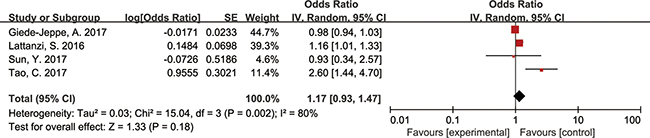
Figure 4: Forest plots for association of NLR and poor outcomes.
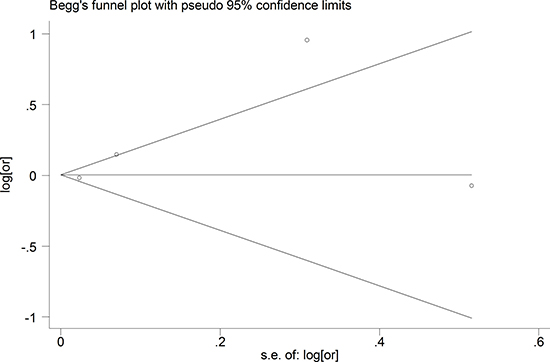
Figure 5: The Begg publication bias plot of the studies reported 90-day poor outcomes, and no publication bias was found in these studies with P = 0.734.
Subgroup analyses
The subgroup analyses of mortality (Table 2) and poor outcomes (Table 3) were performed based on countries, time of laboratory test, hematoma volume, cut-off values and duration of follow up. The time of laboratory test was divided into admission group and non-admission group. The admission group included the articles reporting lab data at the time of admission. The articles that collected the blood sample more than 8 hours after admission [22] were included in the non-admission group.
Table 2: Subgroup analyses results of 90-days mortality
Groups |
N |
Model |
Pooled OR (95% CI) |
p value |
Heterogeneity (P, I2) |
|---|---|---|---|---|---|
Total |
3 |
random |
2.43 (1.01–5.83) |
0.047 |
0.008, 79% |
China |
2 |
random |
3.34 (1.09–10.27) |
0.035 |
0.14, 54% |
Europe |
1 |
- |
1.63 (1.19–2.23) |
0.003 |
- |
Admission NLR |
2 |
random |
2.76 (0.91–8.37) |
0.07 |
0.002, 90% |
Non-admission NLR |
1 |
- |
1.51 (0.34–6.61) |
0.58 |
- |
Smaller hematoma |
1 |
- |
1.51 (0.34–6.61) |
0.58 |
- |
Lager hematoma |
2 |
random |
2.76 (0.91–8.37) |
0.07 |
0.002, 90% |
Low cut-off value |
2 |
fixed |
0.97 (0.95–1.00) |
0.09 |
0.56, 0.0% |
Moderate cut-off value |
1 |
- |
5.05 (2.65–8.62) |
< 0.001 |
- |
High cut-off value |
2 |
fixed |
1.56 (1.15–2.13) |
0.005 |
0.22, 33% |
N: number of included studies, OR: odds ratio, CI: confidence interval, smaller hematoma: hematoma volume < 14 ml, lager hematoma: hematoma volume > 14 ml. Low cut-off value: 4–5, Moderate cut-off value: 6.5–7.5, High cut-off value: 7.5–8.5.
Table 3: Subgroup analyses results of 90-days poor outcomes
Groups |
N |
Model |
Pooled OR (95% CI) |
p value |
Heterogeneity (P, I2) |
|---|---|---|---|---|---|
Total |
4 |
random |
1.17 (0.93–1.47) |
0.18 |
0.002, 80% |
China |
2 |
random |
1.70 (0.63–4.58) |
0.30 |
0.09, 66% |
Europe |
2 |
random |
1.05 (0.90–1.24) |
0.52 |
0.02, 80% |
Admission NLR |
3 |
random |
1.19 (0.93–1.52) |
0.17 |
< 0.001, 87% |
Non-admission NLR |
1 |
- |
0.93 (0.34–2.57) |
0.89 |
- |
Smaller hematoma |
2 |
fixed |
1.16(1.01–1.32) |
0.04 |
0.67, 0.0% |
Lager hematoma |
2 |
random |
1.53(0.59,3.94) |
0.38 |
0.001, 90% |
Low cut-off value |
2 |
random |
1.05 (0.91–1.21) |
0.51 |
0.08, 61% |
Moderate cut-off value |
1 |
- |
2.60 (1.44–4.70) |
0.002 |
- |
High cut-off value |
2 |
fixed |
2.20 (1.54–3.14) |
< 0.001 |
0.72, 0% |
N: number of included studies, OR: odds ratio, CI, confidence interval, smaller hematoma: hematoma volume < 14 ml; lager hematoma: hematoma volume > 14 ml. Low cut-off value: 4–5, Moderate cut-off value: 6–7.5, High cut-off value: 7.5–8.5.
Subgroup analysis of 90-day mortality
Subgroup analysis based on country revealed that the NLR had significant effect on mortality in China with an OR of 3.34 (95% CI, 1.09–10.27, p = 0.035) and in Europe with OR of 1.63 (95% CI, 1.19–2.23, p = 0.003). Analysis based on the timing of performing the laboratory tests (admission or non-admission), the pooled OR for mortality were 2.76 (95% CI, 0.91–8.37, p = 0.07) and 1.51 (95% CI, 0.34–6.61, p=0.58) respectively. The pooled OR for mortality was 2.76 (95% CI, 0.91–8.37, p = 0.07) in larger hematoma and 1.51 (95% CI, 0.34–6.61, p = 0.58) in smaller hematoma. Two articles reporting the cut-off values from 4 to 5, the OR for mortality was 0.97 (95% CI, 0.95–1.00, p = 0.09). One articles reporting the cut-off values from 6 to 7.5, the OR for mortality was 5.05 (95% CI, 2.65–8.62, p < 0.001). The cut-off values from 7.5 to 8.5 assessed in two articles, the OR for mortality was 1.56 (95% CI, 1.15–2.13, p = 0.005).
Subgroup analysis of poor outcomes
The duration of follow up was 90-days in all the articles reporting poor outcomes. The pooled OR for poor outcomes in China was 1.17 (95% CI, 0.93–1.47, p = 0.18) and the pooled OR was 1.05 (95% CI, 0.90–1.24, p = 0.52) in Europe. In patients with laboratory test performed at the time of admission, the pooled OR for poor outcome was 1.19 (95% CI, 0.93–1.52, p = 0.17), and the pooled OR was 0.93 (95% CI, 0.34–2.57, p = 0.89) in the patients having test within 24h. The pooled OR for poor outcome in smaller hematoma was 1.16 (95% CI, 1.01–1.32, p = 0.04), while the pooled OR for poor outcome in larger hematoma was 1.53 (95% CI, 0.59–3.94, p = 0.38). Two articles reporting the cut-off values from 4 to 5, the OR for poor outcome was 1.05 (95% CI, 0.91–1.21, p = 0.51). One article reporting the cut-off values from 6 to 7.5, the OR for poor outcome was 2.60 (95% CI, 1.44–4.70, p = 0.002). The cut-off values from 7.5 to 8.5 assessed in two articles, the OR for poor outcome was 2.20 (95% CI, 1.54–3.14, p < 0.001).
publication bias
The publication bias was assessed by STATA 13.0 and no publication bias was found for 90-day poor outcomes (P = 0.734) in this meta-analysis (Figure 6).
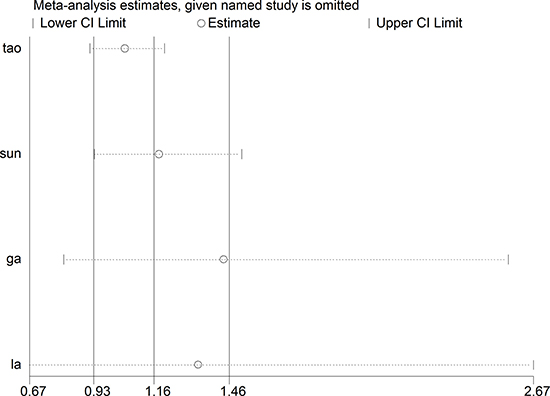
Figure 6: The sensitivity analysis of the studies reported 90-day poor outcomes and the outcomes had no significant change after excluding a single study.
DISCUSSION
Implications
Inflammation is considered a major player in the development of secondary brain injury after stroke. Tao et al. [13] demonstrated that a higher white blood cell, neutrophil count and NLR were independent predictors for 90-day poor outcomes after sICH, the predictive ability of NLR in sICH remains controversial. To the best of our knowledge, this is the first study performing a meta-analysis to systematically evaluate the association of NLR and clinical outcomes of sICH. In the present study, we found that higher NLR was associated with higher rates of in-hospital mortality and 90-day mortality in sICH. In patients with a small hematoma or a high cut-off value, the high NLR had a statistically significant association with poor outcomes (mRS ≥ 3) in sICH.
NLR is considered a comprehensive index that reflects the degree of inflammation infiltration (neutrophil) [30–32], and immune status (lymphocytes) [32]. The activation of inflammatory cells, cytokines results in BBB disruption, tissue damage, and massive neuronal cell death [7, 21]. Peripheral blood is also used as a biomarker for systemic inflammatory response. This was found to be associated with the clinical and radiological severity of sICH [33]. In addition, lymphocytes induce cellular and humoral immune responses, which play an important role in host defense against pathogens. Reduced lymphocyte counts in lymphoid organs and peripheral blood renders patients more prone to infections [32, 27], which plays an important role in the prognosis after sICH [34]. We found the NLR was associated with the mortality of sICH, which was attributed to the increase of peri-hematoma or systemic inflammatory response and ICH-induced immunosuppression.
The cut-off values for various diseases were different, for instance, the value was from 4.1 to 5.9 in the ischemic stroke [15, 16] and from 3.5 to 7.6 in cardiovascular diseases [14]. In patients with sICH, the main cut-off value ranged from 4.08 to 7.35 in the available articles. Three of the included articles suggested the values were about 4.5, while Wang [22] and Tao [13] reported cut-off values of more than 6. The cut-off values could be affected by many causes, such as different biochemical analyzers, time of blood sample, capacity of immune system, and hematoma volume. We found that higher cut-off values had a better predictive ability of NLR for the prognosis. Sun [23] reported that high NLR was not associated with poor outcome or mortality with a cut-off value of 4.08. Giede-Jeppe [24] showed the high NLR was an independent predictor for poor outcomes and 90-day mortality with a high cut-off value of 8.508. In addition, Tao [13] demonstrated the NLR had a high specificity of 0.767 for 90-day mortality with a relative high cut-off value. Wang [22] also suggested aNLR with cut-off of 7.35 had a significant association with the in-hospital mortality.
Hematoma volume is known as an independent predictor for clinical outcomes in sICH [8]. Some studies [35, 36] showed that higher peripheral WBC was found in patients with larger hematoma volumes and Sun [23] demonstrated that patients with a higher NLR at the time of admission had larger hematoma volumes. The mechanism is most likely be related to a stress-induced response [35] or an inflammatory response in modulating the coagulation cascade after sICH [36]. With larger hematomas, the cut-off values might be affected by the increasing of NLR. In this meta-analysis, we found that cut-off values increased with the increasing of hematoma volume (Table 1). Tao [13] and Wang [22] included patients with a larger mean hematoma volume, and demonstrated higher cut-off values NLR when compared to the other articles. Thus, a lower cut of value < 4.5 have been suggested for smaller hematomas, while higher cut-off values are suggested for larger hematomas. NLR with cut-off values of 7.5 could predict the mortality and poor outcomes, regardless of other factors, such as hematoma volumes and admission NLR. However, the cut-off values should be set according to mean hematoma volume data established in different medical institutions.
The NLR of sICH is time dependent and values increase with time during the first few days [24, 37]. Animal experiments revealed that neutrophil infiltration, which enhances the peri-hematoma edema develops within 24 hours from the onset of ICH, and reaches a maximum 3 days from onset [30–32]. The reduction of lymphocytes in lymphoid organs and peripheral blood occurs within 12 h [37]. In a clinical trial, Giede-Jeppe [24] found that NLR 1 day after admission was significantly higher than NLR at the time of admission, and that NLR reached peak levels after 2 days. They found a statistically significant association between NLR at the time of admission and outcome; however, they did not discuss the predictive ability of NLR at 2 or 3 days. Wang [22] compared the predictive ability of NLR at admission with the NLR on the next day. They found that next day NLR was associated with a significant predictive potential for in hospital mortality, rather than the NLR at admission. Based on the analysis conducted in this report, no difference in predictive potential was detected between admission and non-admission NLR. Further investigations are required to determine the role of time of acquiring NLR on outcomes.
The clinical outcomes were affected by various factors other than NLR, such as blood pressure [38, 39], blood glucose level [40], temperature [41], anticoagulant drugs [42] and some other factors [43–45] related to metabolic homeostasis, inflammatory responses, and perfusion disturbances. Thus, a multidimensional evaluation is essential for the appropriate management of sICH. Future treatments should develop based on the proper understanding of stroke pathophysiology and course. These factors could be targeted for the treatment of sICH, and the better understanding of the interplay of these factors can help produce more efficient prognostic algorithms.
However, significant heterogeneity exists among the five studies. The main reasons were the hematoma volume, time of laboratory test and cut-off values. The mean hematoma volume ranged from 8.1 to 15.8ml in the included articles. After excluding the two articles with larger hematomas, we found the heterogeneity to be 0.0% in smaller hematomas (Table 3). Two articles [22, 23] with non-admission NLR also had no heterogeneity for predicting the mortality (Table 2). The heterogeneity was not significant in the articles with high cut-off values (Table 2 and Table 3). In addition, Wang [22] demonstrated the negative effect of NLR on short-term mortality, and the incidence of death was lower than the other articles with a longer period of follow-up.
Limitations
There were some limitation in this meta-analysis. First, the prognostic role of NLR in the ICH was discussed with the limited number of articles and subjects. Second, the heterogeneity between articles was significant, and the random-effects model was adopted. Third, the main cut-off values were different in the included articles. We did the subgroup analyses to find the origin of heterogeneity to estimate the results more accurately.
Future study
More high-quality research with larger sample size is needed to identify the association between NLR and clinical outcomes in sICH, considering the time point of blood sampling, time from onset, and long-term or short-term follow up. Moreover, future studies should consider some other factors which are associated with the outcomes of sICH patients, such as hematoma volumes, blood pressure, blood glucose level, temperature, and history of anticoagulant drugs. With intervention to local or systemic inflammatory response, the change of NLR and the predictive ability of NLR for outcomes in sICH needed more study.
CONCLUSIONS
The results of this meta-analysis demonstrated that the high NLR was a predictor of the 90-day mortality and in-hospital mortality in patients with sICH, but not a predictor of poor outcomes. The NLR with cut-off values of 4.5 could predict the poor outcomes in patients with smaller volume hematomas, while the NLR with cut-off values of 7.5 had a significant predictive ability for mortality and poor outcomes, regardless of country, time of laboratory test and hematoma volume.
ACKNOWLEDGMENTS
The authors thank the reviewers for their constructive comments.
CONFLICTS OF INTEREST
No conflicts of interest.
FUNDING
This work is supported by Science and technology supportive project of Sichuan Province. Project: Intracerebral hemorrhage prevention and diagnostic treatment skills (No. 2015SZ0051); Outstanding subject development 135 project: An international, multicenter, large sample randomized controlled trial of supratentorial deep intracerebral haematoma surgery and conservative treatment in adults (No. ZY2016102); and the projects of National Natural Science Foundation of China (contract/grant number: 81100925, 81472361).
REFERENCES
1. Hemphill JC 3rd, Greenberg SM, Anderson CS, Becker K, Bendok BR, Cushman M, Fung GL, Goldstein JN, Macdonald RL, Mitchell PH, Scott PA, Selim MH, Woo D, et al. Guidelines for the Management of Spontaneous Intracerebral Hemorrhage: A Guideline for Healthcare Professionals From the American Heart Association/American Stroke Association. Stroke. 2015; 46:2032–60. https://doi.org/10.1161/STR.0000000000000069.
2. van Asch CJ, Luitse MJ, Rinkel GJ, van der Tweel I, Algra A, Klijn CJ. Incidence, case fatality, and functional outcome of intracerebral hemorrhage over time, according to age, sex, and ethnic origin: a systematic review and meta-analysis. Lancet Neurol. 2010; 9:167–76. https://doi.org/10.1016/S1474-4422(09)70340-0.
3. Mayer SA, Rincon F. Treatment of intracerebral hemorrhage. Lancet Neurol. 2005; 4:662–72. https://doi.org/10.1016/S1474-4422(05)70195-2.
4. Aronowski J, Zhao X. Molecular pathophysiology of cerebral hemorrhage: secondary brain injury. Stroke. 2011; 42:1781–6. https://doi.org/10.1161/STROKEAHA.110.596718.
5. Wang J. Preclinical and clinical research on inflammation after intracerebral hemorrhage. Prog Neurobiol. 2010; 92:463–77. https://doi.org/10.1016/j.pneurobio.2010.08.001.
6. Xi G, Keep RF, Hoff JT. Mechanisms of brain injury after intracerebral hemorrhage. Lancet Neurol. 2006; 5:53–63. https://doi.org/10.1016/S1474-4422(05)70283-0.
7. Wang J, Dore S. Inflammation after intracerebral hemorrhage. J Cereb Blood Flow Metab. 2007; 27:894–908. https://doi.org/10.1038/sj.jcbfm.9600403.
8. Leira R, Davalos A, Silva Y, Gil-Peralta A, Tejada J, Garcia M, Castillo J, Stroke Project CDGotSNS. Early neurologic deterioration in intracerebral hemorrhage: predictors and associated factors. Neurology. 2004; 63:461–7.
9. Walsh KB, Sekar P, Langefeld CD, Moomaw CJ, Elkind MS, Boehme AK, James ML, Osborne J, Sheth KN, Woo D, Adeoye O. Monocyte Count and 30-Day Case Fatality in Intracerebral Hemorrhage. Stroke. 2015; 46:2302–4. https://doi.org/10.1161/STROKEAHA.115.009880.
10. Bestue-Cardiel M, Martin-Martinez J, Iturriaga-Heras C, Ara-Callizo JR, Oliveros-Juste A. Leukocytes and primary intracerebral hemorrhage. [Article in Spanish]. Rev Neurol. 1999; 29:968–71.
11. Yin Y, Wang J, Wang X, Gu L, Pei H, Kuai S, Zhang Y, Shang Z. Prognostic value of the neutrophil to lymphocyte ratio in lung cancer: A meta-analysis. Clinics (Sao Paulo). 2015; 70:524–30. https://doi.org/10.6061/clinics/2015(07)10.
12. Li MX, Liu XM, Zhang XF, Zhang JF, Wang WL, Zhu Y, Dong J, Cheng JW, Liu ZW, Ma L, Lv Y. Prognostic role of neutrophil-to-lymphocyte ratio in colorectal cancer: a systematic review and meta-analysis. Int J Cancer. 2014; 134:2403–13. https://doi.org/10.1002/ijc.28536.
13. Tao C, Hu X, Wang J, Ma J, Li H, You C. Admission neutrophil count and neutrophil to lymphocyte ratio predict 90-day outcome in intracerebral hemorrhage. Biomark Med. 2017; 11:33–42. https://doi.org/10.2217/bmm-2016-0187.
14. Bhat T, Teli S, Rijal J, Bhat H, Raza M, Khoueiry G, Meghani M, Akhtar M, Costantino T. Neutrophil to lymphocyte ratio and cardiovascular diseases: a review. Expert Rev Cardiovasc Ther. 2013; 11:55–9. https://doi.org/10.1586/erc.12.159.
15. Tokgoz S, Keskin S, Kayrak M, Seyithanoglu A, Ogmegul A. Is neutrophil/lymphocyte ratio predict to short-term mortality in acute cerebral infarct independently from infarct volume? J Stroke Cerebrovasc Dis. 2014; 23:2163–8. https://doi.org/10.1016/j.jstrokecerebrovasdis.2014.04.007.
16. Brooks SD, Spears C, Cummings C, VanGilder RL, Stinehart KR, Gutmann L, Domico J, Culp S, Carpenter J, Rai A, Barr TL. Admission neutrophil-lymphocyte ratio predicts 90 day outcome after endovascular stroke therapy. J Neurointerv Surg. 2014; 6:578–83. https://doi.org/10.1136/neurintsurg-2013-010780.
17. Idzko M, Ferrari D, Eltzschig HK. Nucleotide signalling during inflammation. Nature. 2014; 509:310–7. https://doi.org/10.1038/nature13085.
18. Moses K, Brandau S. Human neutrophils: Their role in cancer and relation to myeloid-derived suppressor cells. Semin Immunol. 2016; 28:187–96. https://doi.org/10.1016/j.smim.2016.03.018.
19. Tamhane UU, Aneja S, Montgomery D, Rogers EK, Eagle KA, Gurm HS. Association between admission neutrophil to lymphocyte ratio and outcomes in patients with acute coronary syndrome. Am J Cardiol. 2008; 102:653–7. https://doi.org/10.1016/j.amjcard.2008.05.006.
20. Xue J, Huang W, Chen X, Li Q, Cai Z, Yu T, Shao B. Neutrophil-to-Lymphocyte Ratio Is a Prognostic Marker in Acute Ischemic Stroke. J Stroke Cerebrovasc Dis. 2017; 26:650–7. https://doi.org/10.1016/j.jstrokecerebrovasdis.2016.11.010.
21. Zhou Y, Wang Y, Wang J, Anne Stetler R, Yang QW. Inflammation in intracerebral hemorrhage: from mechanisms to clinical translation. Prog Neurobiol. 2014; 115:25–44. https://doi.org/10.1016/j.pneurobio.2013.11.003.
22. Wang F, Hu S, Ding Y, Ju X, Wang L, Lu Q, Wu X. Neutrophil-to-Lymphocyte Ratio and 30-Day Mortality in Patients with Acute Intracerebral Hemorrhage. J Stroke Cerebrovasc Dis. 2016; 25:182–7. https://doi.org/10.1016/j.jstrokecerebrovasdis.2015.09.013.
23. Sun Y, You S, Zhong C, Huang Z, Hu L, Zhang X, Shi J, Cao Y, Liu CF. Neutrophil to lymphocyte ratio and the hematoma volume and stroke severity in acute intracerebral hemorrhage patients. Am J Emerg Med. 2017; 35:429–33. https://doi.org/10.1016/j.ajem.2016.11.037.
24. Giede-Jeppe A, Bobinger T, Gerner ST, Sembill JA, Sprugel MI, Beuscher VD, Lucking H, Hoelter P, Kuramatsu JB, Huttner HB. Neutrophil-to-Lymphocyte Ratio Is an Independent Predictor for In-Hospital Mortality in Spontaneous Intracerebral Hemorrhage. Cerebrovasc Dis. 2017; 44:26–34. https://doi.org/10.1159/000468996.
25. Lattanzi S, Cagnetti C, Provinciali L, Silvestrini M. Neutrophil-to-Lymphocyte Ratio Predicts the Outcome of Acute Intracerebral Hemorrhage. Stroke. 2016; 47:1654–7. https://doi.org/10.1161/strokeaha.116.013627.
26. Lattanzi S, Cagnetti C, Provinciali L, Silvestrini M. Neutrophil-to-lymphocyte ratio and neurological deterioration following acute cerebral hemorrhage. Oncotarget. 2017; 8:57489–57494. https://doi.org/10.18632/oncotarget.15423.
27. Stang A. Critical evaluation of the Newcastle-Ottawa scale for the assessment of the quality of nonrandomized studies in meta-analyses. European Journal of Epidemiology. 2010; 25:603–5. https://doi.org/10.1007/s10654-010-9491-z.
28. Patsopoulos NA, Evangelou E, Ioannidis JP. Sensitivity of between-study heterogeneity in meta-analysis: proposed metrics and empirical evaluation. Int J Epidemiol. 2008; 37:1148–57. https://doi.org/10.1093/ije/dyn065.
29. Stovold E, Beecher D, Foxlee R, Noel-Storr A. Study flow diagrams in Cochrane systematic review updates: an adapted PRISMA flow diagram. Syst Rev. 2014; 3:54. https://doi.org/10.1186/2046-4053-3-54.
30. Gong C, Hoff JT, Keep RF. Acute inflammatory reaction following experimental intracerebral hemorrhage in rat. Brain Res. 2000; 871:57–65.
31. Xue MZ, Del Bigio MR. Intracortical hemorrhage injury in rats - Relationship between blood fractions and brain cell death. Stroke. 2000; 31:1721–7.
32. Xue M, Del Bigio MR. Comparison of brain cell death and inflammatory reaction in three models of intracerebral hemorrhage in adult rats. J Stroke Cerebrovasc Dis. 2003; 12:152–9. https://doi.org/10.1016/S1052-3057(03)00036-3.
33. Kalita J, Bastia J, Bhoi SK, Misra UK. Systemic Inflammatory Response Syndrome Predicts Severity of Stroke and Outcome. J Stroke Cerebrovasc Dis. 2015; 24:1640–8. https://doi.org/10.1016/j.jstrokecerebrovasdis.2015.03.057.
34. Dirnagl U, Klehmet J, Braun JS, Harms H, Meisel C, Ziemssen T, Prass K, Meisel A. Stroke-induced immunodepression: experimental evidence and clinical relevance. Stroke. 2007; 38:770–3. https://doi.org/10.1161/01.STR.0000251441.89665.bc.
35. Morotti A, Phuah CL, Anderson CD, Jessel MJ, Schwab K, Ayres AM, Pezzini A, Padovani A, Gurol ME, Viswanathan A, Greenberg SM, Goldstein JN, Rosand J. Leukocyte Count and Intracerebral Hemorrhage Expansion. Stroke. 2016; 47:1473–8. https://doi.org/10.1161/STROKEAHA.116.013176.
36. Suzuki S, Kelley RE, Dandapani BK, Reyes-Iglesias Y, Dietrich WD, Duncan RC. Acute leukocyte and temperature response in hypertensive intracerebral hemorrhage. Stroke. 1995; 26:1020–3.
37. Meisel C, Schwab JM, Prass K, Meisel A, Dirnagl U. Central nervous system injury-induced immune deficiency syndrome. Nat Rev Neurosci. 2005; 6:775–86. https://doi.org/10.1038/nrn1765.
38. Lattanzi S, Cagnetti C, Provinciali L, Silvestrini M. Blood Pressure Variability and Clinical Outcome in Patients with Acute Intracerebral Hemorrhage. J Stroke Cerebrovasc Dis. 2015; 24:1493–9. https://doi.org/10.1016/j.jstrokecerebrovasdis.2015.03.014.
39. Lattanzi S, Silvestrini M. Optimal achieved blood pressure in acute intracerebral hemorrhage: INTERACT2. Neurology. 2015; 85:557–8. https://doi.org/10.1212/01.wnl.0000470918.40985.d0.
40. Fogelholm R, Murros K, Rissanen A, Avikainen S. Admission blood glucose and short term survival in primary intracerebral hemorrhage: a population based study. J Neurol Neurosurg Psychiatry. 2005; 76:349–53. https://doi.org/10.1136/jnnp.2003.034819.
41. Takagi K. Body temperature in acute stroke. Stroke. 2002; 33:2154–5; author reply -5.
42. Radberg JA, Olsson JE, Radberg CT. Prognostic parameters in spontaneous intracerebral hematomas with special reference to anticoagulant treatment. Stroke. 1991; 22:571–6.
43. Lattanzi S, Bartolini M, Provinciali L, Silvestrini M. Glycosylated Hemoglobin and Functional Outcome after Acute Ischemic Stroke. J Stroke Cerebrovasc Dis. 2016; 25:1786–91. https://doi.org/10.1016/j.jstrokecerebrovasdis.2016.03.018.
44. Lattanzi S, Silvestrini M, Provinciali L. Elevated blood pressure in the acute phase of stroke and the role of Angiotensin receptor blockers. Int J Hypertens. 2013; 2013:941783. https://doi.org/10.1155/2013/941783.
45. Zangari R, Zanier ER, Torgano G, Bersano A, Beretta S, Beghi E, Casolla B, Checcarelli N, Lanfranconi S, Maino A, Mandelli C, Micieli G, Orzi F, et al. Early ficolin-1 is a sensitive prognostic marker for functional outcome in ischemic stroke. J Neuroinflammation. 2016; 13:16. https://doi.org/10.1186/s12974-016-0481-2.