
INTRODUCTION
Despite considerable improvement in prevention and management, cardiovascular diseases remain the leading cause of death worldwide. Decomposition of global and regional life expectancy showed the prominent role of reductions in age-standardized death rates for cardiovascular diseases worldwide [1]. According to World Health Organization (WHO), about 17.3 million people died of cardiovascular diseases annually, accounting for > 30% of all-cause mortality [2]. Cardiovascular mortality is the top cause for mortality worldwide, with 3.7 million people aged below 60 years [3]. Factors that trigger cardiovascular events, particularly in susceptible population, represent a major public health concern.
Air pollution is a leading environmental health issue [4]. Higher levels of gaseous components [including nitrogen dioxide (NO2), sulfur dioxide (SO2), and ozone (O3)] and particulate matter with diameter less than 10μm (PM10) and 2.5 μm (PM2.5) have been associated with poorer cardiovascular health [5, 6]. Short-term exposure to air pollutants led to increased cardiovascular events [7–10]. According to 2002 World Health Report, approximately 800,000 premature deaths were attributable to air pollution worldwide annually [11]. Moreover, short-term exposures to air pollution have been associated with increased cardiovascular mortality and hospital admissions [7, 12]. China is the major developing country. Air pollutant levels in many cities remain significantly higher than the upper limits stated in the WHO guidelines [13]. Daily concentrations of PM2.5 in mega-cities, such as Beijing and Shanghai, may peak to 100–300 μg/m3 [14, 15], which far exceeded the upper limit (10 μg/m3) endorsed by WHO Air Quality Guideline (AQG) [13].
However, most evidence of the association between short-term effect of air pollution and cardiovascular mortality were derived from North American or West European countries where pollutant levels were much lower [16–18]. Studies conducted in China are very scarce. Importantly, previous findings might not be directly extrapolated to China [19], because adverse effects of air pollution vary with regions and time [20]. Therefore, we conducted a systematic review and meta-analysis summarizing the association between short-term exposure of air pollution and cardiovascular mortality in China.
RESULTS
Study selection and identified papers
299 records were identified after excluding duplicates. With in-depth review, 30 full-text articles fulfilled the inclusion criteria and were included in the meta-analysis. Details of selection process are presented in Figure 1. The median concentrations of each pollutant was 54 μg/m2, 85.3 μg/m2, 46 μg/m2, 57 μg/m2 and 57.88 μg/m2 for PM2.5, PM10, SO2, NO2 and O3, respectively.
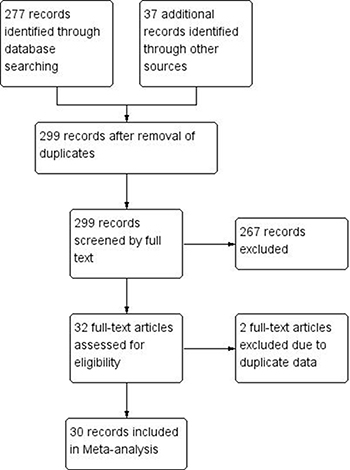
Figure 1: Flow chart of literature search and criterion for inclusion and exclusion of studies.
Across the span of 1998 to 2015, two studies adopted case-crossover design and the remaining were time-series studies. Cardiovascular mortality effects were assessed in association with acute exposure to five major air pollutants, including PM10, PM2.5, SO2, NO2 and O3. Of these, 17 articles focused on PM10, 10 studies were pertinent to PM2.5, 12 studies included NO2, 9 studies was related to SO2 and 6 studies referred to O3. Eleven cities were included in our study, which were mainly comprised of provincial capitals in China. Table 1 summarizes the details of studies included in our study. See Supplementary Table 1 and Supplementary Figures 1–11.
Table 1: Contextual details of studies included in the meta-analysis
Study |
Year |
City |
Study period |
Study design |
Air pollutant |
Lags exposure |
Model |
|---|---|---|---|---|---|---|---|
Xu et al. |
2017 |
Beijing, China |
2013 |
Time-series |
PM2.5, NO2, SO2, O3, CO |
0, 1, 2, 3, 4, 0–1, 0–3, 0–5 |
GAM |
Qin et al. |
2016 |
Zhengzhou, China |
2013–2015 |
Time-series |
O3 |
0–1 |
GAM |
Lin et al. |
2016 |
China |
2013–2015 |
Time-series |
PM2.5, SO2, NO2, O3 |
0–3 |
GAM |
Xie et al. |
2015 |
Beijing, China |
2010–2012 |
Time-series |
PM2.5 |
0, 1, 2, 3, 4, 0–2, 0–4 |
GAM |
Li et al. |
2015 |
Beijing, China |
2005–2009 |
Time-series |
PM2.5 |
1,2 |
GAM |
Zhang et al. |
2014 |
Guangzhou, China |
2008–2011 |
Time-series |
PM10, SO2, NO2 |
0–5 |
GAM |
Tong et al. |
2014 |
Tianjin, China |
2008–2011 |
Time-series |
PM10, SO2, NO2 |
0, 0–1 |
GLM |
Yu et al. |
2013 |
Hong Kong, China |
1998–2007 |
Time-series |
PM10, NO2 |
0–3 |
GAM |
Wang et al. |
2013 |
Tianjin, China |
2006–2010 |
Time-series |
PM10, SO2, NO2 |
0, 1, 2, 0–3 |
GAM |
Huang et al. |
2013 |
Hong Kong, China |
1998–2007 |
Time-series |
PM10, NO2, O3, SO2 |
0, 1, 0–3 |
GAM |
Geng et al. |
2013 |
Shanghai, China. |
2007–2008 |
Time-series |
PM2.5 |
3 |
NG |
Yu et al. |
2012 |
Guangzhou, China |
2006–2009 |
Time-series |
PM10, SO2, NO2 |
0–1 |
GAM |
Yang et al. |
2012 |
Suzhou, China |
2006–2008 |
Time-series |
O3 |
0–1 |
GAM |
Yang et al. |
2012 |
Guangzhou, China |
2007–2008 |
Case-crossover |
PM2.5 |
0–1 |
Logistic |
Tao et al. |
2012 |
China |
2006–2008 |
Time-series |
PM10, NO2, O3 |
0–2 |
GLM |
Xia et al. |
2012 |
China |
2001–2008 |
Time-series |
PM10 |
0–1 |
GAM |
Huang et al. |
2012 |
Xi’an, China |
2004–2008 |
Time-series |
PM2.5 |
0–2 |
GAM |
Chen et al. |
2012 |
China |
2001–2008 |
Time-series |
NO2 |
0–1 |
GLM |
Chen et al. |
2012 |
China |
2006–2009 |
Time-series |
PM10 |
0–1 |
GAM |
Ma et al. |
2011 |
Shenyang, China |
2006–2008 |
Case-crossover |
PM2.5 |
0–1 |
GAM |
Chen et al. |
2011 |
China |
2006–2008 |
Time-series |
PM2.5, PM10 |
0, 1, 2, 0–1, 0–2 |
GLM |
Qian et al. |
2010 |
Xian, China |
2004–2008 |
Time-series |
PM2.5 |
0–1 |
GAM |
Chen et al. |
2010 |
Anshan, China |
2005–2007 |
Time-series |
PM10, SO2, NO2 |
0, 6, 0–1, 0–6 |
GAM |
Chen et al. |
2010 |
Shanghai, China. |
2005–2007 |
Time-series |
PM10, SO2, NO2 |
0, 6, 0–1, 0–6 |
GLM |
Huang et al. |
2009 |
Shanghai, China. |
2004–2005 |
Time-series |
PM2.5 |
0 |
GAM |
Cao et al. |
2009 |
Shanghai, China. |
2005–2007 |
Time-series |
PM10, SO2 |
0, 6, 0–1, 0–6 |
GLM |
Wong et al. |
2008 |
China |
2001–2004 |
Time-series |
PM10, SO2, NO2, O3 |
0–1 |
GLM |
Chen et al. |
2008 |
Shanghai, China. |
2001–2004 |
Time-series |
PM10, SO2, NO2 |
0–1 |
GAM |
Qian et al. |
2007 |
Wuhan, China |
2001–2004 |
Time-series |
PM10, O3 |
0, 4, 0–1, 0–4 |
GAM |
Kan et al. |
2007 |
Shanghai, China |
2004–2005 |
Time-series |
PM2.5, PM10 |
0–1 |
GAM |
GAM, Generalized additive model. GLM, Generalized linear model. Logistic, Logistic regression model.
Particulate matter and cardiovascular mortality
Overall, we noted significant positive associations between cardiovascular mortality and particulate matters (PM10, PM2.5). PM10, which was the most frequently reported air pollutant, showed a mean of 0.39% (95% CI: 0.26%–0.53%) increase in cardiovascular mortality risk per 10 μg/m3 increase in concentration, with a significant heterogeneity among studies (83.6%) (Figure 2). Pooled analysis suggested that the adverse impact of PM10 on cardiovascular mortality was independent of the duration of exposure (Figure 3).
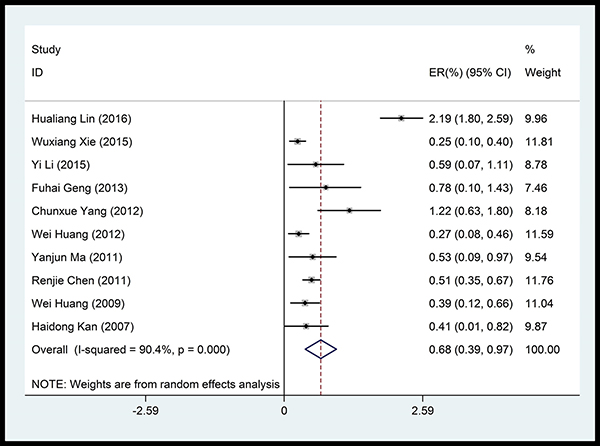
Figure 2: Forest plot of the association between PM2.5 and cardiovascular mortality.
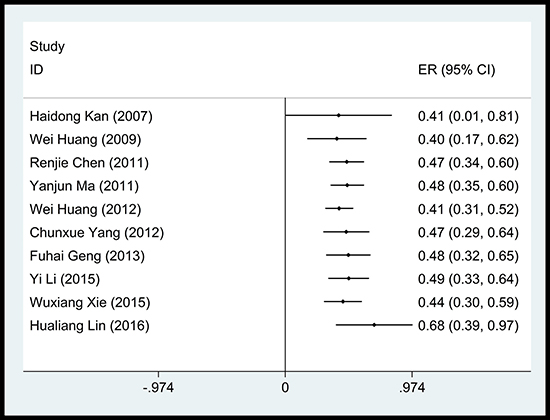
Figure 3: Accumulative meta-analysis of the association between PM2.5 and cardiovascular mortality.
PM2.5 was also significantly associated with a mean of 0.68% (95% CI: 0.39%–0.97%) increase in cardiovascular mortality per 10 μg/m3 increase in concentration, despite significant heterogeneity among studies (90.4%, Figure 4). No time-dependent effect was observed in the adverse impact of PM2.5 on cardiovascular mortality (Figure 5).
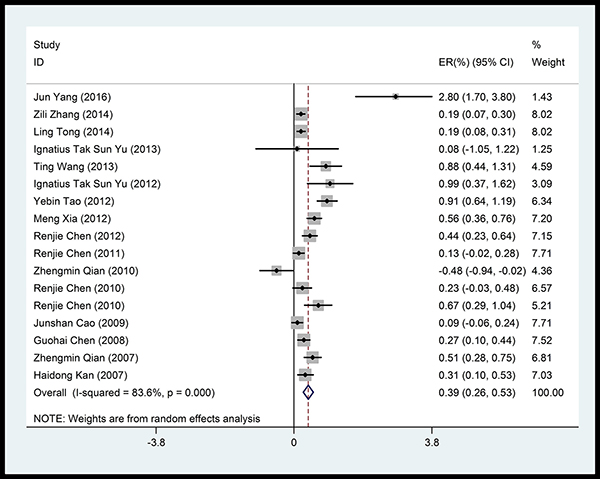
Figure 4: Forest plot of the association between PM10 and cardiovascular mortality.
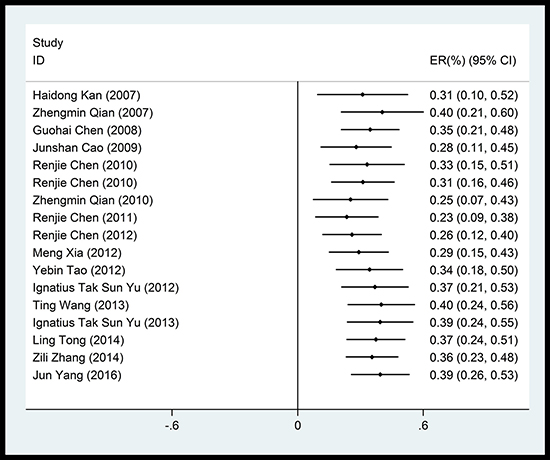
Figure 5: Accumulative meta-analysis of the association between PM10 and cardiovascular mortality.
Gaseous air pollutants and cardiovascular mortality
Shot-term exposure to gaseous pollutants yielded robust association with cardiovascular mortality. (Table 2) For each 10 μg/m3 increase in O3 and SO2 concentration, pooled ERs of cardiovascular mortality was 0.62% (95% CI: 0.33%–0.92%) and 0.75% (95% CI: 0.42%–1.09%), respectively. Notably, NO2 conferred a 1.12% (95% CI: 0.76%–1.48%) increase in cardiovascular mortality per 10 μg/m3 increase in concentration. The heterogeneity was significant among studies reporting these gaseous pollutants (NO2, 66.9%; SO2, 74.2%; O3, 61.5%). For forest plots see details in Online Supplement.
Table 2: Pooled outcomes of the cardiovascular health effect of gaseous pollutants
NO2 |
SO2 |
O3 |
|
|---|---|---|---|
Number of estimates |
12 |
9 |
6 |
Model |
Random-effect |
Random-effect |
Random-effect |
Heterogeneity I2 (%) |
66.9 |
74.2 |
61.5 |
Summary ER (%) (95% CI) |
1.12 [0.76, 1.48] |
0.75 [0.42, 1.09] |
0.62 [0.33, 0.92] |
ER, Excess risk (ER) percentages and 95% confidence intervals for different causes of mortality. CI, confidence interval. PM, Particulate matter.
Subgroup analysis
Subgroup analyses were conducted by stratifying the age, gender, the different lag patterns, temperature, and concentrations of air pollutants (Table 3). People aged greater than 65 years were more susceptible to the adverse impacts conferred by air pollution. Males appeared to be less susceptible to the adverse effects associated with air pollution. The more robust associations were seen at lag 1 day for all pollutants except for PM2.5. Among all pollutants, greater cardiovascular mortality was observed in lower temperature. In most of the sub-group analysis, the heterogeneity remained significant, except for the warm seasons.
Table 3: Subgroup-analysis of each pollutant and cardiovascular mortality
Pollutant |
Outcome |
Number of estimates |
Heterogeneity I2(%) |
Statistics Model |
Summary ER (%) (95% CI) |
|---|---|---|---|---|---|
PM2.5 |
|||||
Lag 0 |
4 |
49 |
Random-effect |
0.40 [0.23, 0.58] |
|
Lag 1 |
3 |
90 |
Random-effect |
0.14 [−0.23, 0.52] |
|
Lag 2 |
2 |
77 |
Random-effect |
−0.01 [−0.22, 0.01] |
|
Lag 0–1 |
2 |
71 |
Fixed-effect |
0.77 [0.42, 1.12] |
|
Warm |
2 |
19 |
Fixed-effect |
0.67 [0.21, 1.14] |
|
Cool |
2 |
75 |
Random-effect |
0.68 [−0.35, 1.71] |
|
PM10 |
|||||
Lag 0 |
9 |
76 |
Random-effect |
0.27 [0.10, 0.44] |
|
Lag 1 |
6 |
80 |
Random-effect |
0.35 [0.12, 0.59] |
|
Lag 2 |
4 |
63 |
Random-effect |
0.03 [−0.21, 0.27] |
|
Lag 0–1 |
12 |
84 |
Random-effect |
0.47 [0.30, 0.64] |
|
Male |
3 |
73 |
Random-effect |
0.30 [0.06, 0.55] |
|
Female |
3 |
80 |
Random-effect |
0.56 [0.14, 0.97] |
|
Warm seasons |
4 |
73 |
Random-effect |
0.44 [−0.07, 0.96] |
|
Cool seasons |
4 |
80 |
Random-effect |
0.46 [0.18, 0.73] |
|
Age > 65 years |
5 |
78 |
Random-effect |
0.50 [0.23, 0.76] |
|
Age ≤ 65 years |
5 |
80 |
Random-effect |
0.33 [0.01, 0.65] |
|
NO2 |
|||||
Lag 0 |
3 |
75 |
Random-effect |
0.44 [−0.46, 1.34] |
|
Lag 1 |
2 |
77 |
Random-effect |
1.11 [0.12, 2.11] |
|
Lag 0–1 |
8 |
86 |
Random-effect |
1.33 [0.73, 1.93] |
|
Male |
3 |
86 |
Random-effect |
0.80 [0.08, 1.51] |
|
Female |
3 |
64 |
Random-effect |
1.08 [0.48, 1.69] |
|
Warm seasons |
3 |
0 |
Fixed-effect |
0.13 [−0.25, 0.50] |
|
Cool seasons |
3 |
90 |
Random-effect |
1.96 [0.33, 3.60] |
|
Age > 65 years |
4 |
86 |
Random-effect |
1.27 [0.55, 1.99] |
|
Age ≤ 65 years |
4 |
50 |
Fixed-effect |
0.40 [0.20, 0.61] |
|
SO2 |
|||||
Lag 0 |
3 |
87 |
Random-effect |
0.38 [−0.45, 1.20] |
|
Lag 1 |
4 |
87 |
Random-effect |
0.72 [0.05, 1.39] |
|
Lag 2 |
2 |
41 |
Fixed-effect |
0.12 [−0.13, 0.38] |
|
Lag 0–1 |
8 |
82 |
Random-effect |
0.61 [0.23, 1.00] |
|
Male |
2 |
59 |
Random-effect |
0.56 [0.08, 1.04] |
|
Female |
2 |
87 |
Random-effect |
0.99 [−0.10, 2.09] |
|
Warm seasons |
3 |
3 |
Fixed-effect |
0.21 [−0.01, 0.43] |
|
Cool seasons |
3 |
86 |
Random-effect |
1.28 [0.39, 2.18] |
|
O3 |
|||||
Lag 2 |
2 |
81 |
Random-effect |
0.40 [−0.04, 0.84] |
|
Lag 0–1 |
2 |
76 |
Random-effect |
1.51 [−1.32, 4.33] |
|
Warm seasons |
3 |
36 |
Fixed-effect |
0.43 [0.15, 0.71] |
|
Cool seasons |
4 |
91 |
Random-effect |
1.72 [−0.71, 4.15] |
ER, Excess risk (ER) percentages and 95% confidence intervals for different lag times of mortality, different age groups, different genders and different temperature for each increment of 10 μg/m3 in pollutant concentrations. CI, confidence interval. PM, Particulate matter
Publication bias
Funnel plots suggested symmetric distribution of studies (see Online Supplement). Begg’s and Egger’s test indicated insignificant publication bias for studies included in our analysis (Table 4).
Table 4: Assessment for publication bias stratified by gaseous and particulate air pollutants
PM2.5 |
PM10 |
NO2 |
SO2 |
O3 |
|
|---|---|---|---|---|---|
Number of estimates |
10 |
17 |
12 |
9 |
6 |
P value for Begg’s test |
0.049 |
0.058 |
0.631 |
0.251 |
0.060 |
P value for Egger’s test |
0.124 |
0.758 |
0.020 |
0.644 |
0.048 |
ER, Excess risk. CI, confidence interval. PM, Particulate matter.
DISCUSSION
Cardiovascular diseases include disorders of the heart (arrhythmia, coronary vessel and vascular disease, heart failure) and blood vessels (peripheral arterial diseases and venous thrombosis), particularly the diseases related to vessels supplying blood to the brain (ischemic and hemorrhagic stroke). Taken together, these disorders constitute the leading cause of death across the globe, with low- and middle-income countries being most significantly affected. A substantial number of environmental factors have been found to exert a critical adverse impact on the risk, progression, and severity of cardiovascular diseases. There are growing concerns of cardiovascular mortality related to air pollution, although it remains poorly characterized in China. In this meta-analysis, we have pooled 30 epidemiological studies which focused on the association between short-term exposure to pollution and cardiovascular mortality, demonstrating positive correlations between air pollutant levels and cardiovascular mortality. Specifically, we observed 0.39% and 0.68% higher ERs for total cardiovascular mortality, per 10 μg/m3 increases in PM10 and PM2.5, respectively. Meanwhile, each 10 μg/m3 increase in NO2, SO2 and O3 was associated with 1.12%, 0.75% and 0.62% greater ERs in cardiovascular mortality. Similar outcomes were reported in a previous meta-analysis from China, in which each 10 μg/m3 increase in PM10, PM2.5, SO2, NO2, and O3 concentrations corresponded to an increase in cardiovascular mortality by 0.43%, 0.44%, 0.85%, 1.46%, and 0.45%, respectively [21]. Another study has documented the increase of 0.36% and 0.63% per 10 μg/m3 increase in PM10 and PM2.5, which was also comparable to our findings [22].
Admittedly, pooled estimates of PM10 derived from developed countries were greater than that from China. Each 10 μg/m3 increase in PM10 was associated with 0.53% and 0.68% greater cardiovascular mortality in Europe [17] and USA [23], respectively. But our pooled estimates for PM2.5 of 0.68% appeared lower than those reported in developed countries. Per 10 μg/m3 increase in PM2.5, the pooled ERs were 0.85% for cardiovascular mortality in a multicity time-series analysis from 112 US cities [24]. In another time-series study from 27 US cities, each 10 μg/m3 increase in PM2.5 correlated with a pooled ER of 0.94% in cardiovascular mortality [18]. Because of significantly higher average of pollutants concentrations in Chinese cities, the exposure-response coefficient derived from western cities cannot be directly extrapolated to China.
We noted greater adverse effects of PM2.5 on cardiovascular mortality than those of PM10, which has been supported by earlier epidemiological studies [25, 26]. A potential interpretation is that PM10 deposited preferentially in larger airways, whereas PM2.5 or ultrafine particulate matter could penetrate to more distal airways or even the alveoli [27, 28]. It has been proven that PM2.5 enters cardiovascular system via inhalation into the lungs, which promotes local inflammatory response that “spills over” into the circulation, where soluble and cellular mediators may promote systemic oxidative stress and inflammation that affect the heart and vessels [29]. This systemic effect can also be amplified by effects on adipose and liver tissue, promoting the release of adipokines and acute-phase reactants, which can alter vascular tone, resulting in insulin resistance, dyslipidemia and hypercoagulability [30]. Therefore, greater emphasis should be placed on the adverse effects conferred by PM2.5.
Temperature is usually considered as a confounder of air pollution [31], and its impacts on cardiovascular mortality associated with air pollution remain controversial [32]. Consistent with previous studies [33, 34], we noted that low atmospheric temperature was associated with greater cardiovascular mortality, although confounding by other meteorological factors cannot be excluded. The altered cardiovascular biomarker profiles in healthy adults associated with ambient temperature changes may help explain the temperature-related cardiovascular mortality. A 10°C decrease at 2-d average daily temperature were associated with mean increases of 2.5%, 1.6%, 2.7%, 5.5% and 2.0% in biomarker levels for systemic inflammation, coagulation, systemic oxidative stress, antioxidant activity and endothelial function, respectively [35]. We also observed greater adverse cardiovascular mortality in females than in males, although previous studies yielded conflicting results [36]. These findings indicated that effect-modifiers should be taken into account when interpreting the impact of air pollutants on cardiovascular mortality.
Except for metropolitans, the adverse effects conferred by air pollutants remain significant in other cities of northwest China. More stringent regulations on improving air quality, coupled with implementation of routine atmosphere monitoring, are urgently needed. In light of different impacts on cardiovascular mortality, we propose nation-wide dynamic monitoring of pollutant levels, which will better inform citizens at risk of developing cardiovascular events in case of abrupt increase in pollutant levels.
Limitations of our study include the significant heterogeneity among all pollutants except for PM2.5 and O3. Factors that could potentially explain for the significant heterogeneity may include different study designs and methods for statistical analysis, the diverse population characteristics, diverse regions where study participants are residing, and the methods for measurement and recording, etc. However, pooled estimates showed consistently remarkable adverse effect among all pollutants, and the effect size was unchanged in subgroup analyses. We only calculated pooled estimates based on single-pollutant model without adjustment. The effects of air pollution on cardiovascular mortality might have been overestimated because our pooled estimates were merely based on short-term exposures to air pollution. Our study estimated the health effect on more general population; however, the effects were likely to be greater in patients with pre-existing cardiovascular diseases. Finally, most cities in our study were mega-cities that harbored dense population, therefore it remains unclear whether our findings could be extrapolated to cities with smaller scales.
In summary, short-term exposure of air pollution is associated with greater cardiovascular mortality. Our results reinforce the public health importance of surveillance of air pollution, which would help inform policy-makers to establish more stringent regulations that would mitigate air pollutant levels. Despite small pooled estimates, the impact is substantial for the entire population. More high-quality studies in China are urgently needed to identify the exposure-response effect in order to determine the susceptible population, making relevant policy for further prevention of the detrimental effects due to air pollution.
MATERIALS AND METHODS
Literature search and selection
Systematic literature search was performed for epidemiological studies conducted in China that examined cardiovascular disease mortality and hospital admissions in association with short-term exposure to air pollutants, including particulate matter (PM10, PM2.5) and gaseous pollutants (NO2, SO2, O3).
We searched PubMed, Web of Science, Cochrane library, Wan Fang, and CNKI databases for literature published in English or Chinese, up to January 2017, using the terms: (1) PM2.5, PM10, NO2, SO2, O3, air pollutants, air pollution; (2) Cardiovascular diseases, adverse effect, mortality, death; (3) time-series, case-crossover, cohort studies; (4) China, Chinese. Additional literature was manually retrieved to identify studies not included during the initial search. Selection of studies was based on viewing the titles, abstracts and full-length articles.
We focused on time-series or case-crossover studies that reported excess risk (ER) and the 95% confidence intervals (95% CI) of cardiovascular mortality in association with short-term exposure to air pollutants (NO2, SO2, O3, PM2.5, and PM10) in China. Only single-pollutant model results and studies on human were included. Following inclusion criteria were used: (1) All epidemiological studies, involved the health impact of exposure to mentioned pollutants in the Chinese population; (2) original studies expressed quantitative exposure–response relationships between mentioned pollutants and cardiovascular health outcomes (excess risk[ER], and their 95%confidence intervals [95% CI]); (3) subjects were not from specific high-risk groups (e.g. smokers or children); (4) the health outcomes were cardiovascular mortality.
Data extraction and meta-analysis
Data were extracted independently by two investigators (H.R.L and F.Y.C.) and discrepancy was adjudicated by a third investigator (L.Z.). For selected studies, the title, authors, location, year of publication, study period, study design, number of events, type of pollutants and health outcomes were extracted and entered into an electronic database.
Association between short-term exposure of air pollution and cardiovascular mortality was frequently determined for the duration of several days prior to the events, showing the estimates as single time lags (e.g. lag 1) or cumulative lags (e.g. lag 0–1 or 0–2). For eligible studies, we selected the lags to pooled risk estimates with the following rules: 1) the estimate could be directly included if only one lag estimate was presented; 2) if multiple lags were presented, we sequentially selected with the following criteria: [37, 38] (a) the a-priori lag; (2) the lag with the greatest statistical significance; (3) the lag with the largest effect estimate; (4) the lag with the shortest period.
We did subgroup analyses according to different lag patterns (0, 1, 2, 0–1, 0–2 days), age (≤ 65 vs. > 65 years), gender (male vs. female), and temperature (warm vs. cold).
Excess risks (ERs) were pooled for standardized estimates with incremental concentration of 10 μg/m3 [22]. We used Cochran’s X2 test and I2 to examine the heterogeneity among effect estimates [39]. P > 0.05 indicated homogeneity, otherwise heterogeneity among estimates. I2 statistics of 0~25, 25~50 and > 50 indicated low, moderate, and significant heterogeneity, respectively [40]. We chose I2 > 50 as an indicator of significant heterogeneity. Random-effect model was applied to pool estimates in case of significant heterogeneity; otherwise, fixed-effect model was applied [39]. Study bias was detected using funnel plot, based on Begg’s and Egger’s test [41, 42]. Statistical significance was taken for P < 0.05. All analyses were conducted with STATA version 12.0 (Stata Corporation College Station, TX, USA).
Author contributions
All authors were involved in the conception and design of the study. L.Z., H.R.L and F.Y.C. contributed to the data acquisition. L.Z., H.R.L., Z.C., W.J.G., and J. H. L contributed to the analysis and writing of the manuscript. All authors critically reviewed and approved the final manuscript.
CONFLICTS OF INTEREST
We declare that we have no conflicts of interest.
FUNDING
This work was supported by the National Natural Science Foundation of China (Grant No.81670195 to Zi Chen, Grant No.81470205 to Jian-hua Li), Guangdong Province Industrial Technology Research and Development Project (Grant No.2013B021800094 to Lei Zhao), Guangdong Province Chinese Medicine Grant (Grant No. 20172102 to Lei Zhao), Guangzhou Medical University Science and Technology Innovation Project (Grant No. XS201604 to Lei Zhao) and Pearl River S&T Nova Program of Guangzhou No. 201710010097 and Guangdong Province Universities and Colleges Pearl River Scholar Funded Scheme 2017 (To Wei-jie Guan).
REFERENCES
1. Mortality GB, GBD 2013 Mortality and Causes of Death Collaborators. Global, regional, and national age-sex specific all-cause and cause-specific mortality for 240 causes of death, 1990–2013: a systematic analysis for the Global Burden of Disease Study 2013. Lancet. 2015; 385:117–71. https://doi.org/10.1016/S0140-6736(14)61682-2.
2. Mendis S, Davis S, Norrving B. Organizational update: the world health organization global status report on noncommunicable diseases 2014; one more landmark step in the combat against stroke and vascular disease. Stroke. 2015; 46:e121–2. https://doi.org/10.1161/STROKEAHA.115.008097.
3. Venkatesan P. WHO report: air pollution is a major threat to health. Lancet Respir Med. 2016; 4:351. https://doi.org/10.1016/S2213-2600(16)30014-5.
4. Brunekreef B, Holgate ST. Air pollution and health. Lancet. 2002; 360:1233–42. https://doi.org/10.1016/S0140-6736(02)11274-8.
5. Franchini M, Mannucci PM. Air pollution and cardiovascular disease. Thromb Res. 2012; 129:230–4. https://doi.org/10.1016/j.thromres.2011.10.030.
6. Seaton A, MacNee W, Donaldson K, Godden D. Particulate air pollution and acute health effects. Lancet. 1995; 345:176–8.
7. Peters A, Dockery DW, Muller JE, Mittleman MA. Increased particulate air pollution and the triggering of myocardial infarction. Circulation. 2001; 103:2810–5.
8. Winquist A, Schauer JJ, Turner JR, Klein M, Sarnat SE. Impact of ambient fine particulate matter carbon measurement methods on observed associations with acute cardiorespiratory morbidity. J Expo Sci Environ Epidemiol. 2015; 25:215–21. https://doi.org/10.1038/jes.2014.55.
9. Nakhle MM, Farah W, Ziade N, Abboud M, Salameh D, Annesi-Maesano I. Short-term relationships between emergency hospital admissions for respiratory and cardiovascular diseases and fine particulate air pollution in Beirut, Lebanon. Environ Monit Assess. 2015; 187:196. https://doi.org/10.1007/s10661-015-4409-6.
10. Wong TW, Lau TS, Yu TS, Neller A, Wong SL, Tam W, Pang SW. Air pollution and hospital admissions for respiratory and cardiovascular diseases in Hong Kong. Occup Environ Med. 1999; 56:679–83.
11. Guilbert JJ. The world health report 2002 - reducing risks, promoting healthy life. Educ Health (Abingdon). 2003; 16:230. https://doi.org/10.1080/1357628031000116808.
12. Wellenius GA, Burger MR, Coull BA, Schwartz J, Suh HH, Koutrakis P, Schlaug G, Gold DR, Mittleman MA. Ambient air pollution and the risk of acute ischemic stroke. Arch Intern Med. 2012; 172:229–34. https://doi.org/10.1001/archinternmed.2011.732.
13. Krzyzanowski M. WHO Air Quality Guidelines for Europe. J Toxicol Environ Health A. 2008; 71:47–50. https://doi.org/10.1080/15287390701557834.
14. Langrish JP, Li X, Wang S, Lee MM, Barnes GD, Miller MR, Cassee FR, Boon NA, Donaldson K, Li J, Li L, Mills NL, Newby DE, et al. Reducing personal exposure to particulate air pollution improves cardiovascular health in patients with coronary heart disease. Environ Health Perspect. 2012; 120:367–72. https://doi.org/10.1289/ehp.1103898.
15. Molina MJ, Molina LT. Megacities and atmospheric pollution. J Air Waste Manag Assoc. 2004; 54:644–80.
16. Shah AS, Lee KK, McAllister DA, Hunter A, Nair H, Whiteley W, Langrish JP, Newby DE, Mills NL. Short term exposure to air pollution and stroke: systematic review and meta-analysis. BMJ. 2015; 350:h1295. https://doi.org/10.1136/bmj.h1295.
17. Stafoggia M, Samoli E, Alessandrini E, Cadum E, Ostro B, Berti G, Faustini A, Jacquemin B, Linares C, Pascal M, Randi G, Ranzi A, Stivanello E, et al. Short-term associations between fine and coarse particulate matter and hospitalizations in Southern Europe: results from the MED-PARTICLES project. Environ Health Perspect. 2013; 121:1026–33. https://doi.org/10.1289/ehp.1206151.
18. Franklin M, Zeka A, Schwartz J. Association between PM2.5 and all-cause and specific-cause mortality in 27 US communities. J Expo Sci Environ Epidemiol. 2007; 17: 279–87. https://doi.org/10.1038/sj.jes.7500530.
19. Chung KF, Zhang J, Zhong N. Outdoor air pollution and respiratory health in Asia. Respirology. 2011; 16:1023–6. https://doi.org/10.1111/j.1440-1843.2011.02034.x.
20. Atkinson RW, Mills IC, Walton HA, Anderson HR. Fine particle components and health--a systematic review and meta-analysis of epidemiological time series studies of daily mortality and hospital admissions. J Expo Sci Environ Epidemiol. 2015; 25:208–14. https://doi.org/10.1038/jes.2014.63.
21. Shang Y, Sun Z, Cao J, Wang X, Zhong L, Bi X, Li H, Liu W, Zhu T, Huang W. Systematic review of Chinese studies of short-term exposure to air pollution and daily mortality. Environ Int. 2013; 54:100–11. https://doi.org/10.1016/j.envint.2013.01.010.
22. Lu F, Xu D, Cheng Y, Dong S, Guo C, Jiang X, Zheng X. Systematic review and meta-analysis of the adverse health effects of ambient PM2.5 and PM10 pollution in the Chinese population. Environ Res. 2015; 136:196–204. https://doi.org/10.1016/j.envres.2014.06.029.
23. Samet JM, Dominici F, Curriero FC, Coursac I, Zeger SL. Fine particulate air pollution and mortality in 20 U.S. cities, 1987-1994. N Engl J Med. 2000; 343:1742–9. https://doi.org/10.1056/NEJM200012143432401.
24. Zanobetti A, Schwartz J. The effect of fine and coarse particulate air pollution on mortality: a national analysis. Environ Health Perspect. 2009; 117:898–903. https://doi.org/10.1289/ehp.0800108.
25. Beelen R, Stafoggia M, Raaschou-Nielsen O, Andersen ZJ, Xun WW, Katsouyanni K, Dimakopoulou K, Brunekreef B, Weinmayr G, Hoffmann B, Wolf K, Samoli E, Houthuijs D, et al. Long-term exposure to air pollution and cardiovascular mortality: an analysis of 22 European cohorts. Epidemiology. 2014; 25:368–78. https://doi.org/10.1097/EDE.0000000000000076.
26. Janssen NA, Fischer P, Marra M, Ameling C, Cassee FR. Short-term effects of PM2.5, PM10 and PM2.5-10 on daily mortality in The Netherlands. Sci Total Environ. 2013; 463–464:20–6. https://doi.org/10.1016/j.scitotenv.2013.05.062.
27. Martinelli N, Olivieri O, Girelli D. Air particulate matter and cardiovascular disease: a narrative review. Eur J Intern Med. 2013; 24:295–302. https://doi.org/10.1016/j.ejim.2013.04.001.
28. Guan WJ, Zheng XY, Chung KF, Zhong NS. Impact of air pollution on the burden of chronic respiratory diseases in China: time for urgent action. Lancet. 2016; 388:1939–51. https://doi.org/10.1016/S0140-6736(16)31597-5.
29. Liu Y, Goodson JM, Zhang B, Chin MT. Air pollution and adverse cardiac remodeling: clinical effects and basic mechanisms. Front Physiol. 2015; 6:162. https://doi.org/10.3389/fphys.2015.00162.
30. Brook RD, Rajagopalan S, Pope CA 3rd, Brook JR, Bhatnagar A, Diez-Roux AV, Holguin F, Hong Y, Luepker RV, Mittleman MA, Peters A, Siscovick D, Smith SC Jr, et al., and American Heart Association Council on Epidemiology and Prevention, Council on the Kidney in Cardiovascular Disease, and Council on Nutrition, Physical Activity and Metabolism. Particulate matter air pollution and cardiovascular disease: An update to the scientific statement from the American Heart Association. Circulation. 2010; 121:2331–78. https://doi.org/10.1161/CIR.0b013e3181dbece1.
31. Kim SE, Lim YH, Kim H. Temperature modifies the association between particulate air pollution and mortality: A multi-city study in South Korea. Sci Total Environ. 2015; 524–525: 376–83. https://doi.org/10.1016/j.scitotenv.2015.03.137.
32. Hales S, Salmond C, Town GI, Kjellstrom T, Woodward A. Daily mortality in relation to weather and air pollution in Christchurch, New Zealand. Aust N Z J Public Health. 2000; 24:89–91.
33. Qian Z, Lin HM, Stewart WF, Kong L, Xu F, Zhou D, Zhu Z, Liang S, Chen W, Shah N, Stetter C, He Q. Seasonal pattern of the acute mortality effects of air pollution. J Air Waste Manag Assoc. 2010; 60:481–8.
34. Kan H, London SJ, Chen G, Zhang Y, Song G, Zhao N, Jiang L, Chen B. Season, sex, age, and education as modifiers of the effects of outdoor air pollution on daily mortality in Shanghai, China: The Public Health and Air Pollution in Asia (PAPA) Study. Environ Health Perspect. 2008; 116:1183–8. https://doi.org/10.1289/ehp.10851.
35. Wu S, Yang D, Pan L, Shan J, Li H, Wei H, Wang B, Huang J, Baccarelli AA, Shima M, Deng F, Guo X. Ambient temperature and cardiovascular biomarkers in a repeated-measure study in healthy adults: A novel biomarker index approach. Environ Res. 2017; 156:231–8. https://doi.org/10.1016/j.envres.2017.02.036.
36. Clougherty JE. A growing role for gender analysis in air pollution epidemiology. Cien Saude Colet. 2011; 16:2221–38.
37. Shah AS, Langrish JP, Nair H, McAllister DA, Hunter AL, Donaldson K, Newby DE, Mills NL. Global association of air pollution and heart failure: a systematic review and meta-analysis. Lancet. 2013; 382:1039–48. https://doi.org/10.1016/S0140-6736(13)60898-3.
38. Atkinson RW, Cohen A, Mehta S, Anderson HR. Systematic review and meta-analysis of epidemiological time-series studies on outdoor air pollution and health in Asia. Air Qual Atmos Health. 2011; 5:383–91. https://doi.org/10.1007/s11869-010-0123-2.
39. DerSimonian R, Laird N. Meta-analysis in clinical trials. Control Clin Trials. 1986; 7:177–88.
40. Huedo-Medina TB, Sanchez-Meca J, Marin-Martinez F, Botella J. Assessing heterogeneity in meta-analysis: Q statistic or I2 index? Psychol Methods. 2006; 11:193–206. https://doi.org/10.1037/1082-989X.11.2.193.
41. Anderson HR, Atkinson RW, Peacock JL, Sweeting MJ, Marston L. Ambient particulate matter and health effects: publication bias in studies of short-term associations. Epidemiology. 2005; 16:155–63.
42. Seagroatt V, Stratton I. Bias in meta-analysis detected by a simple, graphical test. Test had 10% false positive rate. BMJ. 1998; 316:470.