
INTRODUCTION
Taurine up-regulated gene 1 (TUG1) is a newly identified lncRNA, located at chromosome 22q12 with a length of about 7.1kb. It was first reported as a gene up-regulated by taurine in the development of mouse retinal cells [1]. The lncRNA TUG1 also was found that involved in regulating mitochondrial bioenergetics by affected the expression of PGC-1α in diabetic nephropathy [2]. Furthermore, previously study has showed that decreased lncRNA TUG1 expression promoted mouse pancreatic β cells apoptosis and reduced insulin secretion [3]. In addition, up-regulated TUG1 prevent mouse livers from cold induced damage by suppressing cell apoptosis and inflammation [4]. Together, these results indicate that lncRNA TUG1 plays an important role in regulating the development of multiple normal biological processes.
Similarly, numerous studies have reported that TUG1 contribute to proliferation and apoptosis in a variety of tumor cells [5–7]. Increased lncRNA TUG1 expression promotes cell proliferation, metastasis and inhibits cell apoptosis to act as an oncogene in various cancers, such as breast cancer (BRC) [7], colorectal cancer (CRC) [8], ovarian cancer (OC) [9] and small cell lung cancer (SCLC) [10]. However, TUG1 as a tumor suppressor in some other tumors including non-small cell lung cancer (NSCLC) [11, 12], glioma [13], and urothelial carcinoma (UC) [14], up-regulated TUG1 inhibit cell proliferation and reduce tumorigenicity. Therefore, the role of TUG1 in the development and progression of tumours is inconsistent.
Besides, the prognostic value of TUG1 expression in cancer patients also with this same contradiction. Increased TUG1 expression in breast cancer (BRC) [7], bladder cancer (BC) [15], esophageal squamous cell carcinoma (ESCC) [16], muscle-invasive bladder cancer (MIBC) [17], osteosarcoma (OSA) [18], colorectal cancer (CRC) [8], gastric cancer (GC) [19], small cell lung cancer (SCLC) [10] or clear-cell renal cell carcinoma (ccRCC) [20] patients is associated with poor survival. However, in patients with non-small cell lung cancer (NSCLC) [11, 12], urothelial carcinoma (UC) [14] or glioma [13], the increased TUG1 expression is correlated with favorable survival. Thus, we performed present systematic review and meta-analysis to explore the reason for these inconsistent phenomena and investigate the clinical values of TUG1 expression level in various tumors. We mainly discussed the expression of TUG1 associate with prognosis, and metastasis of cancer patients. It aimed to more precisely assess the correlation between TUG1 expression and clinical outcome of human cancers.
RESULTS
Study characteristics
As showed in the flowchart (Figure 1), a total of 135 potentially relevant studies were searched from Embase, PubMed, Web of Science, and China Knowledge Resource Integrated (CNKI) databases. After excluding duplicates, 67 reports were preserved. After reviewing the title and abstracts, 44 records were removed. Subsequently, from the 23 remaining articles 8 were removed due to insufficient data. Finally, a total of 15 studies comprise 1560 patients were included in this meta-analysis [6–20]. Among these cancers derived from 13 tumor types: non-small cell lung cancer [11, 12], bladder cancer [15], muscle-invasive bladder cancer [17], esophageal squamous cell carcinoma [16], ovarian cancer [9], glioma [13], breast cancer [7], osteosarcoma [18], colorectal cancer [8], gastric cancer [19], clear-cell renal cell carcinoma [6, 20], urothelial carcinoma [14], and small cell lung cancer (SCLC) [10]. In all cases, TUG1 expression was detected by qRT-PCR.
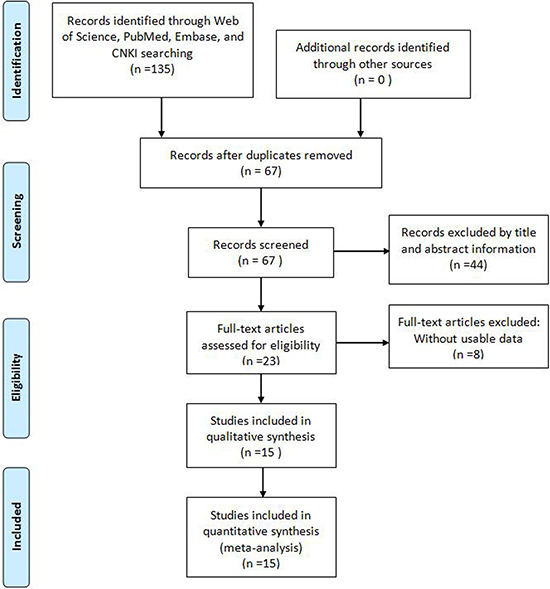
Figure 1: Flow diagram of the literature search and selection.
Correlation of TUG1 expression with overall survival
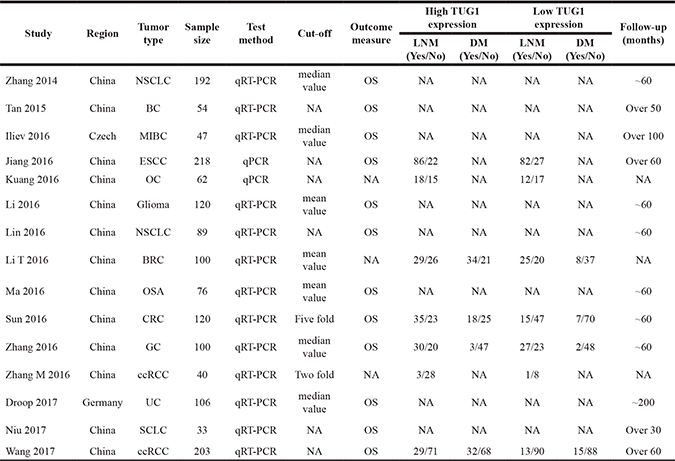
The association between TUG1 expression and overall survival (OS) was detected in 12 studies including 1358 patients (Table 1). Due to significant heterogeneity among studies (I2 = 75.7%, P < 0.001) was observed, the random-effects model was used to pool the results. The merged HR indicated no significant relationship between TUG1 expression and OS (HR = 1.28, 95% CI: 0.96–1.69, P = 0.091; random-effects model) (Figure 2). To minimize heterogeneity among OS datasets, we performed subgroup analyses according to cancer type, region, sample size, analysis method, and expression level. As the results showed in Table 2, the region subgroup and analysis method subgroup exhibited no association with OS, and significant heterogeneity were present. When sorting by cancer type, over-expression of TUG1 had an unfavorable prognostic value for bladder cancer (HR = 2.67, 95% CI: 1.47–4.87, P = 0.001) but no significant association with other tumors. When stratifying by sample size, high TUG1 expression was significantly related to poor OS in patients sample size less than 100 subgroup (HR = 2.08, 95% CI: 1.44–3.00, P < 0.001 with less heterogeneity), while the sample size more than 100 subgroup exhibited no correlation (HR=1.00, 95% CI: 0.743–1.37, P = 0.991). When grouped according to the expression level of TUG1 in cancer patients, the pooled HRs for the increased TUG1 expression subgroup and decreased TUG1 expression subgroup were 1.91(95% CI: 1.33–2.75, P < 0.001)) and 0.63 (95% CI: 0.48–0.82, P = 0.001 with less heterogeneity), respectively.
Table 1: Main characteristic of the eligible studies for meta-analysis
ESCC: esophageal squamous cell carcinoma; GC: gastric cancer; SCLC: small cell lung cancer; MIBC: muscle-invasive bladder cancer; NSCLC: non-small cell lung cancer; ccRCC: clear-cell renal cell carcinoma; CRC: colorectal cancer; OSA: osteosarcoma; UC: urothelial carcinoma; BC: bladder cancer; OC: ovarian cancer; BRC: breast cancer; OS: overall survival.
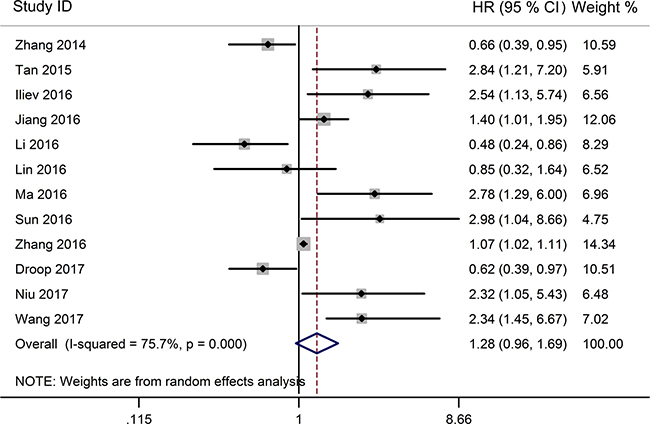
Figure 2: Forest plot for the relationship between TUG1 expression levels with OS.
Table 2: Main results of subgroup analyses
Categories |
Subgroups |
Studies (n) |
HR (95% CI) |
P |
Heterogeneity |
|
|---|---|---|---|---|---|---|
I2 (%) |
Ph |
|||||
All |
12 |
1.28 (0.96, 1.69) |
0.091 |
75.7 |
0.000 |
|
Cancer type |
1)Digestive system cancers |
3 |
1.29 (0.92,1.81) |
0.144 |
68.0 |
0.044 |
Respiratory system cancers |
3 |
1.04 (0.49, 2.17) |
0.927 |
71.3 |
0.031 |
|
Urinary system cancers |
4 |
1.71 (0.72, 4.09) |
0.225 |
83.5 |
0.000 |
|
Others |
2 |
1.14 (0.20,6.37) |
0.882 |
91.6 |
0.001 |
|
2)NSCLC |
2 |
0.70 (0.47,1.03) |
0.073 |
0.0 |
0.594 |
|
Bladder cancer |
2 |
2.67(1.47, 4.87) |
0.001 |
0.0 |
0.856 |
|
Others |
8 |
1.28(0.92, 1.80) |
0.147 |
77.7 |
0.000 |
|
Region |
Asia |
10 |
1.32 (0.97, 1.79) |
0.074 |
74.4 |
0.000 |
Europe |
2 |
1.20 (0.30, 4.80) |
0.797 |
88.8 |
0.003 |
|
Sample size |
≥ 100 |
7 |
1.00 (0.743 1.37) |
0.991 |
77.4 |
0.000 |
< 100 |
5 |
2.08 (1.44, 3.00) |
< 0.001 |
32.5 |
0.205 |
|
Analysis method |
Multivariate |
6 |
1.38 (0.97, 1.96) |
0.074 |
78.0 |
0.000 |
Survival curves |
6 |
1.23 (0.65, 2.30) |
0.526 |
77.1 |
0.001 |
|
Expression level |
Increased in tumors |
8 |
1.91 (1.33, 2.75) |
< 0.001 |
75.1 |
0.000 |
Decreased in tumors |
4 |
0.63(0.48, 0.82) |
0.001 |
0.0 |
0.738 |
|
Correlation of TUG1 expression with clinicopathological features
From the pooled results (Figure 3, Table 3), it found that high TUG1 expression was significantly associated with distant metastasis (DM) (OR = 4.22, 95% CI: 2.66–6.70, P < 0.001) (Figure 4, Table 3), and tumor differentiation (OR = 2.45, 95% CI: 1.28–4.70, P = 0.007) (Table 3). However, there was no significant correlation between the high TUG1 levels and gender (OR = 1.04, 95% CI: 0.77–1.42, P = 0.774) or age (OR = 0.75, 95% CI: 0.51–1.10, P = 0.136) or lymph node metastasis (OR = 1.45, 95% CI: 0.85–2.50, P = 0.177) or clinical TNM stage (OR = 0.55, 95% CI: 0.17–1.81, P = 0.326) (Table 3). Due perhaps to the inadequate data, we were failed to detect the association between the increased TUG1 expression and some other clinicopathological factors.
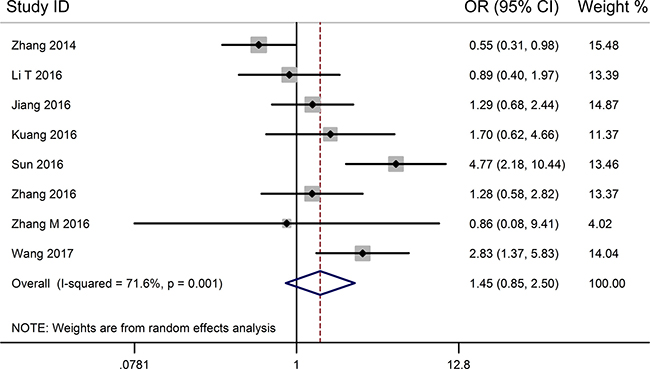
Figure 3: Forest plot for the relationship between TUG1 expression levels with LNM.
Table 3: Meta-analysis results of the associations of increased TUG1 expression with clinicopathological parameters
Clinicopathological parameter |
Patients size |
OR (95% CI) |
P value |
Heterogeneity |
|
|---|---|---|---|---|---|
I2 (%) |
Ph |
||||
Gender(Male vs. Female) |
952 |
1.00 (0.76–1.31) |
0.978 |
0.0 |
0.536 |
Age ( Age > 60 vs. ≤ 60) |
422 |
0.75 (0.51–1.10) |
0.136 |
0.0 |
0.460 |
TNM stage( I/II vs. III/IV) |
602 |
0.55 (0.17–1.81) |
0.326 |
91.2 |
0.000 |
Differentiation ( Low /Undiffe vs. Middle/High) |
641 |
2.45 (1.28–4.70) |
0.007 |
70.0 |
0.019 |
Lymph node metastasis (Yes vs. No) |
1034 |
1.45 (0.85–2.50) |
0.177 |
71.6 |
0.001 |
Distant metastasis (Yes vs. No) |
523 |
4.22 (2.66–6.70) |
< 0.001 |
42.2 |
0.158 |
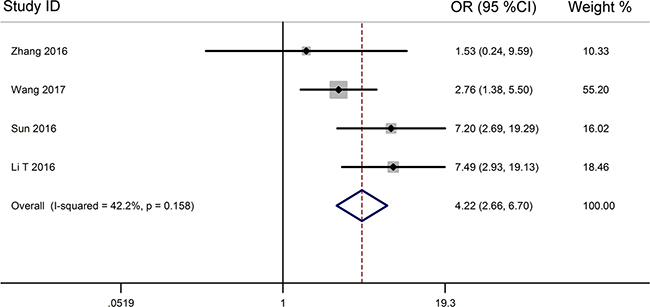
Figure 4: Forest plot for the relationship between TUG1 expression levels with DM.
Sensitivity analysis
A sensitivity analysis was conducted to evaluate the robustness of the summarized results, which were not significantly influenced by successively excluding each individual study from the pooled analysis. This suggested that the pooled HR of OS was robust (Figure 5).
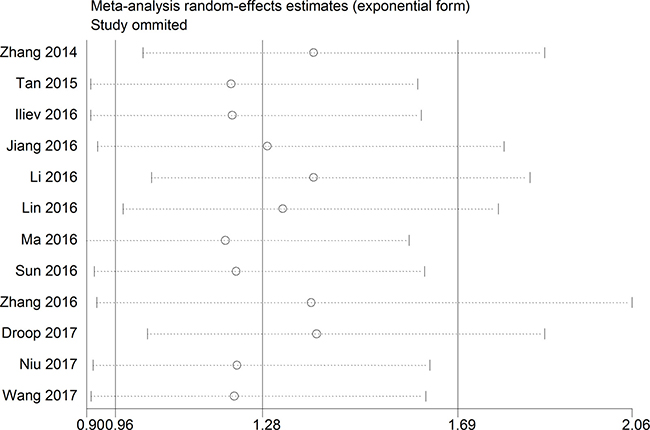
Figure 5: The sensibility analysis for this meta-analysis.
Publication bias
The publication bias of this meta-analysis was assessed by Begg’s funnel plot analysis. The funnel plot for the OS was asymmetric, suggesting potential publication bias (Figure 6). However, the Begg’s test showed no severe publication bias among the included studies (Pr > |z| = 0.150).
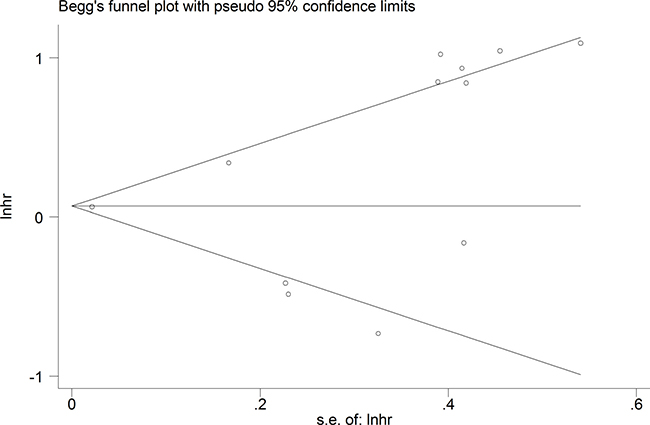
Figure 6: Funnel plot analysis of potential publication bias for meta-analysis.
DISCUSSION
Malignant neoplasm is one of the prevalent and deadly diseases worldwide. Recent years, accumulating evidences reveal that aberrantly expression of lncRNAs has been linked to tumorigenesis and neoplasm progression [6, 7, 21–23]. Across all cancer-related lncRNAs, TUG1 was a newly identified non-protein coding RNA gene, it participates in regulating proliferation and apoptosis in a variety of tumor cells [5–9, 24]. Interestingly, previous studies have shown that TUG1 were up-regulated in BRC [7], CRC [8], OC [9], SCLC [10], OSA [18], GC [19], ESCC [16], ccRCC [6, 20], BC [15] and MIBC [17], and function as an oncogene, while TUG1 were down-regulated in NSCLC [11, 12], glioma [13] as well as UC [14], and function as a tumor suppressor. Due to inconsistent evidence existed about the role of TUG1 in tumorigenesis and neoplasm progression was inconsistent. It is necessary to systematically explore the relationship between TUG1 expression and cancer.
To analyze the results of previous studies evaluating the relationship of TUG1 expression with cancer prognosis, we performed this comprehensive meta-analysis. A total of 15 eligible studies, comprising 13 common cancer types, met the selection criterions. The data of each study were handled according to OS, gender, differentiation, clinical stage, LNM and DM. The results of this meta-analysis indicated that no significant association between high TUG1 expression and OS of cancers (HR = 1.28, 95% CI: 0.96–1.69, P = 0.091), which was consistent with similar research of Yu et al. [25]. We also found increased TUG1 expression may be an unfavorable prognostic factor for bladder cancer based on subgroup analysis, which was consistent with similar research of Liu et al. [26]. In addition, high TUG1 expression is significantly correlated with DM (OR = 4.22, 95% CI: 2.66–6.70, P < 0.001) and tumor differentiation (OR=2.45, 95% CI: 1.28–4.70, P = 0.007). Furthermore, no significant correlations were observed between the high TUG1 expression and gender (OR = 1.04, 95% CI: 0.77–1.42, P = 0.774 or age (OR = 0.75, 95% CI: 0.51–1.10, P = 0.136) or lymph node metastasis (OR=1.45, 95% CI: 0.85–2.50, P = 0.177) or clinical TNM stage (OR = 0.55, 95% CI: 0.17–1.81, P = 0.326). However, the result of high TUG1 expression and LNM in our study was consistent with the result of Liu et al. [26] and contrary to Yang et al. [27]. To explore whether the heterogeneity affect the pooled results, we found increased TUG1 expression was positively associated with LNM (OR = 1.75, 95% CI: 1.09–2.81, P < 0.001, random effects model) and advanced clinical stage (OR = 0.33, 95% CI: 0.14–0.77, P = 0.013) after exclude a datasets from Zhang et al. [11]. Nevertheless, due to the small size of the study, this conclusion should be further verified.
There are some limitations of the current study that should be considered in explaining the results of this meta-analysis. Firstly, there was statistical heterogeneity in our present study. The sources of heterogeneity were diverse, such as cancer type, sample size, the region of patients, tumor stage, cut off value, and so on. Noteworthy, the expression pattern of TUG1 were inconsistent in tumors, TUG1 were up-regulated compared to adjacent tissues in some tumors [6–10, 15–20], while TUG1 were down-regulated in some other tumors [11–14]. We further analysis found that high TUG1 level were positively associated with poor OS in increased TUG1 expression subgroup (HR = 1.91, 95%CI: 1.33–2.75, P < 0.001), while increased TUG1 expression act as a favorable factor for OS in decreased TUG1 expression subgroup (HR = 0.63, 95%CI: 0.48–0.82, P = 0.001). Secondly, most of the included tumor patients from Chinese sample populations. Our results should be cautiously extended to other ethnic groups. Thirdly, some HRs and their corresponding 95%CIs were extracted from Kaplan-Meier curves, which are less reliable than those directly obtained from the primary studies. Finally, the cut-off values of increased TUG1 expression not consistent may be restricted to expand the clinical applicability.
In summary, our meta-analysis provides evidence that increased TUG1 expression is associated with poorer survival in cancer patients with high TUG1 expression but better survival in patients with low TUG1 expression. However, the results need to be confirmed by future studies with well-designed and larger-size in various tumors.
MATERIALS AND METHODS
Literature search strategy
Literature about lncRNA TUG1 expression was searched in the online electronic databases PubMed, Embase, Web of Science and CNKI (up to April 25, 2017). Search keywords or their combinations were as follows: “taurine upregulated gene 1 OR TUG1” AND “cancer OR tumor OR tumour OR neoplasm OR neoplasma OR neoplasia OR carcinoma OR glioma OR angiosarcoma OR lymphoma OR melanoma OR leukemia”. Only include English or Chinese articles in this study.
Study selection criteria
The inclusion criteria for present study were as follows: (1) studies researched the association between TUG1 expression and prognosis of cancer patients; (2) the expression levels of TUG1 were divided into two groups: high or low; (3) complete data were available for computation of odds ratio (OR) or hazard ratio (HR) with 95% confidence interval (CI), and Kaplan-Meier curves or, if unavailable, related data obtained by contacting the corresponding authors.
The exclusion criteria for our meta-analysis include the following: (1) duplicate articles; (2) letters, case reports, expert opinions, editorials and reviews; (3) studies without available data; (4) sample cases fewer than 30; (5) non-human research.
Date extraction and quality assessment
Two investigators (Na Li and Wei Li) independently using the Newcastle-Ottawa Quality Assessment Scale (NOS) to assess the quality of each include study, which were reported in previously studies [28, 29]. All included studies were considered to be of high quality based on NOS. The data from each included study were extracted and reviewed by two authors (Wei Li and Ke Shi) independently. To resolve the disagreements, a consensus was reached by another researcher (Na Li). The collected data were as follows: first author’s name, publication date, study region, tumor type, tumor stage, detection method of TUG1 expression, assessment criteria for TUG1 expression, sample size, total patients number, number of patients in the high and low TUG1 level group, number of patients with LNM and DM in each group, survival data analysis, follow-up period, HR and corresponding 95% CI. If the survival data not showed in articles directly, a request was made to the corresponding authors, or using the Engauge Digitizer v.4.1 software to obtain it from the Kaplan-Meier curves as previously described [29].
Statistical methods
The STATA 12.0 software (Stata, College Station, Texas) was used to carry out all statistical analyses. Heterogeneity of pooled HRs or Ors among the eligible studies was judged by using the I-squared statistic; with I2 values > 50% indicating that significant heterogeneity was present. A fixed effects model was used to analyze the pooled results when the included studies without significant heterogeneity (I2 < 50 %). On the contrary, a random effects model was employed (I2 > 50%). Sensibility analysis was executed to evaluate the robustness of the overall results. Begg’s funnel plot was used to assess potential publication bias. Subgroup analysis was utilized to investigate the origin of heterogeneity. All the P-values less than 0.05 were regarded as statistical significance.
ACKNOWLEDGMENTS AND FUNDING
This work was supported by funding from the Key Program of Hunan province Science and Technology Hall (2015SK20662).
CONFLICTS OF INTEREST
All authors declare that there are no conflicts of interests.
REFERENCES
1. Young TL, Matsuda T, Cepko CL. The noncoding RNA taurine upregulated gene 1 is required for differentiation of the murine retina. Curr Biol. 2005; 15:501–12.
2. Long J, Badal SS, Ye Z, Wang Y, Ayanga BA, Galvan DL, Green NH, Chang BH, Overbeek PA, Danesh FR. Long noncoding RNA Tug1 regulates mitochondrial bioenergetics in diabetic nephropathy. J Clin Invest. 2016; 126:4205–18.
3. Yin DD, Zhang EB, You LH, Wang N, Wang LT, Jin FY, Zhu YN, Cao LH, Yuan QX, De W, Tang W. Downregulation of lncRNA TUG1 affects apoptosis and insulin secretion in mouse pancreatic beta cells. Cell Physiol Biochem. 2015; 35:1892–904.
4. Su S, Liu J, He K, Zhang M, Feng C, Peng F, Li B, Xia X. Overexpression of the long noncoding RNA TUG1 protects against cold-induced injury of mouse livers by inhibiting apoptosis and inflammation. FEBS J. 2016; 283:1261–74.
5. Li Z, Shen J, Chan MT, Wu WK. TUG1: a pivotal oncogenic long non-coding RNA of human cancers. Cell Prolif. 2016; 49:471–5.
6. Zhang M, Lu W, Huang Y, Shi J, Wu X, Zhang X, Jiang R, Cai Z, Wu S. Downregulation of the long noncoding RNA TUG1 inhibits the proliferation, migration, invasion and promotes apoptosis of renal cell carcinoma. J Mol Histol. 2016; 47:421–28.
7. Li T, Liu Y, Xiao H, Xu G. Long non-coding RNA TUG1 promotes cell proliferation and metastasis in human breast cancer. Breast Cancer. 2017; 24:535–43.
8. Sun J, Ding C, Yang Z, Liu T, Zhang X, Zhao C, Wang J. The long non-coding RNA TUG1 indicates a poor prognosis for colorectal cancer and promotes metastasis by affecting epithelial-mesenchymal transition. J Transl Med. 2016; 14:42.
9. Kuang D, Zhang X, Hua S, Dong W, Li Z. Long non-coding RNA TUG1 regulates ovarian cancer proliferation and metastasis via affecting epithelial-mesenchymal transition. Exp Mol Pathol. 2016; 101:267–73.
10. Niu Y, Ma F, Huang W, Fang S, Li M, Wei T, Guo L. Long non-coding RNA TUG1 is involved in cell growth and chemoresistance of small cell lung cancer by regulating LIMK2b via EZH2. Mol Cancer. 2017; 16:5.
11. Zhang EB, Yin DD, Sun M, Kong R, Liu XH, You LH, Han L, Xia R, Wang KM, Yang JS, De W, Shu YQ, Wang ZX. P53-regulated long non-coding RNA TUG1 affects cell proliferation in human non-small cell lung cancer, partly through epigenetically regulating HOXB7 expression. Cell Death Dis. 2014; 5:e1243.
12. Lin PC, Huang HD, Chang CC, Chang YS, Yen JC, Lee CC, Chang WH, Liu TC, Chang JG. Long noncoding RNA TUG1 is downregulated in non-small cell lung cancer and can regulate CELF1 on binding to PRC2. BMC Cancer. 2016; 16:583.
13. Li J, Zhang M, An G, Ma Q. LncRNA TUG1 acts as a tumor suppressor in human glioma by promoting cell apoptosis. Exp Biol Med (Maywood). 2016; 241:644–9.
14. Droop J, Szarvas T, Schulz WA, Niedworok C, Niegisch G, Scheckenbach K, Hoffmann MJ. Diagnostic and prognostic value of long noncoding RNAs as biomarkers in urothelial carcinoma. PLoS One. 2017; 12:e0176287.
15. Tan J, Qiu K, Li M, Liang Y. Double-negative feedback loop between long non-coding RNA TUG1 and miR-145 promotes epithelial to mesenchymal transition and radioresistance in human bladder cancer cells. FEBS Lett. 2015; 589:3175–81.
16. Jiang L, Wang W, Li G, Sun C, Ren Z, Sheng H, Gao H, Wang C, Yu H. High TUG1 expression is associated with chemotherapy resistance and poor prognosis in esophageal squamous cell carcinoma. Cancer Chemother Pharmacol. 2016; 78:333–39.
17. Iliev R, Kleinova R, Juracek J, Dolezel J, Ozanova Z, Fedorko M, Pacik D, Svoboda M, Stanik M, Slaby O. Overexpression of long non-coding RNA TUG1 predicts poor prognosis and promotes cancer cell proliferation and migration in high-grade muscle-invasive bladder cancer. Tumour Biol. 2016; 37:13385–90.
18. Ma B, Li M, Zhang L, Huang M, Lei JB, Fu GH, Liu CX, Lai QW, Chen QQ, Wang YL. Upregulation of long non-coding RNA TUG1 correlates with poor prognosis and disease status in osteosarcoma. Tumour Biol. 2016; 37:4445–55.
19. Zhang E, He X, Yin D, Han L, Qiu M, Xu T, Xia R, Xu L, Yin R, De W. Increased expression of long noncoding RNA TUG1 predicts a poor prognosis of gastric cancer and regulates cell proliferation by epigenetically silencing of p57. Cell Death Dis. 2016; 7:e2109.
20. Wang PQ, Wu YX, Zhong XD, Liu B, Qiao G. Prognostic significance of overexpressed long non-coding RNA TUG1 in patients with clear cell renal cell carcinoma. Eur Rev Med Pharmacol Sci. 2017; 21:82–86.
21. Zhuo W, Kang Y. Lnc-ing ROR1-HER3 and Hippo signalling in metastasis. Nat Cell Biol. 2017; 19:81–3.
22. Qian Y, Liu D, Cao S, Tao Y, Wei D, Li W, Li G, Pan X, Lei D. Upregulation of the long noncoding RNA UCA1 affects the proliferation, invasion, and survival of hypopharyngeal carcinoma. Mol Cancer. 2017; 16:68.
23. Ren K, Li Z, Li Y, Zhang W, Han X. Long non-coding RNA taurine-upregulated gene 1 promotes cell proliferation and invasion in gastric cancer via negatively modulating miRNA-145-5p. Oncol Res. 2017; 25:789–98.
24. Qin CF, Zhao FL. Long non-coding RNA TUG1 can promote proliferation and migration of pancreatic cancer via EMT pathway. Eur Rev Med Pharmacol Sci. 2017; 21:2377–84.
25. Yu XH, Guo W, Zhang J, Ma C, Chu AJ, Wen BL, Zhang X, Yan XY, Wu CM, Wang DM, Qu YL. Long non-codingRNA (lncRNA) TUG1 and the prognosis of cancer: a meta-analysis. Cell Mol Biol. 2017; 63:36–39.
26. Liu J, Lin J, Li Y, Zhang Y, Chen X. Prognostic role of lncRNA TUG1 for cancer outcome: evidence from 840 cancer patients. Oncotarget. 2017; 8:50051–60. https://doi.org/10.18632/oncotarget.17844.
27. Yang F, Wang LH, Zhu RF. Prognostic value of long noncoding RNA TUG1 in human cancers. Minerva Med. 2017; 108:101–2.
28. Li N, Yang M, Shi K, Li W. Prognostic value of decreased long non-coding RNA TUSC7 expression in some solid tumors: a systematic review and meta-analysis. Oncotarget. 2017; 8:59518–59526. https://doi.org/10.18632/oncotarget.18496.
29. Xiao J, Zou Y, Chen X, Gao Y, Xie M, Lu X, Li W, He B, He S, You S, Chen Q. The Prognostic Value of Decreased LKB1 in Solid Tumors: A Meta-Analysis. PLoS One. 2016; 11:e0152674.