
Introduction
Cholangiocarcinoma (CCA), the second most common malignancy in the liver after hepatocellular carcinoma, originates from the epithelial lining of biliary tract [1-3] with increasing incidence and mortality recently [1-5]. Intrahepatic cholangiocarcinoma (ICC) originates from the small bile ducts within the liver. The survival of ICC is very poor in general and only surgical resection can provide a cure in the case of early stage of disease [6-8], which is rare due to the lack of early diagnostic methods. For unresectable ICC [9], the prognosis is dismal with the average survival of less than one year [10], attributable to the resistance to traditional chemotherapy and radiotherapy, Recently, target therapy has been shown to have potential being a promising strategy against CCA[11, 12]. Collectively, clinicians face a stalemate to deal with patients with advanced ICC. New therapeutic strategies to deal with ICC are indeed urgently needed.
Vitamin D, originally known to modulate calcium absorption and bone metabolism for nearly a century, is now shown to have potent antiproliferation, antiangiogenesis, anti-inflammation, pro-apoptosis, pro-differentiation, and immune-regulation in many cells through a cell- and tissue-specific manner [13-18]. Moreover, evidence associating vitamin D deficiency, defined as serum 25(OH)D concentration less than 20 ng/ml in human, with the increased incidence of prostate, colon and breast cancers in a number of ecological and epidemiological studies has been well documented [19-22], although some studies have questioned their association[23]. Vitamin D exerts its transcriptional regulation through binding to vitamin D receptor (VDR), which forms a hetorodimer with retinoid X receptor (RXR), and binds to vitamin D response element (VDRE) located in the promoter region of vitamin D responsive genes to transactive gene expression [24, 25]. Since VDR is present in almost all tissues studied, the application of vitamin D as a new generation of tumor preventive and therapeutic agents is plausible.
Regarding CCA, 1α,25(OH)2D, the active form of vitamin D, has been shown to inhibit CCA cell growth in vitro [26], and dysregulation of the local conversion of 25-hydroxyvitamin D to 1,25-dihydroxyvitamin D, the hormonal form of vitamin D, may lead to enhanced CCA [27]. Moreover, VDR expression has been demonstrated in cultured CCA cell lines and CCA tissues, in which high levels of expression were associated with good prognosis of CCA [26]. These findings suggest that vitamin D deserves further investigation against CCA. So far, no study concerning the application of dietary vitamin D supplementation against CCA in vivo has been published.
Previously we have established a thioacetamide (TAA)-induced rat ICC model [28], in which the tumors can be induced after feeding rats with TAA-containing water for 20 weeks. The model successfully recapitulates human ICC progression histologically. Furthermore, the tumor growth can be easily evaluated by a micro PET for small animals [29]. In this report, we investigated the effect of vitamin D supplementation with 2 IU/g and 6 IU/g vitamin D3 (cholecalciferol) on ICC via the TAA-induced ICC animal model. The potential underlying mechanisms were evaluated through cDNA microarray analysis and the possibly responsible gene was further verified in human ICC specimen and human ICC cell lines.
Results
Measurement of body weight, serum calcium and 25(OH)D levels of rats
As described in the diagram shown in Fig. 1a, animals were divided into three groups (N=7 per group) and fed with a diet supplemented with no vitamin D3, 2 IU/g of vitamin D3, or 6 IU/g of vitamin D3 and kept from exposure to ultraviolet radiation b (UVB) to prevent endogenous vitamin D synthesis. Drinking water was replaced with water containing 0.03% TAA beginning in week 8.
The measurements of body weight, serum calcium and serum 25(OH)D were performed in week 1, 4, 6, 11, 17, 23, 26, and 31 for diets added with no vitamin D3 (-D), 2 IU/g (+2D) and 6 IU/g (+6D) vitamin D3 groups. No significant difference in body weight was observed among the three groups (Fig. 1b). All animals gained weight quickly until they drank TAA-containing water, and the increase of their body weight became more gradual afterward (Fig. 1b). Similarly, serum calcium stayed relatively unchanged and no significant difference was observed among the three groups during the entire study period (Fig. 1c). However, the serum 25(OH)D levels varied depending on the vitamin D3 amount in the diets (Fig. 1d). It increased from 40±3 to 60-70 nmol/L by week 4 and stayed in this range in the +6D group, whereas it remained relatively constant at about 43±3 nmol/L in the +2D group, and gradually declined from 40±3 to 26±4 nmol/L in the -D group.
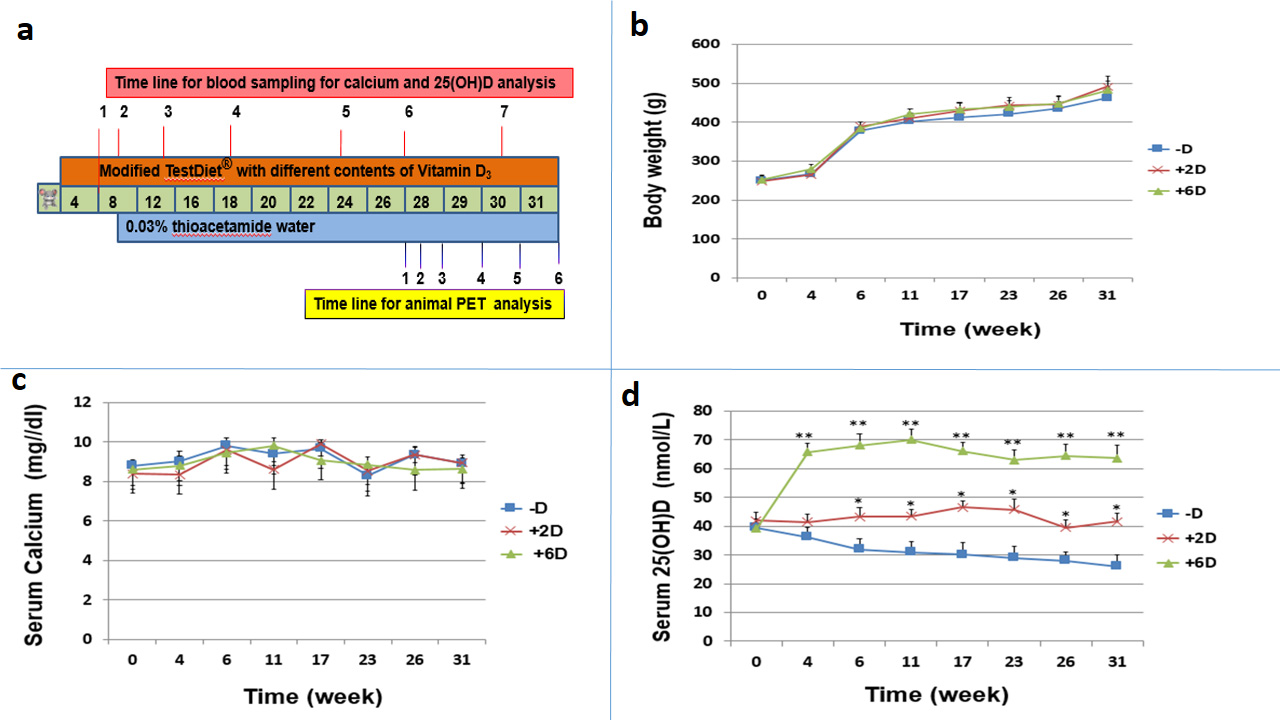
Figure 1: Animal study protocol and Measurement of body weight, serum calcium, and serum 25(OH)D concentration of rats during the study period. a. Animal study protocols and measurements of biomarkers b.Animals (N=7 per group) were fed with a diet containing either no vitamin D (-D), 2 IU/g vitamin D3 (+2D), or 6 IU/g vitamin D3 (+6D). Rats in three groups all gained body weight increase stably and no significant difference was observed among the 3 groups. c. No significant difference was observed among the 3 groups regarding serum calcium concentration. d. The serum 25(OH)D level varied significantly in each group in accordance with the vitamin D supplementation amount. Each points is the mean±SD of 7 animals. *p<0.05, **p<0.01.
Evaluation of tumor initiation and progression by position emission tomography (PET) scanning
Previously, we have shown that ICC can be induced in rats after drinking water containing 0.03% TAA for 20 weeks with a highly successful rate [28]. Weekly PET scan began in the 20th week after the initiation of TAA treatment. Figure 2a compares 2-deoxy-2-[F-18]fluro-D-glucose (FDG) images taken consecutively (1st to 6th scan) for 6 weeks between the -D and +6D groups. The scanning results from the 3 groups are summarized in Figure 2b. In the 1st scan, no rat bearing tumors was detected in the +6D group, while 2 and 4 rats were found bearing tumors in the +2D and -D groups, respectively. In the 5th and 6th scans, the +6D group had 3 rats with tumors, and +2D and -D groups each had 6 animals with tumors. Due to the limitation of micro PET to detect tumor with size < 2 mm and the indistinguishable border between normal tissues and invasive CCA, the standard tracer uptake value ratio (SUVR, tumor to liver) was obtained to represent tumor growth [29]. As shown in Figure 2c, the -D group had the highest SUVR in the 1st scan which increased gradually in the following scans during the study. The +2D group also showed increased SUVR but with a lower magnitude than the -D group. However, the SUVR for the +6D group stayed relatively unchanged and was significantly lower than the -D group in the 5th and 6th scans.
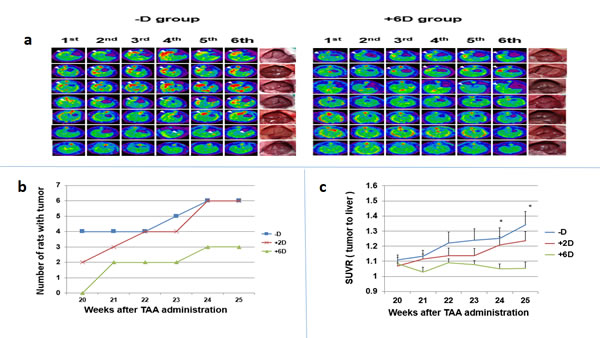
Figure 2: Evaluation of tumor occurrence and progression by micro animal PET. a.The 6 times of PET images taken from rats in -D (left panel) and +6D (right panel) groups. The white arrows indicated the tumor with highest FDG uptake. The gross view of liver of each rat is shown in the right side. b.The number of rats bearing PET-detectable tumors. c. Due to the limitation of micro PET to detect tumor with size < 2 mm and the indistinguishable border between normal tissues and invasive CCA, the standard tracer uptake value ratio (SUVR, tumor to liver)was obtained to represent tumor growth.The SUVR, tumor to liver, was calculated from micro PET scan. Each points is the mean±SD of 7 animals. *p<0.05, **p<0.01
Genome-wide gene expression profile analysis for rat ICC tissues from –D, +2D and +6D animals
The potential mechanism involved in the vitamin D-dependent anti-ICC actions was investigated by microarray analyses using Rat OneArray® v1 to compare the gene expression profiles in tumors from these three groups of rats. As shown in Fig. 3a and 3b, vitamin D supplementation did induce indistinct gene expression profiles in vivo. (The methods and data analysis for microarray were described in the supplementary materials section). Among the downregulated genes, Lcn2 was found to be the most suppressed by vitamin D supplementation with a 38% and 50% reduction in expression, respectively, in the tumors from +2D and +6D rats compared to the -D rats (Table 1a and Supplemental Fig.S-1).
Table 1a. Genes affected by vitamin D supplementation
Probe set ID |
Gene name |
Vitamin D supplementation |
||
-D |
+2D |
+6D |
||
Up regulated |
||||
PH_rn_0012953 |
Arsj |
0.25 |
0.77 |
1.35 |
PH_rn_0020767 |
Ces1d |
0.41 |
0.81 |
0.81 |
PH_rn_0003591 |
Havcr1 |
0.63 |
1.08 |
1.15 |
PH_rn_0001350 |
Ccdc144b |
0.27 |
0.45 |
0.62 |
PH_rn_0003985 |
Gucy1b2 |
0.34 |
0.80 |
1.31 |
PH_rn_0003024 |
Aldh1l1 |
0.52 |
0.82 |
1.30 |
PH_rn_0022686 |
NA |
0.80 |
1.59 |
2.72 |
PH_rn_0014388 |
LOC287167 |
0.23 |
1.15 |
1.42 |
PH_rn_0014705 |
Tnfsf4 |
0.63 |
1.10 |
1.29 |
PH_rn_0009406 |
Pipox |
0.53 |
0.87 |
1.58 |
PH_rn_0010923 |
Cyp7a1 |
0.35 |
0.82 |
1.64 |
PH_rn_0014336 |
LOC305806 |
0.58 |
1.06 |
2.26 |
PH_rn_0004153 |
Trim54 |
0.59 |
0.98 |
1.31 |
PH_rn_0003819 |
Nr1i3 |
0.63 |
1.21 |
2.27 |
PH_rn_0016772 |
Rergl |
0.67 |
1.16 |
1.80 |
PH_rn_0022202 |
LOC100360253|LOC100364984 |
0.83 |
1.47 |
1.88 |
PH_rn_0002165 |
Cyp2c11 |
0.17 |
0.95 |
1.66 |
PH_rn_0008613 |
Sdr16c6 |
0.52 |
0.89 |
1.98 |
PH_rn_0018922 |
Gkn3 |
0.95 |
1.34 |
2.01 |
PH_rn_0022007 |
Wisp3 |
0.71 |
1.31 |
1.93 |
PH_rn_0001170 |
LOC100360120 |
0.26 |
0.46 |
0.62 |
Down regulated |
||||
PH_rn_0020605 |
Abcc1 |
1.61 |
1.06 |
0.77 |
PH_rn_0016277 |
LOC686596 |
0.60 |
0.71 |
0.57 |
PH_rn_0001393 |
Cd207 |
1.66 |
1.13 |
0.44 |
PH_rn_0001576 |
Stra8 |
0.47 |
0.38 |
0.20 |
PH_rn_0007276 |
Spink4 |
2.09 |
1.22 |
1.07 |
PH_rn_0003053 |
Pdpk1 |
1.63 |
0.97 |
0.63 |
PH_rn_0020801 |
RGD1565486 |
1.55 |
0.84 |
0.63 |
PH_rn_0010729 |
Ereg |
1.31 |
1.06 |
0.82 |
PH_rn_0010578 |
Lcn2 |
1.72 |
0.87 |
0.33 |
PH_rn_0002779 |
Slc26a3 |
1.90 |
1.05 |
1.02 |
PH_rn_0008583 |
Fkbp5 |
1.72 |
0.84 |
0.66 |
PH_rn_0015419 |
Taar9 |
0.95 |
0.42 |
0.29 |
PH_rn_0002499 |
LOC681122 |
0.34 |
0.33 |
0.20 |
PH_rn_0008827 |
Cnnm1 |
0.34 |
0.20 |
0.16 |
PH_rn_0004742 |
B3gat2 |
0.21 |
0.18 |
0.15 |
PH_rn_0009834 |
Cts7 |
0.87 |
0.51 |
0.20 |
Table 1b: Pathways affected by vitamin D supplementation
Signal Pathway |
odds radio (loge) |
p value |
Adjusted p value |
|
Up regulated |
||||
Metabolism of xenobiotics by P450 |
2.58 |
<0.0001 |
<0.0001 |
|
Drug metabolism - P450 |
2.87 |
<0.0001 |
<0.0001 |
|
Metabolic pathways |
1.20 |
<0.0001 |
<0.0001 |
|
Primary bile acid biosynthesis |
3.39 |
<0.0001 |
<0.0001 |
|
PPAR signaling pathway |
2.53 |
<0.0001 |
<0.0001 |
|
Glycosphingolipid biosynthesis |
2.85 |
0.0017 |
0.0192 |
|
Retinol metabolism |
2.97 |
<0.0001 |
<0.0001 |
|
Linoleic acid metabolism |
3.33 |
<0.0001 |
<0.0001 |
|
Drug metabolism |
2.36 |
<0.0001 |
0.0003 |
|
Arachidonic acid metabolism |
2.40 |
<0.0001 |
<0.0001 |
|
Down regulated |
||||
Retinol metabolism |
1.90 |
0.0005 |
0.0265 |
|
ABC transporters |
2.19 |
0.0005 |
0.0265 |
|
Biosynthesis of unsaturated fatty acids |
2.21 |
0.0017 |
0.0449 |
|
Tyrosine metabolism |
2.38 |
0.0002 |
0.0265 |
|
Focal adhesion |
1.33 |
0.0011 |
0.0337 |
|
Taste transduction |
1.83 |
0.0020 |
0.0470 |
|
mTOR signaling pathway |
2.15 |
0.0006 |
0.0265 |
|
Glycosaminoglycan biosynthesis |
3.02 |
0.0010 |
0.0337 |
|
Verification of Lcn2 expression in rat ICC tissues and LCN2 expression in human ICC tissues
The downregulation of Lcn2 expression by vitamin D supplementation in vivo as indicated by microarray were confirmed by RT-qPCR (Fig. 3c) and IHC staining (Fig. 3d and 3e), which showed that both of Lcn2 mRNA and protein expressions were significantly reduced in ICC tumors from +6D group compared to those from -D group. We further examined 80 human ICC tissues and found that 53 (66%) specimens exhibited high LCN2 expression compared to the non-tumorous bile ducts (Supplemental Fig S-2).
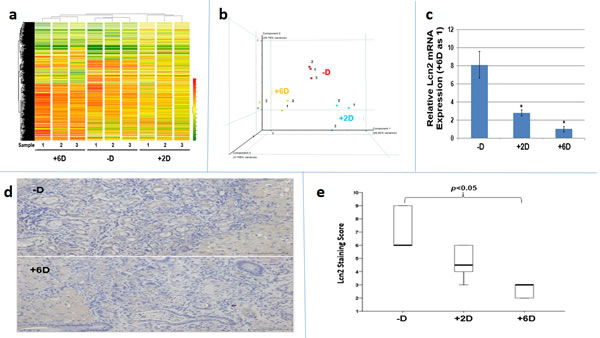
Figure 3: Analyses of tumor tissues obtained from -D, +2D and +6D groups of rats by microarray, qRT/PCR and immunohistochemistry (IHC) staining. a. Molecular portrait of gene expression profile in rat ICC (-D, +2 IU and +6D groups). Hierarchical clustering illustrates 1,633 gene expression patterns. The results are shown in a diagram format, in which rows represent individual transcripts and columns represent data from 3 different animals in each group. The color in each cell reflected the expression level of the corresponding sample, relative to its mean expression level. The result indicated each group has indistinct gene expression profiles and the similar gene expression profile is observed within the group. b Principal components analysis (PCA) of vitamin D responsive gene expression profiles. The gene expression in each group was analyzed by PCA method. The individual point from -D, +2D and +6D group was marked in red, blue, and orange, respectively. c. Lcn2 mRNA expression in tumor tissues. Comparison of Lcn2 mRNA expression by RT-qPCR among tumors from -D, +2D and +6 D animals. *p<0.05 d. LCN2 expression in tumor tissues. Comparison of Lcn2 expression by IHC staining between the tumors from -D and +6D animals. e. Quantitative analysis of tumor tissue by IHC staining. Box plots analysis was used to compare the LCN2 IHC staining among tumors from -D, +2D and +6D animals. The LCN2 expression in –D and +6D group is significantly different.
Evaluation of the expression of VDR, and antiproliferative effect of 1α, 25(OH)2D3 on Human ICC cell line, SNU 1079
We utilized a human ICC cell line, SNU1079, a VDR-expressing cell lines (Fig 4a), to investigate whether this cell line was responsive to the antiproliferative effect of 1α,25(OH)2D3. As shown in Figure 4b, 1α,25(OH)2D3 significantly inhibited SNU1079 cell growth in a dose-dependent manner at the concentrations from 10-10 to 10-6 M after 4 days of treatment.
Evaluation of the effect of 1α, 25(OH)2D3 on LCN2 expression in SNU1079 cells
We next investigated whether human LCN2 expression was regulated by 1α,25(OH)2D3 and whether the effect was mediated through VDR in SNU1079 cells. Using RT-qPCR and western blot analyses, we found that 1α,25(OH)2D3 caused a dose-dependent downregulation of LCN2 mRNA and protein expression in SNU1079 cells with dramatic upregulation of CYP24 mRNA expression, the most inducible gene expression by 1α,25(OH)2D3 (Fig. 4c and 4d). Furthermore, we showed that VDR knockdown by shRNA blunted the 1α,25(OH)2D3-dependent LCN2 mRNA downregulation (Fig. 4e). Given that the added FBS in cell culture medium contained some amount of 1α,25(OH)2D3, the higher LCN2 expression in SNU-VDRsi cells than that of SNU-COLsi cells also indicated the downregulation of LCN2 by 1α,25(OH)2D3 is VDR-mediated ( Fig 4e ).Consequently, we concluded that LCN2 expression is regulated by 1α,25(OH)2D3 and is mediated through VDR in SNU1079 cells.
Evaluation LCN2 effect on cell growth and migration of SNU308 cells
To further determine LCN2 effect on human CCA cells, we knockdowned LCN2 in another CCA cell line, SNU308, and obtained SNU-COLsi cells (mock knockdown SNU308 cells) and SNU-NGALsi cells (LCN2 knockdwon SNU308 cells)(Figure S-3). The cell doubling time was calculated by two time points of cell number. The cell doubling time was increased to 30.45 hours from 23.6 hours and the migration ability is significantly repressed in SNU308 cells after LCN2 knockdown (Fig 4f).
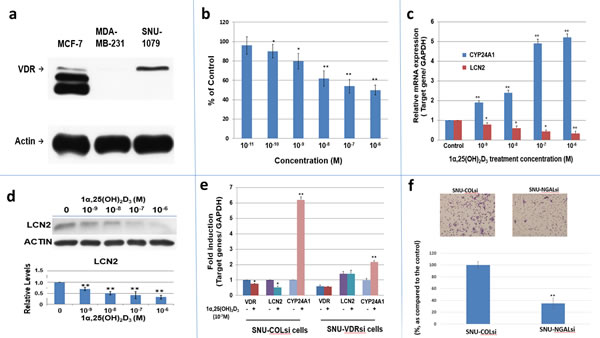
Figure 4: The expression of VDR, LCN2 mRNA and protein in SNU1079 human ICC cells and evaluation of 1α,25(OH)2D3 effect on SNU1079 cells a. Western blot of VDR in SNU1079 cells. VDR expression in SNU1079 cells. MCF-7 cells and MDA-MB-231 cells were used as a positive and negative control, respectively. b. Dose-dependent inhibition of SNU1079 cell proliferation by 1α,25(OH)2D3.1α,25(OH)2D3, from 10-6M to 10-10M, repressed SNU1079 cell proliferation dose dependently. Each point represents the mean ± SD of 3 wells from a single experiment. *p<0.05, **p<0.01 c. A dose-dependent downregulation of LCN2 mRNA expression by 1α,25(OH)2D3.Treatment of 10-6 to 10-9M1α,25(OH)2D3 repressed LCN2 mRNA expression in SNU1079 cells dose dependently. CYP24A1 was used as the positive control. *p<0.05, **p<0.01 d. A dose-dependent downregulation of LCN2 expression by 1α,25(OH)2 D3.Treatment of 10-6 to 10-9 M1α,25(OH)2D3 repressed LCN2 expression in SNU1079 cells dose dependently. ( 60 μg protein was loaded in each well and actin was applied as an internal control ) Data are presented as the fold change (mean ± SE of three independent experiments) of the protein levels in relation to the control group. *p<0.05, **p<0.01 e. The consequence of VDR knockdown on the 1α,25(OH)2 D3 -induced LCN2 mRNA expression. SNU-1079 cells were transduced with control non-target shRNAlentiviral particles (SNU-COLsi) or VDR shRNAlentiviral particles (SNU-VDRsi) for 96 hours and then were treated with 10-7 M of 1α,25(OH)2D3or control ethanol vehicle for another 24 hours. The LCN2, CYP24A1, and VDR mRNA levels were determined by RT-qPCR. CYP24A1 was used as a positive control. The mRNA level of control group was set as 1. Data are presented as the fold change (mean ± SE of three independent experiments) of the mRNA levels in relation to the control group. *p<0.05, **p<0.01 f.The consequence of LCN2 knockdown on SNU308 cell migration Cell migration of SNU-COLsi cells (mock knockdown SNU308 cells) and SNU-NGALsi cells ( LCN2 knockdown SNU308 cells) was measured by using non-matrigel-coated membrane as described in the Materials and Methods. The number of migrating cells was digitally photographed and counted under the microscope (IX71, Olympus, Tokyo, Japan). Experiments were performed in triplicate and repeated at least three times. (* P<0.05, ** P<0.01)
Discussion
CCA is a devastating disease with increasing incidence and mortality in recent years and with very few therapeutic options [3-5]. Since the active form of vitamin D, 1α,25(OH)2D3 or calcitriol, has been well demonstrated to be a pleiotropic hormone with a variety of anti-tumor actions [17, 30], combined with the fact that vitamin D deficiency has been associated with a number of cancers incidence [22], we thus investigated whether vitamin D supplementation could benefit the prevention of ICC initiation and progression under the bleak background of ICC treatment. Using microarray approach, a recent publication reported that vitamin D supplementation to normal subjects can affect many cancer related genes [31], supporting the epidemiological findings that vitamin D-deficiency may be associated with many forms of cancer [22], and also suggests the importance of adequate vitamin D nutrition in preventing cancers. Because of the concern about the UV-induced skin cancers, humans have not generated sufficient vitamin D from sunlight exposure and increasingly depend on the dietary supplementation. However, how much vitamin D do we really need to prevent cancers is still unknown [32].
In this study, we showed that the rat serum 25(OH)D level, the best index of vitamin D status, changed with time depending on the contents of vitamin D in their diets (Fig. 1d). As shown, supplementation with 6 IU/g vitamin D3 increased the serum 25(OH)D to a much higher level (about 50% increase), whereas there was a gradual decline to vitamin D-deficient state in the -D animals. There was no significant changes in serum 25(OH)D in the +2D group fed with 2 IU/g vitamin D3 diet. In spite of differences in serum 25(OH)D levels among the three groups, there was no significant difference in their body weight and serum calcium over the course of study (Fig. 1b and 1c). This observation, showing no adverse effects on body weight and serum calcium, indeed indicates that supplementation with 6 IU/g of vitamin D3 did not cause unwanted side-effects even though they had serum 25(OH)D higher than the normal range [33]. Furthermore, the lack of increase in serum calcium in 6 IU/g group demonstrates that any anti-ICC effects observed in this group are most likely a direct consequence of vitamin D supplementation, and not a secondary effect attributable to calcium [34, 35].
Our data, for the first time, clearly showed an anti-ICC initiation and progression (Fig. 2a, b and c) by supplementing animals with 6 IU/g of vitamin D3 which also raised their serum 25(OH)D level to between 60 and 70 nmol/L (Fig. 1d) in this TAA-induced rat ICC model. The tumor incidence and tumor progression in –D and +2D groups are similar (Fig 2b&c), whereas +6D group has significantly lower tumor incidence and progression as compared to –D group (Fig. 2a, b, &c). Since the vitamin D content in the regular rat chows which contain 2.2 IU/g vitamin D [33] is comparable to our special 2 IU/g diet, apparently, the normal level of vitamin D in the diet or normal circulating level [33] of 25(OH)D may not be sufficient for preventing ICC tumor initiation and progression (Fig. 2a, b, &c). This finding is consistent with a prevailing view that a higher level of dietary reference intakes (DRI) than what is needed for bone health [36] may be required for the prevention of cancers and other chronic diseases[22, 32, 37].
Functional genomic analyses will probably have multiple implications for candidate drug discovery against targeted genes. At the present time, 408 upregulated and 230 downregulated genes have been identified as potential vitamin D targets by the use of chromatin immune-precipitation DNA sequencing (ChiP-seq) analysis [38]. Thus, to further understand the underlying mechanisms whereby vitamin D exerts its chemopreventive and chemotherapeutic effects on ICC, cDNA microarray was conducted. By using the Rat OneArray® which covers 24,358 well-substantiated rat transcripts, we performed the genome-wide mRNA microarray on ICC tumors from each of the three groups under study. The arrays demonstrate a unique expression profile pattern for the triplicate samples from each group (Fig. 3a & b), indicating different vitamin D supplementations did change the gene expression profile. After a series of bioinformatical analyses [39] (Please reference the supplemental material and method) , we identified 21 and 16 genes which were significantly upregulated and downregulated, respectively, in response to vitamin D3 supplementation (Table 1a). Signal pathway analysis showed the vitamin D-upregulated pathways are mainly involved in fatty acid, bile acid, vitamin A and drug metabolic pathways, whereas the vitamin D-downregulated pathways include those responsible for mTOR signaling pathway, glycosaminoglycan biosynthesis, adhesion, tyrosine, vitamin A and fatty acid metabolic pathways (Table 1b).These genes or pathways might be used as targets for finding novel drug for cholangiocarcinoma treatment, and be used in clinical diagnosis in the future studies.
Among the downregulated genes found in our microarray analysis, LCN2 was found to be the most suppressed by vitamin D supplementation. The results of IHC staining and RT-qPCR of TAA-induced rat ICC tissues confirmed the microarray data (Fig 3c,d,&e). LCN2, a member of lipocalin family that transports small, hydrophobic ligands, is a 25-kDa glycoprotein originally isolated from human neutrophils, therefore, it is commonly known as neutrophil gelatinase-associated lipocalin (NGAL) [40]. The protein is also known as neu-related lipocalin, aka SIP24, oncogene 24p3, uterocalin and siderocalin [40]. It is expressed in several normal tissues where its roles are mainly to protect against bacterial infection and oxidative stress [41]. LCN2 expression is dysregulated in some benign and malignant diseases, and has been shown to play multifaceted roles in cancer in a cell lineage specific manner [42]. In malignant cells, its functions may include inhibiting apoptosis, promoting invasion and angiogenesis, and increasing proliferation and metastasis. The levels of LCN2 have also been shown to be elevated by several orders of magnitude during injury, infection and malignancy, indicating a role it may play in tumor development [41, 42].
Regarding cholangiocarcinoma (CCA), a study reported that LCN2 expression was detected in the CCA cell line, HuCCA-1, but not in 4 hepatocellular carcinoma cell lines, HepG2, HCC-S102, SK-Hep-1, and Alexander, suggesting the expression might be specific to CCA [43]. It has also been found that serum LCN2 levels were significantly elevated in ICC patients compared to those with benign biliary tract disease [44]. In a separate study, no significant differences were found in sera between malignant and benign biliary patients, whereas elevated LCN2 levels were detected in bile collected from the ICC patients [45]. Moreover, the roles of LCN2 in ICC have been studied by knocking down LCN2 with siRNA that resulted in a significant reduction in invasiveness, migration and pro-MMP-9 activity of ICC cells [46].
To further verify LCN2 role in human ICC, we examined 80 human ICC specimen and 66% of human ICC specimen presented with high expression LCN2, adding the finding that knockdown of LCN2 in SNU308 cells decreased cell growth and migration (Fig 4f), indicating the LCN2 plays as an oncogene in human ICC. In addition, as application of 1α,25(OH)2D3 to treat human ICC SNU1079 cells, which express VDR ( Fig. 4a ), a dose dependent antiproliferation and downregulation of LCN2 mRNA and protein expressions was observed (Fig.4b,c,&d). Of note, as most cancer cells respond to 10-8M 1α,25(OH)2D3 [17], 10-10M 1α,25(OH)2D3 significantly inhibited SNU1079 cell growth (Fig 4b), implicating the much more sensitivity of SNU1079 cells to 1α,25(OH)2D3 as compared to other cancer cells. Since 1α,25(OH)2D3 exerts its genomic function through binding with VDR, we next knocked down VDR in SNU1079 cells and the inhibition of LCN2 expression by 1α,25(OH)2D3 was attenuated ( Fig. 4e ), indicating this effect of 1α,25(OH)2D3 is VDR-dependent, which is also supported by the finding that the SNU-VDRsi cells presented with higher LCN2 expression as compared to that of SNU-COLsi cells since the added FBS in cell culture medium contained some amount of 1 α,25(OH)2D3 ( Fig 4e ). These finding further suggested that the in vivo downregulation of LCN2 in this current animal model is the direct consequence of vitamin D supplementation.
Collectively, we concluded that LCN2 is an oncogene in human ICC and its expression is repressed by 1α,25(OH)2D3 VDR-dependently. Thus, the downregulation of Lcn2 in rats ICC tissues is supposed to be a direct sequence by vitamin D supplementation, leading to the observed in vivo anti-ICC tumorgenesis. Our present results are consistent with previous studies suggesting that 1α,25(OH)2D3 and its analogs are able to inhibit ICC tumor growth in vitro and in vivo [47-49].
In summary, we demonstrated in this report that vitamin D in a form of dietary supplementation can prevent and suppress ICC tumorigenesis and progression with downregulation of LCN2 in an animal model without inducing hypercalcemia. Furthermore, the results showing that the high expression of LCN2 in human ICC specimen, the decreased proliferation and migration of SNU308 cells after LCN2 knockdown, and the 1α,25(OH)2D3-induced antiproliferative effect and VDR-dependent downregulation of LCN2 in SNU1079 cells, strongly suggest LCN2 may be a new target against human CCA. Thus, based on our results, we concluded that maintaining adequate vitamin D status has the potential to be an inexpensive and effective approach against ICC. Further investigations to determine the optimal amounts of vitamin D supplementation required for cancer prevention and the application of vitamin D and its D analogs for the treatment of ICC are warranted.
Materials and Methods
Induction of intrahepatic cholangiocarcinoma (ICC) in rats
Male Sprague-Dawley (SD) rats weighting 250 ± 14 g were obtained from BioLasco Taiwan Co., Ltd (Taipei, Taiwan). Animals were divided into three groups (N=7 per group) and fed with a diet supplemented with no vitamin D3 (cat. # 5A0E), 2 IU/g of vitamin D3 (cat.# 5A0G), or 6 IU/g of vitamin D3 (cat. # 5A0J) obtained from TestDiet (Richmond, IN, USA). Animals were housed in an animal room with a 12-hour incandescence light and dark cycle at an ambient temperature of 22oC with food and water available ad libitum, and avoid of any natural sunlight and fluorescence lighting during the course of study. The animal protocol was approved by the Experimental Animal Ethics Committee of Chang Gung Memorial Hospital (Approval: IACUC 2011081901) Beginning in week 8, drinking water was replaced with water containing 0.03% TAA.
Measurements of body weight, serum calcium and serum 25-hydroxyvitamin D [25(OH)D]
Measurement of body weight and blood drawing for calcium and 25(OH)D analyses were taken upon the arrival of animals and in week 4, 6, 11, 17, 23, 26, and 31. Serum calcium and serum 25(OH)D were analyzed using kits obtained from Stanbio Laboratory (CALCIUM LIQUICOLOR® (ARSENAZO) (#0155-225, Stanbio Laboratory, TX, USA)) and from DiaSorin (25-Hydroxyvitamin D 125I RIA kit (#68100E, DiaSorin, MN, USA)), respectively. The calcium kit has intra- and inter-assay coefficient of variation of 0.7 and 0.9%, respectively. The 25(OH)D assay kit has intra- and inter-assay cv of 8.2 and 10.5%, respectively. The limit of detection is 1.5 ng/ml for 25(OH)D and 1mg/dl for calcium.
Detection of TAA-induced ICC tumors by position emission tomography (PET) and histopathological evaluation of the liver
The detection of ICC tumors was accomplished by injecting 2-deoxy-2-[F-18]fluoro-D-glucose (FDG) 90 minutes prior to PET scan which was performed on an InveonTM system (Siemens Medical Solutions, Inc. USA) located in the Molecular Image Center of Chang Gung Memorial Hospital as described previously [29]. Scan was carried out once a week for six consecutive weeks beginning in the 20th week after the addition of TAA into the drinking water. Quantification of 18F-FDG uptakes in the biggest liver tumor and normal liver tissue was performed by calculating the standardized uptake value (SUV) as previously described [29].
Microarray analysis of ICC
Three TAA induced cholangiocarcinoma samples from each group of rats fed with a diet supplemented with no vitamin D, 2 IU/g vitamin D3 or 6 IU/g vitamin D3 were used for microarray analysis. Rat OneArray® v1 (Phalanx Biotech Group, Hsinchu, Taiwan) was chosen for its reproducibility in examining the quantitative and qualitative expression of most genes in the rat genome. Following a quantitative scan of a chip, the images were transformed to text files containing intensity information by Phalanx® and the microarray data were analyzed by using the GeneSpring® GX 7.3.1 Software (Agilent Technologies, Santa Clara, CA, USA). The further descriptions were shown in supplementary materials.
Immunohistochemical staining (IHC) of rat and human ICC tissues for LCN2
Human ICC tumors were obtained from patients admitted to the Chang Gung Memorial Hospital. The protocol was approved by the IRB of the Chang Gung Memorial Hospital (Approval: IRB 99-2886B). The detailed procedures were dercribed in the supplemental material section.
Cell culture
SNU1079 cells and SNU308 cells were obtained from Korean Cell Line Bank (KCLB: 28 Yongon-dong, Chongno-gu, Seoul 110-744, Korea). Cells were grown on RPMI 1640 medium supplemented with 10% FBS and 1% antibiotic-antimycotic agents. Culture medium was changed 3 times per week.
Knockdown of VDR and real-time qPCR of LCN2 expression in Human ICC SNU1079 cells
SNU1079 cells were transduced with control non-target shRNA lentiviral particles (SI-SHC002V, Sigma, MO, USA) or vitamin D receptor (VDR) shRNA lentiviral particles (SI-NM_000376.1-578s1, Sigma). Four days after transduction, the cells (SNU-COLsi and SNU-VDRsi) were treated with 10-7 M of 1α,25(OH)2D3 or control vehicle for 24 hours. Total RNA was isolated using the Trizol reagent, and cDNA was synthesized using the Superscript III preamplification system (Invitrogen). FAM dye-labeled TaqMan MGB probes and PCR primers for human LCN2 (HS00194353-m1), CYP24A1 (HS00167999-m1), and VDR (HS01045844-m1) were purchased from Applied Biosystems. For the internal positive control, GAPDH (HS99999905-m1) was used with a FAM reporter dye-labeled TaqMan MGB probe. Mean cycle threshold (Ct) values for LCN2, CYP24A1, and VDR were normalized against the GAPDH control probe to calculate ∆Ct values using StepOne software v2.0 (Applied Biosystems).
Knockdown of LCN2 in human ICC SNU308 cells
SNU308 cells were transducted with control small hairpin RNA lentiviral particles (Sc-10808-V, Santa Cruz Biotechnology) or NGAL small hairpin RNA lentiviral particles (Sc-43969-V, Santa Cruz Biotechnology) according to the manufacturer’s instructions. Two days after transduction, the cells (SNU-COLsi and SNU-NGALsi) were selected by incubation with 10 μg/ml puromycin dihydrochloride for another 3 generations.
Real-time qPCR (RT-qPCR) and western blot analysis of rat tumors
Total RNA extraction and RT-qPCR ( Lcn2 primer: All-in-One™ qPCR Primer, #RQP052324, GeneCopoeia, Rockville, MD, U.S.A.) were performed as described in the previous section. The procedures for protein extraction, blocking, and detection for western blot were performed as the manufacture guideline. The primary antibodies used in this study were LCN2 polyclonal antibody (#PAB9543, 1:1000, Abnova Corporation, Taipei, Taiwan). The secondary antibodies were Goat Anti-Rabbit IgG (H+L) HRP Antibody (#3053-1, 1:10000, Epitomics, CA, USA).
Cell proliferation assay by WST-1 kit
SNU1079 cells were plated at about 1,000 cells per cm2 in a Costar® 48 Well Clear TC-Treated Multiple Well Plates (#3548, Corning Incorporated, NY, USA). The cells were treated with ethanol vehicle (control group) or 1α,25(OH)2D3 at the indicated concentrations. The viable cells were measured by Cell Proliferation Reagent WST-1 (#11 644 807 001, Roche Diagnostrics, Mannheim, Germany).
Trans-well filter migration assay
SNU-COLsi and SNU-NGALsi cells were seeded on each trans-well filter with 8.0-μm pores (Costar, Cambridge, MA, USA). The upper chamber was filled with 250 μl serum-free DMEM and the lower chamber was filled with 600 μl DMEM with 10% FBS. These cells were allowed to migrate at 37°C in an atmosphere of 95% air-5% CO2 for 16 h. Cells that migrated through the pores were stained with Liu’s stain and washed with 1xPBS twice. Then the cells on the lower surface of the filter were counted under four random high-power microscopic fields (HPF;100X) per filter, and the mean number of cells that migrated through the filter was calculated for each condition. The experiments were performed in triplicates.
Statistical analysis
OneWay ANOVA with Post Hoc test was used for the statistical analysis of SUV for 18F-FDG uptakes among the three treatment groups during PET scanning. For human LCN2 IHC staining comparison, the differences among the three groups were analyzed by Kruskal-Wallis test, whereas the difference between each two groups were analyzed by Dunn’s Multiple Comparison Test. The Student t-test was used for the statistic analyses of serum calcium, serum 25(OH)D, body weight and in vitro experiments. P-value<0.05 was considered as a significant difference. The program of Excel 2007 or SPSS statistical software for Windows (SPSS version 10.0, Chicago, IL, USA) were employed to conduct statistical analysis.
AcknowledgementS
The authors express their thanks to the Molecular Image Center, Chang Gung Memorial Hospital, Taoyuan, Taiwan for conducting animal PET scanning, and Core Facilities for Gene Expression Analysis, Institute of Systems Biology and Bioinformatics, College of Science, National Central University, Taoyuan, Taiwan, for microarray analysis.
The study was supported in part by grants from Chang Gung Medical Research Program (CMRPG2A0322 to KCC, CMRPG3B0362 and CMRPG3B0532 to CNY, CMRPG2D0191, and CMRPG2D0192 to KCC), from National Science Council, ROC (NSC102-2320-B-182-003-MY3 to HHJ, NSC101-2320-B-008-001-MY3 to LJS)
REFERENCES
1. Khan SA, Davidson BR, Goldin R, Pereira SP, Rosenberg WM, Taylor-Robinson SD, Thillainayagam AV, Thomas HC, Thursz MR and Wasan H. Guidelines for the diagnosis and treatment of cholangiocarcinoma: consensus document. Gut. 2002; 51 Suppl 6:VI1-9.
2. Taylor-Robinson SD, Toledano MB, Arora S, Keegan TJ, Hargreaves S, Beck A, Khan SA, Elliott P and Thomas HC. Increase in mortality rates from intrahepatic cholangiocarcinoma in England and Wales 1968-1998. Gut. 2001; 48(6):816-820.
3. Khan SA, Taylor-Robinson SD, Toledano MB, Beck A, Elliott P and Thomas HC. Changing international trends in mortality rates for liver, biliary and pancreatic tumours. Journal of hepatology. 2002; 37(6):806-813.
4. Gores GJ. Cholangiocarcinoma: current concepts and insights. Hepatology. 2003; 37(5):961-969.
5. Shaib Y and El-Serag HB. The epidemiology of cholangiocarcinoma. Semin Liver Dis. 2004; 24(2):115-125.
6. Casavilla FA, Marsh JW, Iwatsuki S, Todo S, Lee RG, Madariaga JR, Pinna A, Dvorchik I, Fung JJ and Starzl TE. Hepatic resection and transplantation for peripheral cholangiocarcinoma. J Am Coll Surg. 1997; 185(5):429-436.
7. Ohtsuka M, Ito H, Kimura F, Shimizu H, Togawa A, Yoshidome H and Miyazaki M. Results of surgical treatment for intrahepatic cholangiocarcinoma and clinicopathological factors influencing survival. Br J Surg. 2002; 89(12):1525-1531.
8. Isaji S, Kawarada Y, Taoka H, Tabata M, Suzuki H and Yokoi H. Clinicopathological features and outcome of hepatic resection for intrahepatic cholangiocarcinoma in Japan. J Hepatobiliary Pancreat Surg. 1999; 6(2):108-116.
9. Nuzzo G, Giuliante F, Ardito F, De Rose AM, Vellone M, Clemente G, Chiarla C and Giovannini I. Intrahepatic cholangiocarcinoma: prognostic factors after liver resection. Updates in surgery. 2010; 62(1):11-19.
10. Khan SA, Davidson BR, Goldin RD, Heaton N, Karani J, Pereira SP, Rosenberg WM, Tait P, Taylor-Robinson SD, Thillainayagam AV, Thomas HC and Wasan H. Guidelines for the diagnosis and treatment of cholangiocarcinoma: an update. Gut. 2012; 61(12):1657-1669.
11. Chen MH, Chiang KC, Cheng CT, Huang SC, Chen YY, Chen TW, Yeh TS, Jan YY, Wang HM, Weng JJ, Chang PM, Liu CY, Li CP, Chao Y, Chen MH, Huang CY, et al. Antitumor activity of the combination of an HSP90 inhibitor and a PI3K/mTOR dual inhibitor against cholangiocarcinoma. Oncotarget. 2014.
12. Subbiah IM, Subbiah V, Tsimberidou AM, Naing A, Kaseb AO, Javle M, Fu S, Hong DS, Piha-Paul S, Wheler JJ, Hess KR, Janku F, Falchook GS, Wolff RA and Kurzrock R. Targeted therapy of advanced gallbladder cancer and cholangiocarcinoma with aggressive biology: eliciting early response signals from phase 1 trials. Oncotarget. 2013; 4(1):156-165.
13. Chiang KC and Chen TC. Vitamin D for the prevention and treatment of pancreatic cancer. World J Gastroenterol. 2009; 15(27):3349-3354.
14. Adams JS and Hewison M. Update in vitamin D. J Clin Endocrinol Metab. 2010; 95(2):471-478.
15. Chiang KC, Yeh CN, Chen MF and Chen TC. Hepatocellular carcinoma and vitamin D: a review. Journal of gastroenterology and hepatology. 2011; 26(11):1597-1603.
16. Kittaka A, Yoshida A, Chiang KC, Takano M, Sawada D, Sakaki T and Chen TC. Potent 19-norvitamin D analogs for prostate and liver cancer therapy. Future medicinal chemistry. 2012; 4(16):2049-2065.
17. Chiang KC and Chen TC. The anti-cancer actions of vitamin D. Anti-cancer agents in medicinal chemistry. 2013; 13(1):126-139.
18. Hsu JW, Yin PN, Wood R, Messing J, Messing E and Lee YF. 1 alpha, 25-dihydroxylvitamin D3 promotes Bacillus Calmette-Guerin immunotherapy of bladder cancer. Oncotarget. 2013; 4(12):2397-2406.
19. Garland CF and Garland FC. Do sunlight and vitamin D reduce the likelihood of colon cancer? Int J Epidemiol. 1980; 9(3):227-231.
20. Schwartz GG and Hulka BS. Is vitamin D deficiency a risk factor for prostate cancer? (Hypothesis). Anticancer Res. 1990; 10(5A):1307-1311.
21. Gorham ED, Garland FC and Garland CF. Sunlight and breast cancer incidence in the USSR. Int J Epidemiol. 1990; 19(4):820-824.
22. Garland CF, Gorham ED, Mohr SB and Garland FC. Vitamin D for cancer prevention: global perspective. Annals of epidemiology. 2009; 19(7):468-483.
23. International Agency for Research on Cancer 2008 VitaminD and cancer—a report of the IARC working group on vitamin D. Lyon, France: World Health Organization Press.
24. Tsai MJ and O’Malley BW. Molecular mechanisms of action of steroid/thyroid receptor superfamily members. Annu Rev Biochem. 1994; 63:451-486.
25. Carlberg C and Campbell MJ. Vitamin D receptor signaling mechanisms: integrated actions of a well-defined transcription factor. Steroids. 2013; 78(2):127-136.
26. Seubwai W, Wongkham C, Puapairoj A, Khuntikeo N and Wongkham S. Overexpression of vitamin D receptor indicates a good prognosis for cholangiocarcinoma: implications for therapeutics. Cancer. 2007; 109(12):2497-2505.
27. Kennedy L, Baker K, Hodges K, Graf A, Venter J, Hargrove L, Harris R, Harnish E, Meng F and Francis H. Dysregulation of vitamin D3 synthesis leads to enhanced cholangiocarcinoma growth. Digestive and liver disease : official journal of the Italian Society of Gastroenterology and the Italian Association for the Study of the Liver. 2013; 45(4):316-322.
28. Yeh CN, Maitra A, Lee KF, Jan YY and Chen MF. Thioacetamide-induced intestinal-type cholangiocarcinoma in rat: an animal model recapitulating the multi-stage progression of human cholangiocarcinoma. Carcinogenesis. 2004; 25(4):631-636.
29. Yeh CN, Lin KJ, Hsiao IT, Yen TC, Chen TW, Jan YY, Chung YH, Lin CF and Chen MF. Animal PET for thioacetamide-induced rat cholangiocarcinoma: a novel and reliable platform. Molecular imaging and biology : MIB : the official publication of the Academy of Molecular Imaging. 2008; 10(4):209-216.
30. Deeb KK, Trump DL and Johnson CS. Vitamin D signalling pathways in cancer: potential for anticancer therapeutics. Nature reviews Cancer. 2007; 7(9):684-700.
31. Hossein-nezhad A, Spira A and Holick MF. Influence of vitamin D status and vitamin D3 supplementation on genome wide expression of white blood cells: a randomized double-blind clinical trial. PloS one. 2013; 8(3):e58725.
32. Rosen CJ, Adams JS, Bikle DD, Black DM, Demay MB, Manson JE, Murad MH and Kovacs CS. The nonskeletal effects of vitamin D: an Endocrine Society scientific statement. Endocrine reviews. 2012; 33(3):456-492.
33. Kollenkirchen U, Walters MR and Fox J. Plasma Ca influences vitamin D metabolite levels as rats develop vitamin D deficiency. The American journal of physiology. 1991; 260(3 Pt 1):E447-452.
34. Lamprecht SA and Lipkin M. Chemoprevention of colon cancer by calcium, vitamin D and folate: molecular mechanisms. Nature reviews Cancer. 2003; 3(8):601-614.
35. Carroll C, Cooper K, Papaioannou D, Hind D, Pilgrim H and Tappenden P. Supplemental calcium in the chemoprevention of colorectal cancer: a systematic review and meta-analysis. Clinical therapeutics. 2010; 32(5):789-803.
36. IOM (Institute of Medicine) Dietary reference intakes for calcium and vitamin D. Washington, DC: The National Academies Press. 2011.
37. Hatse S, Lambrechts D, Verstuyf A, Smeets A, Brouwers B, Vandorpe T, Brouckaert O, Peuteman G, Laenen A, Verlinden L, Kriebitzsch C, Dieudonne AS, Paridaens R, Neven P, Christiaens MR, Bouillon R, et al. Vitamin D status at breast cancer diagnosis: correlation with tumor characteristics, disease outcome, and genetic determinants of vitamin D insufficiency. Carcinogenesis. 2012; 33(7):1319-1326.
38. Heikkinen S, Vaisanen S, Pehkonen P, Seuter S, Benes V and Carlberg C. Nuclear hormone 1alpha,25-dihydroxyvitamin D3 elicits a genome-wide shift in the locations of VDR chromatin occupancy. Nucleic acids research. 2011; 39(21):9181-9193.
39. Huang da W, Sherman BT and Lempicki RA. Systematic and integrative analysis of large gene lists using DAVID bioinformatics resources. Nature protocols. 2009; 4(1):44-57.
40. Cowland JB and Borregaard N. Molecular characterization and pattern of tissue expression of the gene for neutrophil gelatinase-associated lipocalin from humans. Genomics. 1997; 45(1):17-23.
41. Chakraborty S, Kaur S, Guha S and Batra SK. The multifaceted roles of neutrophil gelatinase associated lipocalin (NGAL) in inflammation and cancer. Biochimica et biophysica acta. 2012; 1826(1):129-169.
42. Li C and Chan YR. Lipocalin 2 regulation and its complex role in inflammation and cancer. Cytokine. 2011; 56(2):435-441.
43. Srisomsap C, Sawangareetrakul P, Subhasitanont P, Chokchaichamnankit D, Chiablaem K, Bhudhisawasdi V, Wongkham S and Svasti J. Proteomic studies of cholangiocarcinoma and hepatocellular carcinoma cell secretomes. Journal of biomedicine & biotechnology. 2010; 2010:437143.
44. Leelawat K, Narong S, Wannaprasert J and Leelawat S. Serum NGAL to Clinically Distinguish Cholangiocarcinoma from Benign Biliary Tract Diseases. International journal of hepatology. 2011; 2011:873548.
45. Budzynska A, Nowakowska-Dulawa E, Marek T, Boldys H, Nowak A and Hartleb M. Differentiation of pancreatobiliary cancer from benign biliary strictures using neutrophil gelatinase-associated lipocalin. Journal of physiology and pharmacology : an official journal of the Polish Physiological Society. 2013; 64(1):109-114.
46. Nuntagowat C, Leelawat K and Tohtong R. NGAL knockdown by siRNA in human cholangiocarcinoma cells suppressed invasion by reducing NGAL/MMP-9 complex formation. Clinical & experimental metastasis. 2010; 27(5):295-305.
47. Seubwai W, Wongkham C, Puapairoj A, Okada S and Wongkham S. 22-oxa-1,25-dihydroxyvitamin D3 efficiently inhibits tumor growth in inoculated mice and primary histoculture of cholangiocarcinoma. Cancer. 2010; 116(23):5535-5543.
48. Baek S, Lee YS, Shim HE, Yoon S, Baek SY, Kim BS and Oh SO. Vitamin D3 regulates cell viability in gastric cancer and cholangiocarcinoma. Anatomy & cell biology. 2011; 44(3):204-209.
49. Kawaura A, Tanida N, Akiyama J, Nonaka K, Mizutani M, Sawada K, Nakagawa K, Tsugawa N, Izumi K, Ii K, Okano T and Takeda E. Inhibitory effect of 1alpha-hydroxyvitamin D3 on N-nitrosobis(2-oxopropyl)amine-induced cholangiocarcinogenesis in Syrian hamsters. Acta medica Okayama. 2011; 65(3):193-197.