
Introduction
Telomeres are protective structures that cap the end of eukaryotic chromosomes, comprising multiple 5′-TTAGGG-3′ repeats, ending in a single-stranded overhang of the G-rich sequence [1]. As a normal cellular aging process, telomere length decreases with age. However, the speed at which telomeres shorten varies significantly among individuals. Many factors, including genetic, environmental, socio-demographics, cultural and behavioral factors [2-5], may affect the rate of telomere length shortening. Critically short telomeres may lead to chromosomal degradation, end-to-end fusion, and abnormal recombination, processes involved in disease development. On the other hand, cells with longer telomeres may favor delayed cell senescence, thus increasing the chance of developing chromosomal instability and genetic aberrations, eventually leading to carcinogenic transformation [6]. Both longer or shorter telomere length have been associated with increased risks of major age-related chronic diseases, such as cancer [7-9], type-2 diabetes [10], and cardiovascular disease [11] in epidemiological studies.
Age-related chronic diseases have also been linked to low socioeconomic status (SES) [12-17]. A common hypothesis for these associations is that chronic stress associated with social disadvantage contributes to deterioration of the body, which accelerates the decline in physiological functioning [18]. Such decline may affect leukocyte telomere length and further impact biological aging and the risk of age-related chronic diseases. Leukocyte telomere length may therefore be a link between lifestyle and environmental exposures associated with social disadvantage and age-related chronic diseases [2, 19, 20]. Maintaining a healthy lifestyle, including keeping a normal weight, regular physical activity, not smoking, and not heavy drinking, has been associated with decreased levels of oxidative stress and inflammation [20-23], and helps to prevent chronic diseases [19, 20, 24, 25]. Reduced levels of oxidative stress and inflammation have also been biologically linked to improved telomere maintenance [26-29]. However, evidence from population-based cohort studies on the relation between health behaviors and leukocyte telomere length has been inconsistent [19, 20, 30-32].
Studying the role of leukocyte telomere length in stress, biological aging, and age-related chronic diseases is particularly relevant to Mexican Americans. Mexican Americans are one of the fastest-growing populations in U.S. [33]. Three out of four Mexican Americans are either overweight or obese [34, 35]. In addition, they participate in low levels of physical activity [36], and recent surveillance data show only 44.6% met national physical activity recommendations [37]. Compared to non-Hispanic Whites, Mexican Americans tend to have lower SES, including lower income and homeownership, less education, and worse access to health care [38]. In addition, Mexican Americans are experiencing high burden of age-related chronic diseases, such as type-2 diabetes and cardiovascular diseases [39-42]. They have unique psychological, somatic, and social stress associated with acculturation [43, 44]. Studies have shown that acculturation may increase risk for stress, stress-related diseases, and poor health behaviors in Mexican Americans [45-47].
To date, the relationship among social demographics, lifestyle behaviors, and leukocyte telomere length have not been investigated in any prospective cohort study in adult Mexican Americans. Here, taking advantage of the large ongoing prospective Mano-A-Mano, the Mexican American Cohort study, we measured relative telomere length (RTL) in peripheral blood leukocytes from 12,792 cohort participants, and investigated its relationships with social demographics, lifestyle behaviors, and major chronic diseases at baseline, and with the development of cancer and type-2 diabetes at follow-up. Additionally, we studied whether RTL could predict prospective weight gain during follow-up.
Results
Of 12,792 study subjects measured for the RTL, 614 were excluded for further analysis due to questionable RTL value (outside of ±3 standard deviation of age-adjusted mean RTL). Thus, a total of 12,178 study subjects were included for further data analysis. At baseline, the mean and median ages of the population were 42 and 39 years old, respectively. The age ranged from 20 to 85 years old. The majority of study subjects were women (79.56%) and married (or living together) (77.00%) (Table 1). We used the levels of education, health insurance, home and vehicle ownership to assess SES. Only 40.60% of study subjects had at least high school education. For health insurance, 49.66%, 46.23%, and 68.55% had self, partner, and kids insurances, respectively. Home ownership was reported by 45.96% and vehicle ownership by 78.41%of the population. For immigration-related variables, the majority was born in Mexico (73.77%) and had low language acculturation (63.28%). Among Mexico-born study subjects, 29.53% arrived in the U.S. at ages younger than 20 years and 46.39% have lived in the U.S. for more than 15 years. We included 6 lifestyle behaviors in the analysis, namely, cigarette smoking, alcohol consumption, body mass index (BMI), sedentary behavior, sitting time, and sleeping time. Sedentary life style was defined based on 2008 Physical Activity Guidelines for Americans [48]. The majority of study subjects were overweight (BMI: 25-30) or obese (BMI > 30) (85.04%), never smokers (71.80%), never alcohol drinkers (66.66%), and sedentary (79.06%). Over half of study subjects had more than 2 hours sitting time per day (53.42%), and the majority of study subjects had 7 to 8 hours sleeping time per day (60.36%). The most prevalent chronic disease was hypertension (19.48%), followed by type-2 diabetes (15.27%), gallbladder disease (8.83%), asthma (3.97%), cancer (2.65%), and kidney disease (1.91%).
Table 1: Distribution of selected socio-demographics, health behaviors, and major diseases and RTL among 12,178 Mexican American study subjects
Variables |
Number of study subjects (%) |
Relative telomere length |
P value* |
Age at enrollment |
|||
20-31 |
3,116 (25.59) |
0.81 |
|
32-39 |
3,104 (25.49) |
0.78 |
|
40-50 |
2,925 (24.02) |
0.75 |
|
>50 |
3,033 (24.91) |
0.72 |
<0.001 |
Gender |
|||
men |
2,535 (20.44) |
0.76 |
|
women |
9,866 (79.56) |
0.76 |
0.324 |
Marital Status |
|||
Married/living as married |
9,365 (77.00) |
0.76 |
|
Other |
2,797 (23.00) |
0.76 |
0.780 |
Education |
|||
<High school |
7,229 (59.40) |
0.76 |
|
At least high school |
4,941 (40.60) |
0.77 |
0.069 |
Self insurance |
|||
Yes |
5,498 (49.66) |
0.77 |
|
No |
5,574 (50.34) |
0.76 |
0.004 |
Partner insurance |
|||
Yes |
4,227 (46.23) |
0.77 |
|
No |
4,917 (53.77) |
0.76 |
0.189 |
Kids insurance |
|||
Yes |
6,502(68.55) |
0.77 |
|
No |
2,983(31.45) |
0.76 |
0.264 |
Own home |
|||
Yes |
5,025 (45.96) |
0.76 |
|
No |
5,909 (54.04) |
0.76 |
0.539 |
Own car |
|||
Yes |
8,558 (78.41) |
0.76 |
|
No |
2,356 (21.59) |
0.77 |
0.618 |
Birth location |
|||
Mexico |
8,973 (73.77) |
0.76 |
|
U.S. |
3,191 (26.23) |
0.76 |
0.221 |
Years lived in U.S. (for born in Mexico only) |
|||
<5 |
1,038 (11.57) |
0.75 |
|
5-10 |
1,841 (20.52) |
0.77 |
|
10-15 |
1,930 (21.51) |
0.76 |
|
>15 |
4,162 (46.39) |
0.77 |
0.255 |
Age at arrival (for born in Mexico only) |
|||
<20 |
2,649 (29.53) |
0.76 |
|
20-29 |
3,906 (43.55) |
0.77 |
|
≥30 |
2,415 (26.92) |
0.76 |
0.242 |
Language acculturation |
|||
High |
4,449 (36.72) |
0.76 |
|
Low |
7,666 (63.28) |
0.76 |
0.308 |
Cigarettes smoking status |
|||
current |
1,579 (12.99) |
0.76 |
|
former |
1,848 (15.20) |
0.76 |
|
never |
8,727 (71.80) |
0.76 |
0.882 |
Alcohol drinking status |
|||
current |
2,770 (22.88) |
0.76 |
|
former |
1,267 (10.46) |
0.76 |
|
never |
8,071 (66.66) |
0.77 |
0.244 |
BMI |
|||
Under/Normal weight (<25) |
1,791 (14.96) |
0.75 |
|
Overweight (25-29.9) |
4,072 (34.00) |
0.76 |
|
Obese (≤30) |
6,112 (51.04) |
0.77 |
<0.001 |
Sedentary behavior |
|||
No |
2,380 (20.94) |
0.77 |
|
Yes |
8,987 (79.06) |
0.76 |
0.052 |
Sit hours/day |
|||
<2 |
4,784 (46.58) |
0.76 |
|
2-3 |
2,817 (27.43) |
0.74 |
|
>3 |
2,670 (26.00) |
0.75 |
<0.001 |
Sleep hours/day |
|||
<=6 |
3,307 (28.96) |
0.74 |
|
7-8 |
6,894 (60.36) |
0.75 |
|
≥9 |
1,220 (10.68) |
0.77 |
0.001 |
Any Major Disease (prevalence) |
|||
Yes |
7,298 (60.01) |
0.77 |
|
No |
4,864 (39.99) |
0.75 |
0.013 |
High blood pressure (prevalence) |
|||
Yes |
2,372 (19.48) |
0.78 |
|
No |
9,805 (80.52) |
0.76 |
<0.001 |
Diabetes (prevalence) |
|||
Yes |
1,859 (15.27) |
0.77 |
|
No |
10,317 (84.73) |
0.76 |
0.401 |
Gallbladder disease (prevalence) |
|||
Yes |
1,075 (8.83) |
0.79 |
|
No |
11,102 (91.17) |
0.76 |
0.001 |
Asthma (prevalence) |
|||
Yes |
483 (3.97) |
0.77 |
|
No |
11,694 (96.03) |
0.76 |
0.729 |
All cancer (prevalence) |
|||
Yes |
323 (2.65) |
0.84 |
|
No |
11,855 (97.35) |
0.76 |
<0.001 |
Kidney disease (prevalence) |
|||
Yes |
232 (1.91) |
0.82 |
|
No |
11,945 (98.09) |
0.76 |
0.014 |
* Adjust for age and gender as appropriate
The mean and median of RTLs were 0.76 and 0.75, respectively. The range was between 0.21 and 0.99. Among demographic characteristics, the most significant association with RTL was observed for age. As expected, we observed a significant trend of decreasing RTL with increasing age categories (p < 0.001). Study subjects who had less than high school education had marginally shorter RTL than those who had at least high school education (p = 0.069). Study subjects with self-insurance had significantly longer RTL than those without (p = 0.004). No significant associations were observed with immigration related variables (including birth location, acculturation, years lived in U.S., and age at arrival).
BMI was positively associated with RTL (both as continuous variables) (p < 0.001). In the BMI categorical analysis, after adjusting for age and gender, RTL was shortest among study subjects who were under or normal weight (0.75), median among those who were overweight (0.76), and longest among those who were obese (0.77) (p < 0.001). When the study subjects were stratified by age categories, 20-29, 30-39, 40-49, 50-59, 60-69, 70-79, and 80 or more years old (Figure 1), the positive association between RTL and BMI persisted for most of the age categories. However, the BMI category difference in RTL tended to decrease with increasing age. When we compared RTL between the 20-29 years old and those aged 80 or older, the difference was 0.19 for those with under or normal weight, 0.13 for those overweight, and 0.085 for obese groups (p = 0.005).
Table 2: Multivariate regression analysis of RTL on social-demographics and health behaviors
Variables |
Estimate |
Standard Error |
P value |
age |
-0.003 |
0.0002 |
<0.001 |
Gender (women vs men) |
0.002 |
0.008 |
0.804 |
BMI |
0.002 |
0.0005 |
<0.001 |
Education (≥ high school vs < high school) |
0.013 |
0.006 |
0.021 |
Birth place (U.S. vs Mexico) |
0.009 |
0.007 |
0.197 |
Ever vs never smokers |
-0.008 |
0.007 |
0.230 |
Ever vs never drinkers |
0.009 |
0.007 |
0.220 |
Sleep time (≤6 hours/day) |
|||
7-8 hours/day |
0.028 |
0.009 |
0.003 |
≥9hours/day |
0.039 |
0.010 |
0.001 |
Sitting time (<2 hours/day) |
|||
2-3 hours/day |
-0.003 |
0.008 |
0.674 |
>3 hours/day |
-0.026 |
0.007 |
<0.001 |
Sedentary lifestyle (yes vs no) |
-0.0003 |
0.007 |
0.965 |
Self-insurance (yes vs no) |
0.012 |
0.006 |
0.041 |
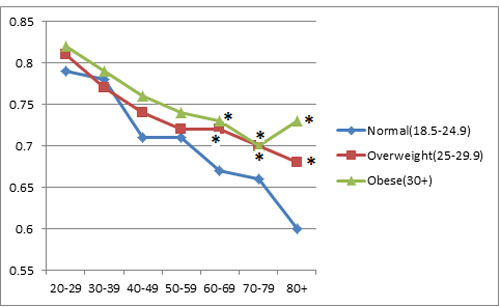
Figure 1: Associations between relative telomere length and age group by BMI category. * indicates statistical significance when RTL in overweight or obese subjects were compared to RTL in subjects with a normal weight in each age group.
Significant relationships were also observed for RTL with sitting time and sleeping time. Study subjects who had less than 2 hours sitting time per day had the longest RTL (0.76) compared to those who had 2-3 hours (0.74) and more than 3 hours sitting time per day (0.75) (P < 0.001). RTL was positively associated with hours of sleeping per day. RTL was the longest among those who slept at least 9 hours per day (0.77), median among those who slept 7-8 hours per day (0.75), and shortest among those who slept no more than 6 hours per day (0.74) (P < 0.001). In addition, those who were sedentary had marginally shorter RTL than those who were not sedentary (0.76 vs 0.77, P = 0.052).
For the six chronic diseases (including hypertension, type-2 diabetes, gallbladder disease, asthma, cancer, and kidney disease) reported at baseline, study subjects who had at least one of the six diseases had longer RTL than those who did not (RTL: 0.77 vs 0.75, p = 0.013). When stratified by the type of chronic disease, significant difference remained for hypertension (P < 0.001), gallbladder disease (P < 0.001), cancer (P < 0.001), and kidney disease (P = 0.014). Using the mediation analysis, we examined the potential mediating role of RTL on the association between BMI and major chronic diseases. RTL was found to mediate 5.25% of the association between BMI and hypertension and 5.13% of the association between BMI and gallbladder disease (P = 0.001 and 0.037, respectively).
All social-demographic and behavioral variables with p value ≤ 0.25 in the univariate analysis (from Table 1) were included into a multivariate model (Table 2). After multivariate adjustment, a number of variables remained significantly related to RTL. Longer RTL was positively associated with BMI, education, hours of sleep, and self-insurance, but was inversely associated with age and sitting time.
To assess the potential joint effect of SES and health behaviors on RTL, we created a social-behavioral score by including 2 SES related variables (education and self-insurance) and 2 lifestyle behaviors (sitting time and sleeping time). For each variable, we created a binary high SES or healthy variable, defined as at least high school education, having self-insurance, sitting less than 2 hours per day, or sleeping more than 6 hours per day. The social-behavioral score ranged from 0 (low SES and no healthy behaviors) to 4 (high SES and healthy behaviors). We investigated the association between the social-behavioral score and RTL (Figure 2). In general, when the score increased from 0 to 4, RTL gradually increased (p < 0.001). For study subjects with social-behavioral score 0, 1, 2, 3, and 4, RTL was 0.71, 0.73, 0.75, 0.77, and 0.78, respectively.
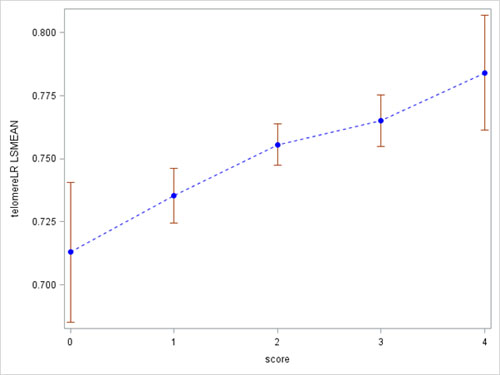
Figure 2: Associations between relative telomere length and social-behavioral score.
To assess whether RTL was a predictor of chronic diseases, we analyzed the relationships between RTL and incident cancer and type-2 diabetes during the follow-up. Telomere length data were available from 360 incident cancer cases. Overall, RTL at baseline was not significantly different between incident cancer cases and non-cancer cohort participants (0.77 vs 0.76, p = 0.555). In the multivariable-adjusted Cox proportional-hazard regression model, using RTL as a continuous variable, we found that longer RTL was associated with increased risk of overall cancer (adj.HR = 1.05, 95%CI = 1.02-1.09) (Table 3). When stratified by cancer site, due to small sample size, no significant association was observed for any cancer type. In further quartile analysis, compared to individuals with the shortest RTL (1st quartile), those who had longer RTL (2nd, 3rd, and 4th quartiles) had increased risks of overall cancer (P for tread = 0.006). However, the only significant association was observed among those in the 4th quartile of RTL (adj.HR = 1.53, 95%CI = 1.11-2.10). Telomere length data were available from 533 incident type-2 diabetes cases. Overall, RTL was associated with decreased risk of incident type-2 diabetes (adj.HR = 0.89, 95%CI = 0.82-0.94) (Table 4). In the quartile analysis, those with longest RTL (4th quartile) had 48% decreased risk of developing type-2 diabetes than those with shortest RTL (1st quartile) (adj.HR = 0.52, 95%CI = 0.32-0.70). A significant trend of decreasing risk of type-2 diabetes was observed when RTL increased (P for trend < 0.001).
Table 3: Risk of incident cancer associated with RTL
RTL (continuous variables) |
Cases, N (%) |
Controls, N (%) |
Adjusted hazard ratios (HRs) (95%) CI) |
P value |
All cancers |
360 |
9,989 |
1.05 (1.02-1.09) |
0.005 |
Breast cancer (women) only) |
87 |
8,170 |
1.01 (0.94-1.07) |
0.889 |
Lung cancer |
26 |
10,294 |
1.11 (0.96-1.27) |
0.159 |
Cervical cancer (women) only) |
19 |
8,225 |
1.05 (0.92-1.21) |
0.454 |
Liver cancer |
11 |
10,303 |
1.03 (0.85-1.25) |
0.773 |
Prostate cancer (men) |
21 |
2,049 |
1.16 (0.97-1.37) |
0.097 |
All cancers, by quartile |
||||
1st |
92 (25.6%) |
2,679 (26.8%) |
1.00 |
|
2nd |
94 (26.1%) |
2,335 (23.4%) |
1.17 (0.88-1.57) |
0.275 |
3rd |
104 (28.9%) |
2,570 (25.7%) |
1.31 (0.99-1.73) |
0.063 |
4th |
70 (19.4%) |
2,405 (24.1%) |
1.53 (1.11-2.10) |
0.009 |
P for trend |
0.006 |
|||
Adjusted for age, sex, birth country, education, marital status, HBP, diabetes, smoking, drinking, sitting time, and physical activity.
Table 4: Risk of incident diabetes associated with RTL
Diabetes, N (%) |
Non-diabetes, N (%) |
HR(95%CI)* |
P value |
|
All study subjects |
||||
RTL (continuous variables) |
533 |
7,837 |
0.89 (0.82-0.94) |
0.001 |
By quartile |
||||
1st |
195 (36.6%) |
2,108 (26.9%) |
ref |
|
2nd |
139 (26.1%) |
1,834 (23.4%) |
0.82 (0.55-1.03) |
0.084 |
3rd |
124 (23.2%) |
2,006 (25.6%) |
0.67 (0.45-0.90) |
0.001 |
4th |
75 (14.1%) |
1,889 (24.1%) |
0.52 (0.32-0.70) |
<0.001 |
P for trend |
<0.001 |
|||
*adjusted for age, sex, birth country, education, marital status, HBP, smoking, drinking, sitting time, and physical activity.
Last, in a subset of study subjects with multiple weight data during follow-up, we explored whether RTL could predict weight gain during the follow-up (Table 5). At least 10% weight gain compared to the baseline weight during the follow-up was deemed as the event. In the multivariate regression analysis, the final model included age at baseline, gender, baseline BMI, marriage status, acculturation, birth place, and RTL. RTL was a positive predictor of at least 10% weight gain during the follow-up (adj.HR = 1.03, 95%CI = 1.00-1.05). In addition, older age, married (or living together), high BMI, and born in U.S. were associated with less likely to gain at least 10% weight. On the other hand, being women and having higher acculturation were more likely to gain at least 10% weight.
Table 5: Risk of weight gain (>=10%) and RTL
|
HR(95%CI) |
P value |
age |
0.97(0.97-0.98) |
<.0001 |
Gender: men vs women |
0.78(0.63-0.97) |
0.0229 |
BMI |
0.94(0.94-0.95) |
<.0001 |
marital status: other vs married |
1.24(1.08-1.42) |
0.0021 |
acculturation |
1.05(1.00-1.12) |
0.0743 |
Own home: yes vs no |
0.79(0.71-0.89) |
<.0001 |
Self-insurance: no vs yes |
0.84(0.76-0.94) |
0.0018 |
logRTL (0.1 per unit) |
1.02(1.01-1.04) |
0.0075 |
Discussion
The associations among social-demographics, health behaviors, and telomere length have rarely been studied in adult Mexican Americans. The only published study was from the National Health and Nutrition Examination Survey (1999-2002), which includes 1,377 Mexican Americans [49]. In that study, the only significant factor correlated with RTL was age. In the current study, with 12,792 Mexican Americans aged 20 to 85 years, in the cross-sectional analysis, we found that lower SES (measured by low education levels and without self-insurance) was significantly associated with shorter RTL. In addition, we observed RTL was positively correlated with BMI, sleeping time, and several major chronic diseases, and negatively correlated with age and sitting time. Then, in the longitudinal analysis, we found that longer RTL was a predictor for all cancer, type-2 diabetes, and weight gain.
Socioeconomic disparities in chronic diseases are well-known, but we have limited understanding about the biological mechanisms underlying the association between social status and health. Individuals with low SES are exposed to more stressful conditions, such as chronic financial strain and exposure to harmful work and home environments [50]. Low SES is linked with reduced access to psychosocial means, such as self-efficacy and social support, that can buffer the harmful impact of stress on health [50]. Furthermore, given the stress responses are triggered by experiences in which individuals feel that the resources they have at hand are sufficient to deal with a danger, it is expected that individuals with low SES are prone to exhibiting larger dysregulation of stress response systems [51]. Given the growing body of evidence demonstrating an association between telomere length and stressful circumstances, telomere length provides a potential biological link between low SES and chronic diseases. In the current study, we observed an inverse relationship between levels of SES and RTL. Study subjects with less than high school education had shorter RTL than those who had at least high school education (P = 0.021). Similarly, study subjects with no self-insurance had shorter RTL than those who had self-insurance (P = 0.041). Our results are consistent with several previous studies. For example, using data from the National Health and Nutrition Examination Survey (1999-2002), Needham et al. found that study subjects who completed less than high school education has significantly shorter telomeres than those who graduated from college (P < 0.01) [49]. However, the significant relationship was only observed among Caucasian American study subjects, not among African and Mexican Americans. The only significant relationship reported among Mexican Americans was from Multi-Ethnic Study of Atherosclerosis (MESA), which evaluated the relationship between SES and telomere length among 963 U.S. adolescents, including 510 Mexican American adolescents [52]. In that study, Carroll et al. found that father’s education and current home ownership was associated with telomere length.
Health behavior is a major determinant of chronic disease risk in most of the developed countries [19, 20, 24, 27]. Epidemiological and basic science studies have shown that unhealthy lifestyle including cigarette smoking, heavy drinking, sedentary behavior, and obesity could increase stress levels, decrease immune function, and deteriorate physiological condition [53-58]. In the current study, we found inverse relationships among sitting time, sleeping time, and RTL, and a positive relationship between BMI and RTL. No significant relationship was observed among cigarette smoking, alcohol drinking, sedentary behavior, and RTL. The relationship among sedentary behavior, sitting time, and RTL has been investigated previously [31, 49, 59-66]. The results are still limited and inconsistent. For example, Sjögren et al. found that shorter sitting time was associated with telomere lengthening in blood cells in sedentary, overweight 68-year-old individuals participating in a 6-month physical activity intervention trial [66]. Using data from Nurses’ Health Study, Du et al. reported that sitting time and sedentary behavior were not associated with leukocyte telomere length [31]. However, they found that moderate to vigorous amounts of physical activity are associated with longer telomeres. Much of the discrepancy among different studies may be due to the different methods used to assess physical activity, sedentary behavior, and sitting time. Differences in study population, such as race, age, occupation, and sample size etc., may also contribute to the inconsistent results. Telomere length has been reported to be more stable among older individuals [67], and weakened associations have been witnessed among older individuals [61], potentially reducing the statistical power in studies of older participants. Compared to many of the other studies, our study population is younger (mean age = 42 years old). Coupled with the large sample size (N = 12,792), our study is more powerful to detect significant associations.
One interesting finding in this study is the positive relationship between sleeping time and RTL. The relationship between sleep and telomere length has been investigated in a few population-based studies [68-72]. In a study of participants in the Nurses’ Health Study, short sleep duration (≤6 hours) was associated with shorter telomere length only in those younger than 50 years [71]. Jackowska et al. found a positive linear relationship between sleep time and leukocyte telomere length in men only [69]. Thus, our results confirmed the previous reports and further suggest the positive relation between sleeping time and telomere length is consistent regardless of gender. The mechanisms through which sleep might be related to telomere length remain to be determined, although several molecular pathways have been suggested, including inflammation [73, 74], oxidative stress [75], sympathetic nervous system activity [76, 77], and neuroendocrine pathways [78, 79].
Another intriguing but puzzling finding from this study is the positive relationship between BMI and telomere length. In a recent systematic review and meta-analysis of 29 existing studies, Muezzinler et al. concluded an inverse association between BMI and RTL in adults [80]. However, in the Genetic Epidemiology Research Study on Adult Health and Aging (GERA) with 100,000 study subjects presented in 2012 American Society of Human Genetic Annual meeting, Schaefer et al. reported that BMI was positively correlated with telomere length in saliva DNAs, which is consistent with our finding. To eliminate the potential age effect, we stratified the study subjects based on their age categories, and we found study subjects in the obese group had steadily longer telomere length than those in the normal weight group across all the age categories. More interestingly, the difference of telomere length by BMI status became larger with the age increased. In studying the relationship between RTL and prospective weight gain, we found that long RTL at baseline was associated with a higher likelihood of gaining at least 10% weight during follow-up. Our observation is consistent with the results from the Health ABC study, in which longer telomere length was associated with a positive percent change between baseline and 7-year follow-up for both BMI and % body fat [81]. Clearly, more work is needed to determine the underlying molecular mechanisms between BMI and RTL.
The relationship between RTL and major chronic diseases (both prevalent and incident) was another piece of interesting finding. At the cross-sectional comparison, longer RTL was associated with increased prevalence of overall major chronic diseases as well as several diseases individually, including hypertension, gallbladder disease, cancer, and kidney disease. Prospectively, longer RTL was associated with an increased risk of overall cancer. The positive association seems consistent across the cancer type. However, no significant association was observed in any individual type of cancer, likely due to the small sample size in each type of cancer. The relationship between RTL and cancer has been studied extensively in both case control and cohort settings [9, 82-98]. However, the results are inconsistent at large. Recent large cross-sectional studies and prospective studies have shown that both long RTL and short RTL can predispose individuals to increased cancer risks and the direction of association is not only cancer type-dependent, but also histology-dependent [93, 96, 98]. For example, long RTL was associated with an increased risk of lung adenocarcinoma, whereas short RTL was associated with a reduced risk of lung squamous cell carcinoma [93, 98]. Although we do not know the exact biological explanation, upon exposure to carcinogens, cells with longer telomeres may be less likely to enter senescence or apoptosis. Their survival could increase their chance to have extended carcinogen exposure and thereby increase the risk of developing genetic abnormalities.
In a recent meta-analysis including 4 cohort studies and 4 case-control studies, Zhao et al. found that shortened telomere length was significantly associated with risk of type-2 diabetes (OR = 1.29, 95% CI: 1.11-1.14) [10]. Similar association was observed in our study. Short telomeres may lead to premature β-cell senescence, resulting in reduced β-cell mass and subsequent impaired insulin secretion and glucose tolerance. Indeed, experimental evidence suggests that telomerase is important in maintaining glucose homeostasis in mice [99]. Conversely, elevated blood glucose levels increase oxidative stress, potentially interfering with telomerase function and resulting in shortened telomeres [100].
There are several limitations in this study. First, the measure of RTL used in this study is an average of telomere length across all leukocyte cell types. Previous research suggests that telomere length in different cell types varies within the same individual [101]. Future work should attempt to evaluate RTL in a single cell type. Second, the numbers of incident cancer and diabetes are still small, especially for cancer. This limits our statistical power to detect the associations. Thus, our data need to be interpreted with caution. Third, the analysis of SES and health behavior in relation to RTL is cross-sectional. Longitudinal data would be necessary to analyze the rate of telomere shortening in relation to baseline SES and health behavior. Finally, we did not have a direct assessment of stress exposure and cannot estimate the extent to which SES and health behavior affect RTL through stress physiology.
The relationships among SES, health behavior, chronic diseases and telomere length have been studied previously [2, 19]. However, such study has never been comprehensively investigated among adult Mexican Americans. This study fills the gap. Among 12,792 Mexican Americans, we found that RTL is significantly affected by SES and health behavior. In addition, we found longer RTL is a predictor of cancer, diabetes, and weight gain. Together with the results of other studies in different populations and different races, this study suggests that the investigation of telomere length can help further our understanding on how social conditions and health behavior can transduce into molecular pathways and eventually affect health.
Materials and Methods
Study population
The samples for the current study were drawn from participants in a large population-based cohort of Mexican origin households recruited from the Houston-area. This cohort, an ongoing prospective cohort of 1st and 2nd generation Mexican origin immigrant households in Houston, TX, initiated in July 2001 and maintained by Department of Epidemiology at the University of Texas MD Anderson Cancer Center in Houston, Texas. A detailed description of the sampling and recruitment strategy has been published previously [102]. Briefly, participants have been recruited through block walking in predominantly Mexican American neighborhoods, from community centers and local health clinics, and networking through currently enrolled participants. Of the identified eligible households, ~88% agreed to participate in the study. After written informed consent was obtained, trained bilingual research interviewers conducted a structured face-to-face interview lasting ~45 minutes, using a standardized and validated questionnaire in the participant’s preferred language, either Spanish or English. The questionnaire elicited information on birthplace and residential history, social-demographic characteristics, lifestyle behaviors, levels of physical activity, personal medical history, family history of chronic disease, acculturation, and occupation exposure. The study was approved by the institutional review board of M.D. Anderson Cancer Center. Participants have been actively followed up via annual telephone re-contact to update selected exposures and new diagnosis of selected chronic diseases, including cancer, type-2 diabetes, and hypertension. The incidence of cancer was confirmed with Texas Cancer Registry and the incidence of type-2 diabetes was confirmed by medical record review.
Relative telomere length (RTL) assessment
Genomic DNA was isolated from whole blood samples of 12,792 participants using the QIAamp Maxi DNA kit (Qiagen, Valencia, CA) according to the manufacturer’s protocol. Extracted DNA samples were quantified by Quant-iTTM PicoGreen®dsDNA Reagent and Kits (Invitrogen, Carlsbad, CA) according to the manufacturer’s directions. The RTL was measured using a modified version of the real-time quantitative polymerase chain reaction (PCR) method originally described by Cawthon [103]. A detailed description of the experimental strategy has been published previously [104]. Briefly, the ratio of the telomere repeat copy number (T) to the single gene (human globulin) copy number (S) was determined for each sample. The derived T/S ratio was proportional to the overall telomere length. The PCR reaction mixture (14 ul) for the telomere amplification consisted of 1 x SYBR Green Master Mix (Applied Biosystems, Foster City, CA), 200 nmol/l Tel-1 primer (5’-CGGTT TGTTTGGGTTTGGGTTTGGGTTTGGGTTTGGGTT), 200 nmol/l Tel-2 primer (5’-GGCTT GCCTTACCCTTACCCTTACCCTTACCCTTACCCT), and 5 ng genomic DNA. Similarly, the PCR reaction mixture (14 ul) for HGB gene amplification consisted of 1x SYBR Green Master Mix, 200 nmol/l Hgb-1 primer (5’-GCTTCTGACACAACTGTGTTCACTAGC), 200 nmol/l Hgb-2 primer (5’-CACCAA CTTCATCCACGTTCACC), and 5 ng genomic DNA. The thermal cycling conditions were 1 cycle at 95oC for 10 minutes followed by 40 cycles at 95oC for 15 seconds and at 56oC (for telomere amplification) or 58oC (for HGB amplification) for 1 minute. The HT7900 system (Applied Biosystems, CA) was used to perform the Real-time PCR. Each sample was run in duplicate in a 384-well plate. The telomere and HGB PCRs were done on separate 384-well plates with the same samples in the same well positions. In each run, negative and positive controls, a calibrator DNA, and a standard curve were included. The positive controls contained a telomere of 1.2 kb and a telomere of 3.9 kb from a commercial telomere length assay kit (Roche Applied Science, Pleasanton, CA). For each standard curve, 1 reference DNA sample (the same DNA sample for all runs) was diluted 2-fold serially to produce a 6 point standard curve between 20 ng and 0.625 ng of DNA in each reaction. The coefficient of determination (R2) for each standard curve was≥0.99, with acceptable standard deviations set at 0.25 (for the Ct values). The intra-assay coefficient of variation was < 3%, and the inter assay coefficient of variation was < 5% for RTL assay in our laboratory.
Statistical analysis
We used the statistical software package SAS, version 9.4 (SAS, Cary, NC) for analysis. Since the relative telomere length data were not normally distributed, we performed the analysis using both data with and without log transformation. We found no significant differences in the estimated associations with and without log transformation, and therefore only data without log transformation were presented here. Differences in the distribution of social-demographics, health behaviors, and major chronic diseases were evaluated by Pearson χ2 test for categorical variables. Spearman correlation was used to assess the relationship between age and RTL. In univariate analysis, the general linear regression analysis was used to examine RTL by the selected variable. Both age and gender were adjusted as appropriate. Mediation analysis was performed to assess the role of RTL in the association between BMI and chronic diseases at baseline. In multivariate analysis, the general linear model was used. The social-demographic and health behavior variables associated with RTL with a P value less than 0.25 in the univariate analysis were included in the multivariate analysis. For joint effect analysis, we created a social-behavioral score by including 2 SES related variables (education and self-insurance) and 2 lifestyle behaviors (sitting time and sleeping time). These are binary variables with the high SES or healthy category defined as at least high school education, having self-insurance, sitting less than 2 hours per day, and sleeping more than 6 hours per day, respectively. The social-behavioral score ranged from 0 (low SES and no healthy behaviors) to 4 (high SES and healthy behaviors). Multivariate analysis was used to assess the relationship between the social-behavioral score and RTL. The associations of incident cancer and type-2 diabetes with RTL were assessed using the multivariable-adjusted Cox proportional-hazard regression model. RTL was analyzed as both a continuous and categorical variable. For categorical variables, cutoff points were set at the quartile values in the non-cancer study population. Adjusted Hazard ratios (HR) and 95% confidence intervals (CI) were estimated and potential confounding factors were adjusted as appropriate. Multivariable-adjusted Cox proportional-hazard regression model was also used to examine whether RTL at baseline could predict at least 10% weight gain in the follow-up. All statistical tests were 2-sided, and the level of statistical significance was set at 0.05.
Acknowledgments
None declared.
Conflicts of Interest
None declared.
Funding
The Cohort receives funds collected pursuant to the Comprehensive Tobacco Settlement of 1998 and appropriated by the 76th legislature to The University of Texas MD Anderson Cancer Center. This work was supported in part by Center for Translational and Public Health Genomics, the Dan Duncan Family Institute for Risk Assessment and Cancer Prevention. The funders did not contribute to the design and conduct of the study; the collection, analysis, or interpretation of the data; or the preparation, review, or approval of the manuscript.
REFERENCEs
1. Blackburn EH. The telomere and telomerase: nucleic acid-protein complexes acting in a telomere homeostasis system. A review. Biochemistry (Mosc). 1997; 62: 1196-201.
2. Starkweather AR, Alhaeeri AA, Montpetit A, Brumelle J, Filler K, Montpetit M, Mohanraj L, Lyon DE, Jackson-Cook CK. An integrative review of factors associated with telomere length and implications for biobehavioral research. Nurs Res. 2014; 63: 36-50. doi: 10.1097/NNR.0000000000000009.
3. Eisenberg DT. An evolutionary review of human telomere biology: the thrifty telomere hypothesis and notes on potential adaptive paternal effects. Am J Hum Biol. 2011; 23: 149-67. doi: 10.1002/ajhb.21127.
4. Kurenova EV, Mason JM. Telomere functions. A review. Biochemistry (Mosc). 1997; 62: 1242-53.
5. Chen W, Kimura M, Kim S, Cao X, Srinivasan SR, Berenson GS, Kark JD, Aviv A. Longitudinal versus cross-sectional evaluations of leukocyte telomere length dynamics: age-dependent telomere shortening is the rule. J Gerontol A Biol Sci Med Sci. 2011; 66: 312-9. doi: 10.1093/gerona/glq223.
6. Urquidi V, Tarin D, Goodison S. Telomerase in cancer: clinical applications. Ann Med. 1998; 30: 419-30.
7. Hou L, Zhang X, Gawron AJ, Liu J. Surrogate tissue telomere length and cancer risk: shorter or longer? Cancer Lett. 2012; 319: 130-5. doi: 10.1016/j.canlet.2012.01.028.
8. Ma H, Zhou Z, Wei S, Liu Z, Pooley KA, Dunning AM, Svenson U, Roos G, Hosgood HD 3rd, Shen M, Wei Q. Shortened telomere length is associated with increased risk of cancer: a meta-analysis. PLoS One. 2011; 6: e20466. doi: 10.1371/journal.pone.0020466.
9. Wentzensen IM, Mirabello L, Pfeiffer RM, Savage SA. The association of telomere length and cancer: a meta-analysis. Cancer Epidemiol Biomarkers Prev. 2011; 20: 1238-50. doi: 10.1158/1055-9965.EPI-11-0005.
10. Zhao J, Miao K, Wang H, Ding H, Wang DW. Association between telomere length and type 2 diabetes mellitus: a meta-analysis. PLoS One. 2013; 8: e79993. doi: 10.1371/journal.pone.0079993.
11. Haycock PC, Heydon EE, Kaptoge S, Butterworth AS, Thompson A, Willeit P. Leucocyte telomere length and risk of cardiovascular disease: systematic review and meta-analysis. BMJ. 2014; 349: g4227. doi: 10.1136/bmj.g4227.
12. Quinlan J, Tu MT, Langlois EV, Kapoor M, Ziegler D, Fahmi H, Zunzunegui MV. Protocol for a systematic review of the association between chronic stress during the life course and telomere length. Syst Rev. 2014; 3: 40. doi: 10.1186/2046-4053-3-40.
13. Skinner EH, Foster M, Mitchell G, Haynes M, O’Flaherty M, Haines TP. Effect of health insurance on the utilisation of allied health services by people with chronic disease: a systematic review and meta-analysis. Aust J Prim Health. 2014; 20: 9-19. doi: 10.1071/PY13092.
14. Amaral S, Patzer R. Disparities, race/ethnicity and access to pediatric kidney transplantation. Curr Opin Nephrol Hypertens. 2013; 22: 336-43. doi: 10.1097/MNH.0b013e32835fe55b.
15. Thomson H, Thomas S, Sellstrom E, Petticrew M. Housing improvements for health and associated socio-economic outcomes. Cochrane Database Syst Rev. 2013; 2: CD008657. doi: 10.1002/14651858.CD008657.pub2.
16. Chen E, Miller GE. Socioeconomic status and health: mediating and moderating factors. Annu Rev Clin Psychol. 2013; 9: 723-49. doi: 10.1146/annurev-clinpsy-050212-185634.
17. Sewell JL, Velayos FS. Systematic review: The role of race and socioeconomic factors on IBD healthcare delivery and effectiveness. Inflamm Bowel Dis. 2013; 19: 627-43. doi: 10.1002/ibd.22986.
18. Geronimus AT, Hicken M, Keene D, Bound J. “Weathering” and age patterns of allostatic load scores among blacks and whites in the United States. Am J Public Health. 2006; 96: 826-33. doi: 10.2105/AJPH.2004.060749.
19. Shalev I, Entringer S, Wadhwa PD, Wolkowitz OM, Puterman E, Lin J, Epel ES. Stress and telomere biology: a lifespan perspective. Psychoneuroendocrinology. 2013; 38: 1835-42. doi: 10.1016/j.psyneuen.2013.03.010.
20. Babizhayev MA, Yegorov YE. Smoking and health: association between telomere length and factors impacting on human disease, quality of life and life span in a large population-based cohort under the effect of smoking duration. Fundam Clin Pharmacol. 2011; 25: 425-42. doi: 10.1111/j.1472-8206.2010.00866.x.
21. Dorresteijn JA, Visseren FL, Spiering W. Mechanisms linking obesity to hypertension. Obes Rev. 2012; 13: 17-26. doi: 10.1111/j.1467-789X.2011.00914.x.
22. Hybertson BM, Gao B, Bose SK, McCord JM. Oxidative stress in health and disease: the therapeutic potential of Nrf2 activation. Mol Aspects Med. 2011; 32: 234-46. doi: 10.1016/j.mam.2011.10.006.
23. Teixeira-Lemos E, Nunes S, Teixeira F, Reis F. Regular physical exercise training assists in preventing type 2 diabetes development: focus on its antioxidant and anti-inflammatory properties. Cardiovasc Diabetol. 2011; 10: 12. doi: 10.1186/1475-2840-10-12.
24. Russo P, Fini M, Cesario A. Editorial: disease control and active and healthy ageing: new paradigms of therapeutic strategy. Curr Pharm Des. 2014; 20: 5919-20.
25. Green J, Jester R. Health-related quality of life and chronic venous leg ulceration: Part 2. Br J Community Nurs. 2010; 15: S4-6, S8, S10, passim. doi: 10.12968/bjcn.2010.15.Sup1.46906.
26. Price LH, Kao HT, Burgers DE, Carpenter LL, Tyrka AR. Telomeres and early-life stress: an overview. Biol Psychiatry. 2013; 73: 15-23. doi: 10.1016/j.biopsych.2012.06.025.
27. Epel ES. Psychological and metabolic stress: a recipe for accelerated cellular aging? Hormones (Athens). 2009; 8: 7-22.
28. Richards JB, Valdes AM, Gardner JP, Kato BS, Siva A, Kimura M, Lu X, Brown MJ, Aviv A, Spector TD. Homocysteine levels and leukocyte telomere length. Atherosclerosis. 2008; 200: 271-7. doi: 10.1016/j.atherosclerosis.2007.12.035.
29. Valdes AM, Andrew T, Gardner JP, Kimura M, Oelsner E, Cherkas LF, Aviv A, Spector TD. Obesity, cigarette smoking, and telomere length in women. Lancet. 2005; 366: 662-4. doi: 10.1016/S0140-6736(05)66630-5.
30. Montpetit AJ, Alhareeri AA, Montpetit M, Starkweather AR, Elmore LW, Filler K, Mohanraj L, Burton CW, Menzies VS, Lyon DE, Jackson-Cook CK. Telomere length: a review of methods for measurement. Nurs Res. 2014; 63: 289-99. doi: 10.1097/NNR.0000000000000037.
31. Du M, Prescott J, Kraft P, Han J, Giovannucci E, Hankinson SE, De Vivo I. Physical activity, sedentary behavior, and leukocyte telomere length in women. Am J Epidemiol. 2012; 175: 414-22. doi: 10.1093/aje/kwr330.
32. Diaz VA, Mainous AG 3rd, Everett CJ, Schoepf UJ, Codd V, Samani NJ. Effect of healthy lifestyle behaviors on the association between leukocyte telomere length and coronary artery calcium. Am J Cardiol. 2010; 106: 659-63. doi: 10.1016/j.amjcard.2010.04.018.
33. Koebnick C, Langer-Gould AM, Gould MK, Chao CR, Iyer RL, Smith N, Chen W, Jacobsen SJ. Sociodemographic characteristics of members of a large, integrated health care system: comparison with US Census Bureau data. Perm J. 2012; 16: 37-41.
34. Rossen LM. Neighbourhood economic deprivation explains racial/ethnic disparities in overweight and obesity among children and adolescents in the U.S.A. J Epidemiol Community Health. 2014; 68: 123-9. doi: 10.1136/jech-2012-202245.
35. Gallo LC, Fortmann AL, de Los Monteros KE, Mills PJ, Barrett-Connor E, Roesch SC, Matthews KA. Individual and neighborhood socioeconomic status and inflammation in Mexican American women: what is the role of obesity? Psychosom Med. 2012; 74: 535-42. doi: 10.1097/PSY.0b013e31824f5f6d.
36. Neighbors CJ, Marquez DX, Marcus BH. Leisure-time physical activity disparities among Hispanic subgroups in the United States. Am J Public Health. 2008; 98: 1460-4. doi: 10.2105/ajph.2006.096982.
37. Prevention CfDCa. (2011). Prevalence and Trends Data: Nationwide (States and DC) - 2011 Physical Activity .
38. Morales LS, Lara M, Kington RS, Valdez RO, Escarce JJ. Socioeconomic, cultural, and behavioral factors affecting Hispanic health outcomes. J Health Care Poor Underserved. 2002; 13: 477-503.
39. Caballero AE. Understanding the Hispanic/Latino patient. Am J Med. 2011; 124: S10-5. doi: 10.1016/j.amjmed.2011.07.018.
40. Al Snih S, Fisher MN, Raji MA, Markides KS, Ostir GV, Goodwin JS. Diabetes mellitus and incidence of lower body disability among older Mexican Americans. J Gerontol A Biol Sci Med Sci. 2005; 60: 1152-6.
41. Ventura H, Pina IL, Lavie CJ. Hypertension and antihypertensive therapy in Hispanics and Mexican Americans living in the United States. Postgrad Med. 2011; 123: 46-57. doi: 10.3810/pgm.2011.11.2494.
42. Centers for Disease C, Prevention. Hypertension-related mortality among Hispanic subpopulations--United States, 1995-2002. MMWR Morb Mortal Wkly Rep. 2006; 55: 177-80.
43. Schneider MG, Chiriboga DA. Associations of stress and depressive symptoms with cancer in older Mexican Americans. Ethn Dis. 2005; 15: 698-704.
44. Sullivan MM, Rehm R. Mental health of undocumented Mexican immigrants: a review of the literature. ANS Adv Nurs Sci. 2005; 28: 240-51.
45. Marsiglia FF, Booth JM, Baldwin A, Ayers S. Acculturation and Life Satisfaction Among Immigrant Mexican Adults. Adv Soc Work. 2013; 14: 49-64.
46. MacKenzie JJ, Smith TW, Uchino BN. Cardiovascular reactivity during stressful speaking tasks in Mexican-American women: effects of language use and interaction partner ethnicity. J Behav Med. 2013; 36: 621-31. doi: 10.1007/s10865-012-9456-7.
47. Gallo LC, Shivpuri S, Gonzalez P, Fortmann AL, de los Monteros KE, Roesch SC, Talavera GA, Matthews KA. Socioeconomic status and stress in Mexican-American women: a multi-method perspective. J Behav Med. 2013; 36: 379-88. doi: 10.1007/s10865-012-9432-2.
48. Carlson SA, Fulton JE, Schoenborn CA, Loustalot F. Trend and prevalence estimates based on the 2008 Physical Activity Guidelines for Americans. Am J Prev Med. 2010; 39: 305-13. doi: 10.1016/j.amepre.2010.06.006.
49. Needham BL, Adler N, Gregorich S, Rehkopf D, Lin J, Blackburn EH, Epel ES. Socioeconomic status, health behavior, and leukocyte telomere length in the National Health and Nutrition Examination Survey, 1999-2002. Soc Sci Med. 2013; 85: 1-8. doi: 10.1016/j.socscimed.2013.02.023.
50. Adler NE, Stewart J. Health disparities across the lifespan: meaning, methods, and mechanisms. Ann N Y Acad Sci. 2010; 1186: 5-23. doi: 10.1111/j.1749-6632.2009.05337.x.
51. Cohen S, Doyle WJ, Baum A. Socioeconomic status is associated with stress hormones. Psychosom Med. 2006; 68: 414-20. doi: 10.1097/01.psy.0000221236.37158.b9.
52. Carroll JE, Diez Roux AV, Fitzpatrick AL, Seeman T. Low social support is associated with shorter leukocyte telomere length in late life: multi-ethnic study of atherosclerosis. Psychosom Med. 2013; 75: 171-7. doi: 10.1097/PSY.0b013e31828233bf.
53. Nunn AV, Guy GW, Brodie JS, Bell JD. Inflammatory modulation of exercise salience: using hormesis to return to a healthy lifestyle. Nutr Metab (Lond). 2010; 7: 87. doi: 10.1186/1743-7075-7-87.
54. Ji LL, Dickman JR, Kang C, Koenig R. Exercise-induced hormesis may help healthy aging. Dose Response. 2010; 8: 73-9. doi: 10.2203/dose-response.09-048.Ji.
55. Radak Z, Chung HY, Koltai E, Taylor AW, Goto S. Exercise, oxidative stress and hormesis. Ageing Res Rev. 2008; 7: 34-42. doi: 10.1016/j.arr.2007.04.004.
56. Gomez-Pinilla F. The influences of diet and exercise on mental health through hormesis. Ageing Res Rev. 2008; 7: 49-62. doi: 10.1016/j.arr.2007.04.003.
57. Ji LL, Gomez-Cabrera MC, Vina J. Exercise and hormesis: activation of cellular antioxidant signaling pathway. Ann N Y Acad Sci. 2006; 1067: 425-35. doi: 10.1196/annals.1354.061.
58. Radak Z, Chung HY, Goto S. Exercise and hormesis: oxidative stress-related adaptation for successful aging. Biogerontology. 2005; 6: 71-5. doi: 10.1007/s10522-004-7386-7.
59. Kim JH, Ko JH, Lee DC, Lim I, Bang H. Habitual physical exercise has beneficial effects on telomere length in postmenopausal women. Menopause. 2012; 19: 1109-15. doi: 10.1097/gme.0b013e3182503e97.
60. Puterman E, Lin J, Blackburn E, O’Donovan A, Adler N, Epel E. The power of exercise: buffering the effect of chronic stress on telomere length. PLoS One. 2010; 5: e10837. doi: 10.1371/journal.pone.0010837.
61. Cherkas LF, Hunkin JL, Kato BS, Richards JB, Gardner JP, Surdulescu GL, Kimura M, Lu X, Spector TD, Aviv A. The association between physical activity in leisure time and leukocyte telomere length. Arch Intern Med. 2008; 168: 154-8. doi: 10.1001/archinternmed.2007.39.
62. Rae DE, Vignaud A, Butler-Browne GS, Thornell LE, Sinclair-Smith C, Derman EW, Lambert MI, Collins M. Skeletal muscle telomere length in healthy, experienced, endurance runners. Eur J Appl Physiol. 2010; 109: 323-30. doi: 10.1007/s00421-010-1353-6.
63. LaRocca TJ, Seals DR, Pierce GL. Leukocyte telomere length is preserved with aging in endurance exercise-trained adults and related to maximal aerobic capacity. Mech Ageing Dev. 2010; 131: 165-7. doi: 10.1016/j.mad.2009.12.009.
64. Cassidy A, De Vivo I, Liu Y, Han J, Prescott J, Hunter DJ, Rimm EB. Associations between diet, lifestyle factors, and telomere length in women. Am J Clin Nutr. 2010; 91: 1273-80. doi: 10.3945/ajcn.2009.28947.
65. Woo J, Tang N, Leung J. No association between physical activity and telomere length in an elderly Chinese population 65 years and older. Arch Intern Med. 2008; 168: 2163-4. doi: 10.1001/archinte.168.19.2163.
66. Sjogren P, Fisher R, Kallings L, Svenson U, Roos G, Hellenius ML. Stand up for health--avoiding sedentary behaviour might lengthen your telomeres: secondary outcomes from a physical activity RCT in older people. Br J Sports Med. 2014; 48: 1407-9. doi: 10.1136/bjsports-2013-093342.
67. Frenck RW Jr, Blackburn EH, Shannon KM. The rate of telomere sequence loss in human leukocytes varies with age. Proc Natl Acad Sci U S A. 1998; 95: 5607-10.
68. Cribbet MR, Carlisle M, Cawthon RM, Uchino BN, Williams PG, Smith TW, Gunn HE, Light KC. Cellular aging and restorative processes: subjective sleep quality and duration moderate the association between age and telomere length in a sample of middle-aged and older adults. Sleep. 2014; 37: 65-70. doi: 10.5665/sleep.3308.
69. Jackowska M, Hamer M, Carvalho LA, Erusalimsky JD, Butcher L, Steptoe A. Short sleep duration is associated with shorter telomere length in healthy men: findings from the Whitehall II cohort study. PLoS One. 2012; 7: e47292. doi: 10.1371/journal.pone.0047292.
70. Lee KA, Gay C, Humphreys J, Portillo CJ, Pullinger CR, Aouizerat BE. Telomere length is associated with sleep duration but not sleep quality in adults with human immunodeficiency virus. Sleep. 2014; 37: 157-66. doi: 10.5665/sleep.3328.
71. Liang G, Schernhammer E, Qi L, Gao X, De Vivo I, Han J. Associations between rotating night shifts, sleep duration, and telomere length in women. PLoS One. 2011; 6: e23462. doi: 10.1371/journal.pone.0023462.
72. Prather AA, Puterman E, Lin J, O’Donovan A, Krauss J, Tomiyama AJ, Epel ES, Blackburn EH. Shorter leukocyte telomere length in midlife women with poor sleep quality. J Aging Res. 2011; 2011: 721390. doi: 10.4061/2011/721390.
73. Bekaert S, De Meyer T, Rietzschel ER, De Buyzere ML, De Bacquer D, Langlois M, Segers P, Cooman L, Van Damme P, Cassiman P, Van Criekinge W, Verdonck P, De Backer GG, et al. Telomere length and cardiovascular risk factors in a middle-aged population free of overt cardiovascular disease. Aging Cell. 2007; 6: 639-47. doi: 10.1111/j.1474-9726.2007.00321.x.
74. Mullington JM, Haack M, Toth M, Serrador JM, Meier-Ewert HK. Cardiovascular, inflammatory, and metabolic consequences of sleep deprivation. Prog Cardiovasc Dis. 2009; 51: 294-302. doi: 10.1016/j.pcad.2008.10.003.
75. McEwen BS. Sleep deprivation as a neurobiologic and physiologic stressor: Allostasis and allostatic load. Metabolism. 2006; 55: S20-3. doi: 10.1016/j.metabol.2006.07.008.
76. Meerlo P, Sgoifo A, Suchecki D. Restricted and disrupted sleep: effects on autonomic function, neuroendocrine stress systems and stress responsivity. Sleep Med Rev. 2008; 12: 197-210. doi: 10.1016/j.smrv.2007.07.007.
77. Lusardi P, Mugellini A, Preti P, Zoppi A, Derosa G, Fogari R. Effects of a restricted sleep regimen on ambulatory blood pressure monitoring in normotensive subjects. Am J Hypertens. 1996; 9: 503-5.
78. Kumari M, Badrick E, Ferrie J, Perski A, Marmot M, Chandola T. Self-reported sleep duration and sleep disturbance are independently associated with cortisol secretion in the Whitehall II study. J Clin Endocrinol Metab. 2009; 94: 4801-9. doi: 10.1210/jc.2009-0555.
79. Spath-Schwalbe E, Scholler T, Kern W, Fehm HL, Born J. Nocturnal adrenocorticotropin and cortisol secretion depends on sleep duration and decreases in association with spontaneous awakening in the morning. J Clin Endocrinol Metab. 1992; 75: 1431-5. doi: 10.1210/jcem.75.6.1334495.
80. Muezzinler A, Zaineddin AK, Brenner H. Body mass index and leukocyte telomere length in adults: a systematic review and meta-analysis. Obes Rev. 2014; 15: 192-201. doi: 10.1111/obr.12126.
81. Njajou OT, Cawthon RM, Blackburn EH, Harris TB, Li R, Sanders JL, Newman AB, Nalls M, Cummings SR, Hsueh WC. Shorter telomeres are associated with obesity and weight gain in the elderly. Int J Obes (Lond). 2012; 36: 1176-9. doi: 10.1038/ijo.2011.196.
82. Kotsopoulos J, Prescott J, De Vivo I, Fan I, McLaughlin J, Rosen B, Risch H, Sun P, Narod SA. Telomere length and mortality following a diagnosis of ovarian cancer. Cancer Epidemiol Biomarkers Prev. 2014; 23: 2603-6. doi: 10.1158/1055-9965.EPI-14-0885.
83. Wu X, Zhao H, Suk R, Christiani DC. Genetic susceptibility to tobacco-related cancer. Oncogene. 2004; 23: 6500-23. doi: 10.1038/sj.onc.1207811.
84. Bau DT, Lippman SM, Xu E, Gong Y, Lee JJ, Wu X, Gu J. Short telomere lengths in peripheral blood leukocytes are associated with an increased risk of oral premalignant lesion and oral squamous cell carcinoma. Cancer. 2013; 119: 4277-83. doi: 10.1002/cncr.28367.
85. Burke LS, Hyland PL, Pfeiffer RM, Prescott J, Wheeler W, Mirabello L, Savage SA, Burdette L, Yeager M, Chanock S, De Vivo I, Tucker MA, Goldstein AM, et al. Telomere length and the risk of cutaneous malignant melanoma in melanoma-prone families with and without CDKN2A mutations. PLoS One. 2013; 8: e71121. doi: 10.1371/journal.pone.0071121.
86. Gramatges MM, Liu Q, Yasui Y, Okcu MF, Neglia JP, Strong LC, Armstrong GT, Robison LL, Bhatia S. Telomere content and risk of second malignant neoplasm in survivors of childhood cancer: a report from the Childhood Cancer Survivor Study. Clin Cancer Res. 2014; 20: 904-11. doi: 10.1158/1078-0432.CCR-13-2076.
87. Heaphy CM, Yoon GS, Peskoe SB, Joshu CE, Lee TK, Giovannucci E, Mucci LA, Kenfield SA, Stampfer MJ, Hicks JL, De Marzo AM, Platz EA, Meeker AK. Prostate cancer cell telomere length variability and stromal cell telomere length as prognostic markers for metastasis and death. Cancer Discov. 2013; 3: 1130-41. doi: 10.1158/2159-8290.CD-13-0135.
88. Kim S, Sandler DP, Carswell G, De Roo LA, Parks CG, Cawthon R, Weinberg CR, Taylor JA. Telomere length in peripheral blood and breast cancer risk in a prospective case-cohort analysis: results from the Sister Study. Cancer Causes Control. 2011; 22: 1061-6. doi: 10.1007/s10552-011-9778-8.
89. Lan Q, Cawthon R, Gao Y, Hu W, Hosgood HD 3rd, Barone-Adesi F, Ji BT, Bassig B, Chow WH, Shu X, Cai Q, Xiang Y, Berndt S, et al. Longer telomere length in peripheral white blood cells is associated with risk of lung cancer and the rs2736100 (CLPTM1L-TERT) polymorphism in a prospective cohort study among women in China. PLoS One. 2013; 8: e59230. doi: 10.1371/journal.pone.0059230.
90. Harris DP, Ortiz F, Adler FM, Yu K, Maines ML, Barba D, Viggiani SI, Wolf SM, Fitten LJ, Chodosh J, Vickrey BG. Challenges to screening and evaluation of memory impairment among Hispanic elders in a primary care safety net facility. Int J Geriatr Psychiatry. 2011; 26: 268-76. doi: 10.1002/gps.2524.
91. Mirabello L, Garcia-Closas M, Cawthon R, Lissowska J, Brinton LA, Peplonska B, Sherman ME, Savage SA. Leukocyte telomere length in a population-based case-control study of ovarian cancer: a pilot study. Cancer Causes Control. 2010; 21: 77-82. doi: 10.1007/s10552-009-9436-6.
92. Qin Q, Sun J, Yin J, Liu L, Chen J, Zhang Y, Li T, Shi Y, Wei S, Nie S. Telomere length in peripheral blood leukocytes is associated with risk of colorectal cancer in Chinese population. PLoS One. 2014; 9: e88135. doi: 10.1371/journal.pone.0088135.
93. Sanchez-Espiridion B, Chen M, Chang JY, Lu C, Chang DW, Roth JA, Wu X, Gu J. Telomere length in peripheral blood leukocytes and lung cancer risk: a large case-control study in Caucasians. Cancer Res. 2014; 74: 2476-86. doi: 10.1158/0008-5472.CAN-13-2968.
94. Shen M, Cawthon R, Rothman N, Weinstein SJ, Virtamo J, Hosgood HD 3rd, Hu W, Lim U, Albanes D, Lan Q. A prospective study of telomere length measured by monochrome multiplex quantitative PCR and risk of lung cancer. Lung Cancer. 2011; 73: 133-7. doi: 10.1016/j.lungcan.2010.11.009.
95. Varadi V, Brendle A, Brandt A, Johansson R, Enquist K, Henriksson R, Svenson U, Tavelin B, Roos G, Hemminki K, Lenner P, Forsti A. Polymorphisms in telomere-associated genes, breast cancer susceptibility and prognosis. Eur J Cancer. 2009; 45: 3008-16. doi: 10.1016/j.ejca.2009.08.012.
96. Weischer M, Nordestgaard BG, Cawthon RM, Freiberg JJ, Tybjaerg-Hansen A, Bojesen SE. Short telomere length, cancer survival, and cancer risk in 47102 individuals. J Natl Cancer Inst. 2013; 105: 459-68. doi: 10.1093/jnci/djt016.
97. Wu X, Amos CI, Zhu Y, Zhao H, Grossman BH, Shay JW, Luo S, Hong WK, Spitz MR. Telomere dysfunction: a potential cancer predisposition factor. J Natl Cancer Inst. 2003; 95: 1211-8.
98. Seow WJ, Cawthon RM, Purdue MP, Hu W, Gao YT, Huang WY, Weinstein SJ, Ji BT, Virtamo J, Hosgood HD 3rd, Bassig BA, Shu XO, Cai Q, et al. Telomere length in white blood cell DNA and lung cancer: a pooled analysis of three prospective cohorts. Cancer Res. 2014; 74: 4090-8. doi: 10.1158/0008-5472.CAN-14-0459.
99. Kuhlow D, Florian S, von Figura G, Weimer S, Schulz N, Petzke KJ, Zarse K, Pfeiffer AF, Rudolph KL, Ristow M. Telomerase deficiency impairs glucose metabolism and insulin secretion. Aging (Albany NY). 2010; 2: 650-8. doi: 10.18632/aging.100200.
100. Serra V, Grune T, Sitte N, Saretzki G, Von Zglinicki T. Telomere length as a marker of oxidative stress in primary human fibroblast cultures. Molecular and Cellular Gerontology. 2000; 908: 327-30.
101. Lin J, Epel E, Cheon J, Kroenke C, Sinclair E, Bigos M, Wolkowitz O, Mellon S, Blackburn E. Analyses and comparisons of telomerase activity and telomere length in human T and B cells: insights for epidemiology of telomere maintenance. J Immunol Methods. 2010; 352: 71-80. doi: 10.1016/j.jim.2009.09.012.
102. Chow WH, Chrisman M, Daniel CR, Ye Y, Gomez H, Dong Q, Anderson CE, Chang S, Strom S, Zhao H, Wu X. Cohort Profile: The Mexican American Mano a Mano Cohort. Int J Epidemiol. 2015; 46:e3. doi: 10.1093/ije/dyv016.
103. Cawthon RM. Telomere length measurement by a novel monochrome multiplex quantitative PCR method. Nucleic Acids Res. 2009; 37: e21. doi: 10.1093/nar/gkn1027.
104. Gu J, Chen M, Shete S, Amos CI, Kamat A, Ye Y, Lin J, Dinney CP, Wu X. A genome-wide association study identifies a locus on chromosome 14q21 as a predictor of leukocyte telomere length and as a marker of susceptibility for bladder cancer. Cancer Prev Res (Phila). 2011; 4: 514-21. doi: 10.1158/1940-6207.CAPR-11-0063.