
INTRODUCTION
Recently, next generation sequencing technology has identified many new gene mutations in acute myeloid leukemia (AML) that provide novel insights into the mechanisms of leukemogenesis and that further unravel the molecular heterogeneity, in particular within the group of cytogenetically normal (CN) AML [1, 2]. In addition to genomic abnormalities, aberrant expression levels of several genes have been identified as prognostic markers [3, 4], so as deregulated gene expression also involved in CN-AML pathogenesis. However, underlying mechanisms are still poorly understood and require more detailed characterization in order to define novel markers of improved leukemia risk stratification.
In addition, mRNA splicing has been reported to be involved in human disease development, and many cancer-related genes have been shown to be regulated by alternative splicing [5]. In accordance, in myeloid disease several reports have revealed mutations in genes encoding splicing factors, such as SF3B1 [6, 7], and recently a heterogeneous genomic category of AML with mutations in genes encoding chromatin and RNA-splicing regulators, accounting for 18% of patients, could be identified [8]. Moreover, first analyses of alternative splicing in bone marrow of AML samples revealed a number of significantly spliced genes, which encode e.g. proteins such as NOTCH2, CD13 or FLT3 [9].
Recently, NPM1 mutations have been defined from a provisional to an established entity within the WHO classification of AML [10, 11]. This new entity bears distinct genetic, pathological and clinical features [12, 13]. Of particular importance is the fact that mutations in NPM1 without concomitant FMS-like tyrosine kinase 3-internal tandem duplication (FLT3-ITD) mutations identify a group of CN-AML patients with favorable prognosis [12, 14, 15]. NPM1 (also known as B23) was first identified as a multifunctional phosphoprotein, which shuttles between nucleus and cytoplasm. It participates in ribosome biogenesis, supporting cell growth and proliferation [16–18]. NPM1 physically interacts with many cellular proteins, including the tumor suppressors p53 and ARF. For example, NPM1 stabilizes the oncosuppressor ARF and determines its subcellular localization, thus contributing to modulating growth-suppressive pathways [19–21].
NPM1 mutations occur specifically in about 30% of adult de novo AML patients. These mutations cause delocalization and destabilization of ARF. Absence of NPM1 in the nucleus in consequence may suppress the antioncogenic effect of the ARF-MDM2-p53 signaling pathway. NPM1 mutant AML presents with a specific gene expression profile and a specific microRNA (miRNA) signature [22, 23]. In accordance, the relocation of NPM1 into the cytoplasm was shown to cause overexpression of a number of HOX genes potentially involved in hematopoietic stem cell differentiation. Overexpression of HOXA4, HOXA6, HOXA7, HOXA9, HOXB9 and MEIS1 were observed in NPM1 mutated cells, as well as AML with MLL abnormalities. However, it was also found that some of HOX genes like HOXB2, HOXB3, HOXB5, HOXB6 and HOXD4 are upregulated only in cells with NPM1 mutation. However, the mechanism by which NPM1 affects HOX gene expression is still unclear [24].
NPM1 mutations are usually associated with CN karyotype (85%), while the remaining 15% of patients mostly carry minor chromosomal abnormalities that are thought to be a secondary events [25]. It was found that NPM1 mutations correlate with some driver molecular events like FLT3-ITD, DNMT3A, IDH1, IDH2 and TET2 mutations [1, 8, 26], while NPM1 mutations are mutually exclusive or rarely co-occur in MLL-PTD, RUNX1, CEBPA and TP53 mutant cases [2].
The NPM1 gene contains 12 exons and in humans maps to chromosome 5q35. It encodes at least three main alternatively spliced isoforms: R1 (B23.1), R2 (B23.2), and R3 (B23.3). The prevalent isoform R1 is translated from exon 1 to 9 and 11 to 12, the isoform R2 contains exons 1 to 10, and little information is available on the R3 isoform lacking exons 8 and 10 [27, 28]. Of special interest is isoform R2, which lacks the exons coding the domain responsible for the nucleolar localization. Due to the lack of exons 11 and 12, this isoform preferentially localizes in the nucleoplasm [29] that might affect signal pathways influencing thereby patients outcome or modulating treatment response.
NPM1 is also frequently overexpressed in solid tumors of different histological origin (such as gastric, colon, ovarian, and prostate carcinomas) [30–33], however to date NPM1 mutations seem to be exclusively found in AML patients, although the relevance of splice variant expression remains undetermined. Since splice variants play an important role in cellular functioning and splicing factor mutations have been reported in myeloid tumors including AML [8, 34], the current study focuses on the characterization of NPM1 splice variants expression as well as its impact in AML patients.
RESULTS
Expression levels of NPM1 splice variants in AML patients
In the first cohort of 104 patient samples qRT-PCR was performed for three splice variants of NPM1 gene. The following NPM1 splice variants were evaluated: R1 translated from exon 1 to 9 and 11 to 12, R2 containing exons 1 to 10, and R3 lacking exons 8 and 10. NPM1 splice variant and primer locations are presented in Supplementary Figure 1A. As a control we isolated RNA from peripheral blood mononuclear cells (PBMC) of six healthy volunteers (HVs) and measured expression of NPM1 splice variants in this group. The clinical, cytogenetic and molecular genetic characteristics of the patients in this study are summarized in Table 1.
Table 1: Baseline characteristics of 201* AML patients
Characteristics |
All patients (n=201) |
CN-AML patients (n=105) |
AML patients with cytogenetic aberrations (n=92) |
|---|---|---|---|
Sex - no. (%) |
|||
Male |
110 (55) |
59 (56) |
48 (52) |
Female |
91 (45) |
46 (44) |
44 (48) |
Age - yr |
|||
Median |
49 |
49 |
48 |
Range |
18-74 |
24-74 |
18-68 |
Bone marrow blasts |
|||
Median - % |
80 |
80 |
80 |
Range - % |
0-100 |
6-100 |
0-100 |
Data not available – no. (%) |
6 (3) |
1 (0.5) |
5 (5) |
Peripheral blood blasts |
|||
Median - % |
57 |
48 |
65 |
Range - % |
0-100 |
0-100 |
0-100 |
Data not available – no. (%) |
6 (3) |
1 (0.5) |
5 (5) |
Type of AML - no. (%) |
|||
Primary AML |
179 (89) |
95 (90) |
80 (87) |
s-AML |
10 (5) |
6 (6) |
4 (4) |
t-AML |
7 (4) |
1 (1) |
6 (7) |
o-AML |
5 (2) |
3 (3) |
2 (2) |
NPM1 mutations - no. (%) |
60 (30) |
55 (52) |
4 (4) |
Data not available |
6 (3) |
0 (0) |
6 (7) |
FLT3-IDT mutations - no. (%) |
50 (25) |
36 (34) |
14 (15) |
Cytogenetic group - no. (%) |
|||
normal karyotype |
105 (52) |
105 (100) |
16 (17) |
complex karyotype |
16 (8) |
13 (14) |
|
inv(16) |
13 (6) |
4 (4) |
|
t(9;11) other |
4 (2) |
23 (25) |
|
t(15;17) |
10 (5) |
14 (15) |
|
t(8;21) |
14 (7) |
* For 4 patients data were not available. s-AML - secondary AML, t-AML - therapy related AML, o-AML - patients with a clinical history an oncological disease, which was not treated with chemotherapy or radiation therapy and therefore cannot be classified as t-AML.
The expression of splice variants R1, R2 and R3 were higher in all AML patients compared to HVs with a median 1.73 vs 0.55 (p=0.014), 0.98 vs 0.33 (p=0.093), and 2.54 vs 0.11 (p<0.001), respectively (Supplementary Figure 1B-1D).
RNA-seq of AML and subpopulations of HVs cells
As the relative expression should be assessed using normal stem cells from HVs, we performed RNA-seq analyses of FACS-sorted bone marrow samples of three HVs and ten transcriptomes of CN-AML cases. In total ten cell fractions of cells from normal bone marrow were obtained: myeloblasts (from n=2 healthy donors), promyelocytes (n=2), metamyelocytes (n=3) and neutrophils (n=3) [35], next R2 expression was assessed. We observed that the expression of R2 was significantly higher in less differentiated hematopoietic cells (such as myeloblasts, promyelocytes) and in AML blasts compared to more differentiated cells (metamyelocytes and neutrophils (p=0.005)) what can suggest R2 accumulation in blast cells (Figure 1).
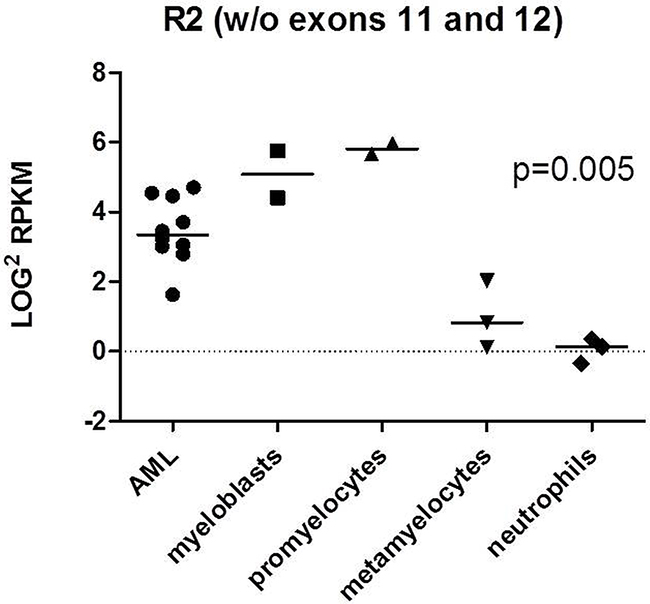
Figure 1: RNAseq analysis of R2 expression in 10 AML transcriptomes and 3 HVs bone marrow samples. Ten cell fractions of cells from normal bone marrow were obtained: myeloblasts (from n=2 healthy donors), promyelocytes (n=2), metamyelocytes (n=3) and neutrophils (n=3). P-value refers to all analyzed subfractions of cells. The analysis was performed with ANOVA test.
NPM1 splice variant expression in CN-AML patients
To investigate whether NPM1 expression is influenced by its mutational status, we separated the 52 CN-AML patients (from the first cohort of 104 patients) based on underlying NPM1mut or NPM1 wildtype status (NPM1wt). Expression of the R2 splice variant tended to be elevated in NPM1mut compared to NPM1wt with a median expression of 0.78 vs 0.40, p=0.052, but there were no significant differences in R1 and R3 mRNA levels between NPM1mut and NPM1wt (0.97 vs 0.80, p=0.20 and 1.51 vs 2.40, p=0.64, respectively) (Supplementary Figure 2A-2C).
Expression of NPM1 proteins
To evaluate the translation of the splice variants on the protein level, we performed Western blot analysis in selected cancer cell lines which revealed differential expression of NPM1 splice variants in leukemic myeloid cells (Figure 2A). While all cell lines seem to express the R2 variant, additional splice variant seems to exist as highlighted by the additional band in the KG1 cell line. In primary AML patient samples with available material for Western blot analysis, we also evaluated the expression of R2 as its expression might have prognostic impact. Western blot analysis of 3 AML patients demonstrates R1 and R2 expression at the protein level. In one patient we observed all 3 isoforms of NPM1 (Figure 2B).
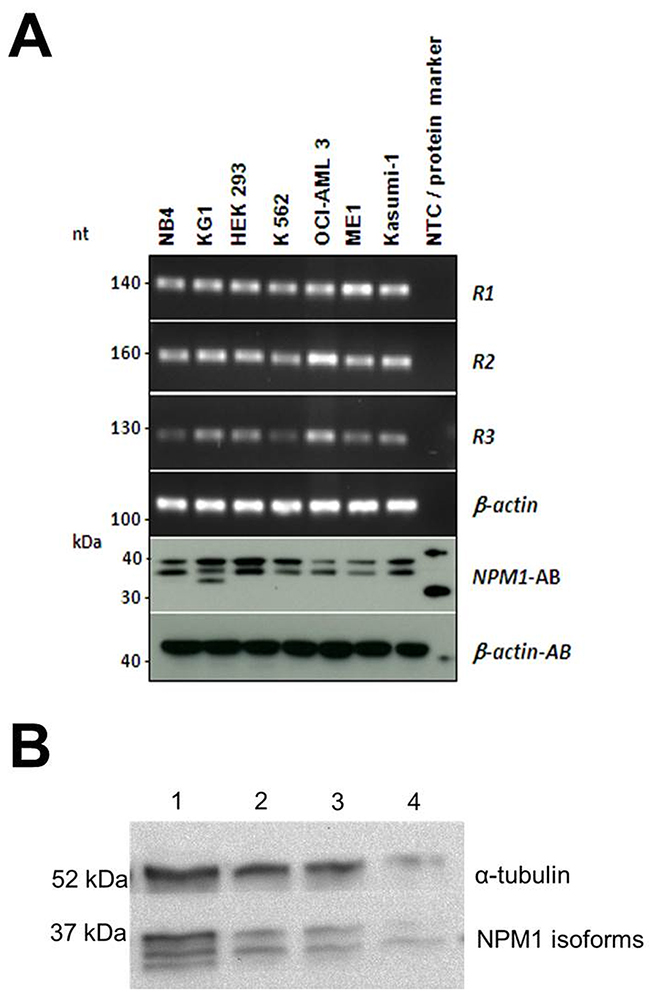
Figure 2: (A) Conventional PCR and Western blot analysis of NPM1 isoforms in cell lines. cDNA from the cell lines NB4, KG1, HEK293, K562, OCI-AML3, ME-1 and Kasumi-1 was analyzed by conventional PCR and protein lysates of the corresponding cell lines were analyzed on Western blot. β-actin was used as a loading control. Conventional PCR shows the expression of R1, R2 and R3 NPM1 isoforms in the cell lines, which could be confirmed by Western blot analysis. (B) Western blot analysis of NPM1 expression in 4 AML patients.
Impact of NPM1 splice variant expression on outcome
Correlation of NPM1 splice variant expression with overall survival (OS), event-free survival (EFS), and relapse-free survival (RFS) was evaluated by Kaplan-Meier analysis for groups with high and low expression of each splice variant (data were dichotomized at the median expression). High R2 splice variant expression was significantly associated with longer OS, EFS and RFS in the first data set of 104 AML patients (854 vs 403 days, p=0.019, 281 vs 182 days, p=0.034, and median not reached (n.r.) vs 323 days, p=0.014, respectively) (Supplementary Figure 3). We also found that high expression of R1 impacted OS, but not EFS and RFS (814 vs 402 days, p=0.029, 260 vs 205 days, p=0.29 and 1312 vs 345, p=0.23). We found no association with OS, EFS and RFS in case of high or low R3 expression (435 vs 669 days, p=0.83, 197 vs 288 days, p=0.26, and 471 vs 627 days, p=0.74) in 104 AML patients.
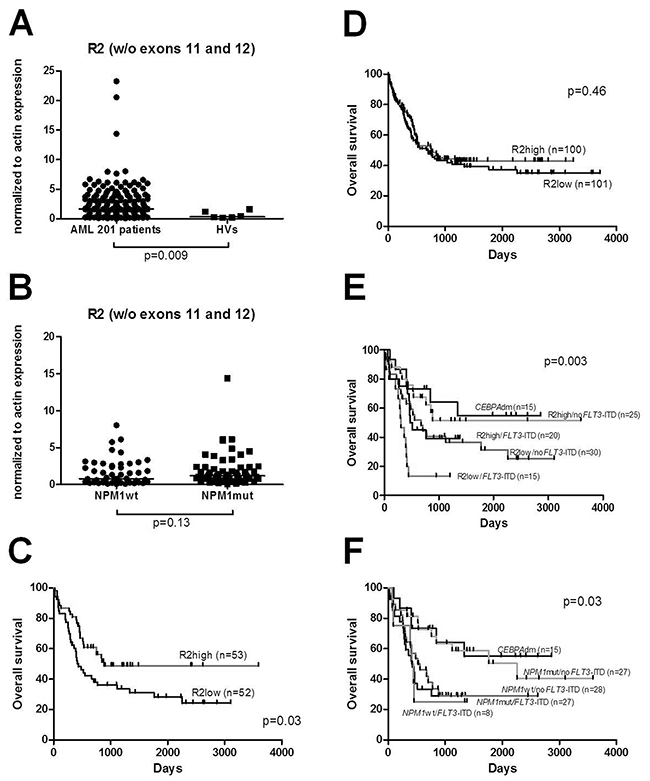
Figure 3: (A) Enhanced expression of NPM1 splice variant R2 was observed in 201 AML patients compared to HVs. (B) Expression levels of NPM1 splice variant R2 within CN-AML groups with NPM1 mutations (NPM1mut) and without its mutations (NPM1wt). No difference was seen between those groups of patients. (C) OS in 105 CN-AML patients divided according to the expression levels of R2 splice variant. (D) OS of the total 201 AML patients divided according to the expression levels of R2. (E) OS in CN-AML patients divided into four groups according to the expression levels of R2 and FLT3-ITD mutational status: R2high/noFLT3-ITD R2low/noFLT3-ITD, R2low/FLT3-ITD, R2high/FLT3-ITD and CEBPAdm cases. (F) OS in CN-AML patients divided into four groups according to the NPM1 and FLT3-ITD mutational status: NPM1mut/noFLT3-ITD, NPM1wt/noFLT3-ITD, NPM1wt/FLT3-ITD, NPM1mut/FLT3-ITD with additional group of CEBPAdm.
Evaluation of R2 expression in a large AML cohort (n=201 cases)
Based on these findings suggesting a biological and clinical role for the R2 splice variant, we decided to extend our cohort by an additional 97 AML patients in order to obtain a larger AML cohort (n=201) that will allow meaningful subgroup analyses. First, we confirmed that the expression of splice variant R2 was significantly higher in all AML patients (n=201) compared to HVs with a median expression of 1.64 vs 0.33 (p=0.009) (Figure 3A). While in the first cohort of CN-AML expression of R2 tended to be elevated in NPM1mut compared to NPM1wt, in the entire cohort of CN-AML (n=105) we found a similar trend between these groups (1.21 vs 0.82; p=0.13, respectively) (Figure 3B).
In the combined data set, high R2 splice variant expression was also associated with longer OS when CN-AML patients (n=105) were considered (880 vs 438 days, p=0.03) (Figure 3C), but there was no significant impact on OS in case of high or low R2 expression across all AML patients (n=201) (756 vs 669; p=0.46) (Figure 3D). We analyzed the relevance of R2 high expression and FLT3-ITD mutations in CN-AML by comparing R2high/noFLT3-ITD, R2low/noFLT3-ITD, R2low/FLT3-ITD, R2high/FLT3-ITD. From these four groups we were able to discriminate a group with the most favorable prognosis: R2high/noFLT3-ITD (median survival n.r.) and a group with the worst prognosis: R2low/FLT3-ITD (median survival 306 days).
Finally, we reflected our R2 results with regard to the molecularly defined CN-AML groups NPM1mut/noFLT3-ITD, NPM1wt/noFLT3-ITD, NPM1wt/FLT3-ITD and NPM1mut/FLT3-ITD. In our cohort, survival differences between these groups were smaller than between groups stratified according to R2 expression combined with FLT3-ITD mutational status (Figure 3E-3F). The most favorable group according NPM1/FLT3-ITD stratification was NPM1mut/noFLT3-ITD (median survival 2256 days) while NPM1mut/FLT3-ITD represented a group with the worst prognosis (median survival 423 days).
In accordance, in the CN-AML patient cohort univariate analysis revealed R2high/noFLT3-ITD genotype (HR, 0.507; 95%-CI, 0.275 to 0.936; p=0.03), NPM1mut/noFLT3-ITD genotype (HR, 0.515; 95%-CI, 0.273 to 0.97; p=0.004), FLT3-ITD alteration (HR, 1.987; 95%-CI, 1.187 to 3.325; p=0.009), high WBC (HR, 1.007; 95%-CI, 1.002 to 1.013; p=0.006), and age (HR, 1.054; 95%-CI, 1.028 to 1.08, p<0.001), but not gender, CEBPA, NRAS, FLT3-TKD or NPM1 mutations, as significant variables for OS (Table 2). In multivariate analysis including known risk factors (age, WBC, NPM1mut/noFLT3-ITD genotype, FLT3-ITD mutations), in our cohort of CN-AML patients only FLT3-ITD mutations and age represented independent factors associated with shorter OS (HR, 1.954; 95%-CI, 1.167 to 3.271; p=0.011 and HR, 1.054; 95%-CI, 1.028 to 1.081; p<0.001, respectively) (Table 2).
Table 2: Univariate and multivariate analyses of overall survival (OS) in the entire cohort of 105 CN-AML patients
Variable |
Univariate |
Multivariate |
||
|---|---|---|---|---|
HR (95% CI) |
p |
HR (95% CI) |
p |
|
R2high/noFLT3-ITD, vs other genotypes |
0.51 (0.28-0.94) |
0.03 |
0.69 (0.35-1.37) |
0.29 |
Gender, male vs female |
1.04 (0.63-1.71) |
0.89 |
||
Age |
1.05 (1.03-1.08) |
<0.001 |
1.05 (1.03-1.08) |
<0.001 |
WBC |
1.01 (1.00-1.01) |
0.006 |
1.00 (0.99-1.00) |
0.125 |
NPM1 mutation, present vs absent |
0.91 (0.56-1.50) |
0.72 |
||
NPM1mut/noFLT3-ITD, vs other genotypes |
0.52 (0.27-0.97) |
0.04 |
0.63 (0.31-1.27) |
0.19 |
CEBPA mutation, present vs absent |
0.48 (0.21-1.12) |
0.089 |
||
FLT3-ITD mutation, present vs absent |
1.99 (1.19-3.33) |
0.009 |
1.95 (1.17-3.27) |
0.011 |
FLT3-TKD mutation, present vs absent |
0.24 (0.03-1.76) |
0.16 |
||
NRAS mutation, present vs absent |
1.86 (0.95-3.61) |
0.067 |
||
Subcellular localization of NPM1 wildtype, R2 isoform and NPM1 mutant
To test subcellular localization of the NPM1 wildtype, R2 isoform and NPM1 mutant, primary AML patient cells and HEK293 cells were transfected with expression vectors encoding the wildtype, R2 and mutated variant of NPM1 tagged with eGFP. Confocal microscopy showed nucleolar localization of the eGFP-NPM1wt protein and the eGFP-NPM1mut was localized in the cytoplasm, while the R2 splice variant exhibited variable subcellular localization. In AML patient cells eGFP-NPM1 R2 was detected in the nucleoplasm or cytoplasm, whereas in HEK293 cells the R2 variant showed only nucleoplasmic localization (Figure 4A-4B).
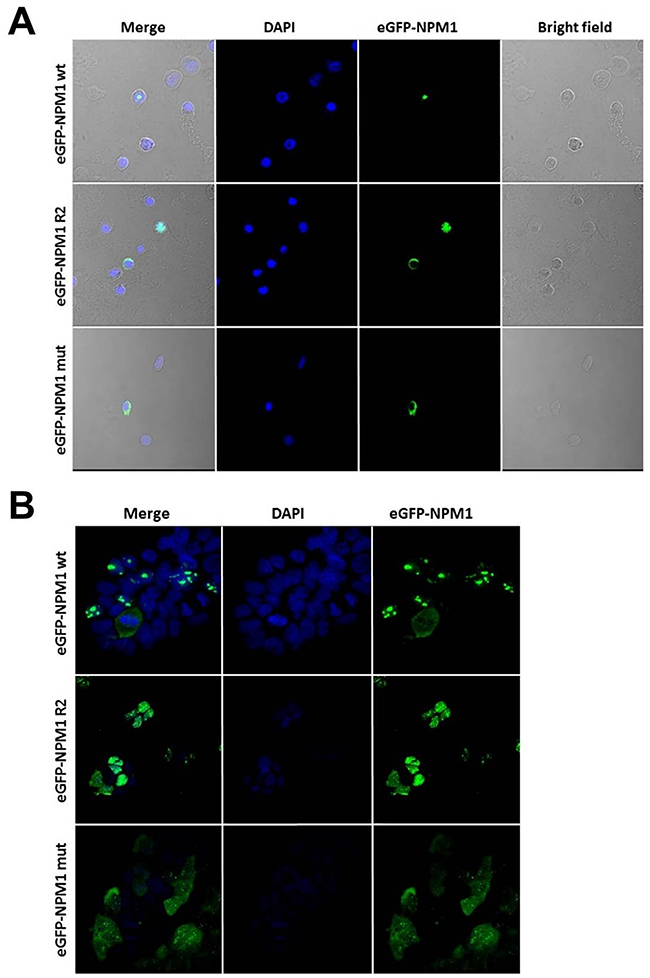
Figure 4: NPM1 wt, R2 and mut show different subcellular localization in AML patient and HEK293 cells. (A) Confocal analysis of AML patient cells transiently transfected with expression vectors for eGFP-NPM1 wt, eGFP-NPM1 R2 or eGFP-NPM1 mut. Transfected cells expressed eGFP-NPM1 fusion proteins (green fluorescence). (B) Confocal analysis of the stable HEK293 cell lines expressing NPM1 variants (NPM1 wt, NPM1 R2 and NPM1 mut) fused with fluorescent GFP tag. Nuclei were stained with DAPI. Images were collected with Nicon Ti confocal microscope.
DISCUSSION
The recent findings of frequent mutations affecting the splicing pathway in myelodysplastic syndrome (MDS) [6, 7] further highlight the importance of the mechanism of alternative splicing, which has been long associated with the development of cancer [5, 36]. Notably, whole exome sequencing of MDS samples identified recurrent mutations in multiple components of the RNA splicing machinery (such as U2AF35, SF3B1, SRSF2 or ZRSR2) [6, 37]. The respective genes were found also mutated in ~26% of therapy-related AML or AML with MDS-related changes, and in ~7% of de novo AML cases [6]. Moreover, in a previous study we could show novel splicing-related mutations, which affected 10% of AML patients in a mutually exclusive manner, thereby pointing to an important role in the molecular pathogenesis of AML [34], which could recently be confirmed in a large AML targeted resequencing study [8]. In the current study, we now determined the expression pattern of NPM1 splice variants in a well-defined cohort of 104 and 97 AML cases. Since NPM1 splice variants have not been extensively studies so far, we focused our interest on the three main splice variants of NPM1. As NPM1 encodes a protein important and frequently mutated in AML development, the expression of its modifications might also be involved in the pathogenesis of AML [38].
Recently, genome-wide microarray analysis using Exon arrays discovered genes significantly spliced in AML [5]. These studies identified novel splice variants specific for AML patients in comparison to normal cells such as NOTCH2, CD13 and FLT3 [9], but also splice variants discriminating leukemia subgroups such as MAPK15 and PLXNB1 [39]. Moreover, evidence was provided that the AML specific “splicing profile” was normalized in remission and recurred with patient relapse [5], thereby supporting a role of deregulated splice variants in the process of leukemogenesis, although many changes observed in this study might also reflect differences in the differentiation of cells.
Implicated in promoting cell growth NPM1 expression increases in response to mitogenic stimuli and above-normal amounts are detected in highly proliferating and malignant cells [40]. In accordance, NPM1 has been reported to be overexpressed at the protein level in various solid tumors [30–33] and in some cases it has been proposed as a cancer-specific marker. Tsui and colleagues [41] showed that the overexpression of NPM1 at the mRNA level is independently associated with the recurrence of bladder carcinoma and progression to the more advanced stage. In our study we found that the expression levels of the splice variants R1, R2 and R3 of the NPM1 gene were elevated compared to HVs suggesting that altered expression of NPM1 splice variants might play a role in the process of tumorigenesis. Moreover, our RNA-seq analysis of certain subpopulation of HVs cells revealed R2 accumulation in less differentiated hematopoietic cells and in blast cells of AML.
With regard to CN-AML subgroups, our study demonstrated a favorable impact of high expression of the R2 splice variant on outcome. From the entire group of CN-AML patients, those with high R2 expression had a significantly longer OS compared to patients with low R2 expression levels. Similarly, our results suggest that the expression of R2 may allow the dissection of CN-AML patients into prognostically different subgroups. As the R2 splice variant represents a truncated form of the NPM1 gene lacking exons 11 and 12 (coding for the domain responsible for nucleolar localization of the protein), this isoform is mostly localized in the nucleoplasm and/or cytoplasm [29] and thus might also have a biological impact in the malignant cells. Therefore, R2 might interact with nuclear proteins affecting signal pathways and thereby have an impact on the biology of the disease, which in turn is reflected in differences in treatment response and outcome. As the localization of the protein seems to be crucial for its functioning, we evaluated the impact of NPM1wt, R2 variant and NPM1mut expression in HEK293 and primary AML patient cells. Confocal microscopy showed nucleolar localization of the eGFP-NPM1wt protein, whereas the eGFP-NPM1mut was localized in the cytoplasm. The question is now, whether the subcellular localization of the R2 splice variant in the nucleoplasm and/or cytoplasm compared to the nucleolar localization of the wt variant does also contribute to altered gene expression.
While NPM1 mutations have recently been shown to be also associated with differential expression of miRNAs [42, 43] aberrant expression of NPM1 splice variants might in turn affect its translational regulation via miRNAs in AML.
In recent years several studies described a higher frequency of FLT3 mutations in the group of NPM1mut, suggesting a possible pathogenic link between these mutations [12, 14, 38], and patients without concomitant FLT3-ITD were shown to have a better prognosis [12, 14, 15, 38]]. In line with the NPM1 mutational status in our study survival curves demonstrated only a favorable impact of R2 expression in patients without FLT3-ITD. Notably, in our cohort survival differences seen between molecular mutation-defined groups according to a NPM1/FLT3-ITD stratification were less pronounced than between groups stratified according to R2 expression combined with FLT3-ITD mutational status. While we of course only studied a limited number of cases, based on our observations nevertheless additional studies are warranted to further evaluate the impact of R2 splice variant in AML. Our findings suggest that the analysis of splice variants might be added to the risk-classification of AML and could be also explored as novel biomarkers. With that regard, novel technological advances such as RNA-seq will provide valuable novel insights [44].
In summary, the expression of NPM1 splice variants might be of biological importance in AML, especially in CN-AML patients, and future studies will have to further explore the prognostic value of the R2 splice variant expression in the light of the genomic AML landscape.
MATERIALS AND METHODS
Patient samples
Two independent cohorts of peripheral blood and/or bone marrow samples from adult Caucasian AML patients at diagnosis were provided by the German-Austrian AML Study Group (AMLSG) with patient informed consent and institutional review board approval from all participating centers. The first data set comprised 104 samples (including 52 CN-AML cases) from the AML HD98A (n=90, NCT00146120) and HD98B (n=14, NCT00151242) trials, and the second cohort contained 97 samples (including 53 CN-AML cases) from the AMLSG 07-04 study (NCT00151242). In the entire cohort of 201 patients samples 162 samples were obtained from bone marrow (bone marrow mononuclear cells, BMMC) and when bone marrow was not reached samples were taken from peripheral blood (peripheral blood mononuclear cells, PBMC) (the rest of 39 samples). As these two groups represent different compartments of cellular composition we performed R2 expression evaluation in both groups to see if there is significant difference between them. We have not observed any changes in R2 expression between BMMC and PBMC groups (median 1.78 vs 1.52, p=0.66) (Supplementary Figure 1E).
Peripheral blood samples were taken from six healthy volunteers (HVs) with informed consent with respect to the use of their samples for scientific purposes.
Cell isolation
PBMCs or BMMCs were isolated by Ficoll (Biochrom AG, Berlin, Germany) density gradient centrifugation. The viability of MCs was always >80%, as determined by trypan blue staining. The viable cells were quantified in a Neubauer chamber (Zeiss, Oberkochen, Germany) and stored for RNA isolation in liquid nitrogen.
mRNA preparation and reverse transcription
For the isolation of mRNA from PBMCs and BMMCs, the QIAamp RNA Blood Mini Kit (Qiagen, Venlo, Netherlands) was used according to the manufacturer’s instructions and RNA quality were assessed by gel electrophoresis. Reverse transcription was done with SuperScript III First-Strand Synthesis System for RT-PCR (Invitrogen, Life Technologies Corporation, Carlsbad, CA, USA) using random hexamers and following the manufacturer’s protocol. One μg of RNA was reverse transcribed into 40 μl of cDNA and diluted with water in ratio 1:1. For each quantitative reverse transcriptase polymerase chain reaction (qRT-PCR) 5 μl of the cDNA preparation was used.
qRT-PCR for NPM1 splice variants
For the quantitative measurement of the mRNA expression of NPM1 splice variants qRT-PCR was performed with the Fast SYBR Green Master Mix (Applied Biosystems, Life Technologies Corporation, Carlsbad, CA, USA) according to the manufacturer’s protocol using a 7900HT Fast Real-Time PCR System (Applied Biosystems, Life Technologies Corporation, Carlsbad, CA, USA) in the fast mode. β-actin (ACTB) was used as a reference gene. All primers were tested for sensitivity and specificity by conventional PCR and qRT-PCR, resulting in one amplicon of the correct size and one clear peak in the dissociation curve. Samples were assayed in duplicates and reference gene ACTB was used for data normalization (see above). Quantity mean values of gene expression were calculated according to the Standard Curve method. For the standard curves, dilution series of cDNA of HeLa cells (for ACTB) and Kasumi-1 cells (for NPM1 splice variants) were used. Data were analyzed using SDS 2.3 software (Applied Biosystems, Life Technologies Corporation, Carlsbad, CA, USA) and visualized using GraphPad Prism 5 (GraphPad Software, La Jolla, CA).
Western blot analysis
To evaluate the translation of different NPM1 splice variants, Western blot analysis was performed. Protein extracts from seven cell lines: NB-4 (ACC 207), KG-1 (ACC 14), OCI-AML3 (ACC 582), ME-1 (ACC 537), Kasumi-1 (ACC 220) (DSMZ, Braunschweig, Germany), HEK-293 (ATCC CRL-1573) and K-562 (ATCC CCL-243) (ATCC, Rockville, USA) and CD33+ (CD33 MicroBeads, Miltenyl Biotec) cells from 4 AML patients were run on precast 10% NuPAGE® Bis-Tris Gel (Invitrogen, Life Technologies Corporation, Carlsbad, CA, USA) in MOPS running buffer (Invitrogen, Life Technologies Corporation, Carlsbad, CA, USA), transferred to nitrocellulose membrane (Biorad) and incubated with anti-NPM1 (#3542, Cell Signaling) and anti-β-actin antibodies (#4970,Cell Signaling) or α-tubulin (#2125,Cell Signaling), (β-actin and α-tubulin were used as a loading control). For detection, horseradish peroxidase (HRP)-coupled secondary antibody (#7074, Cell Signaling, Beverly, MA, USA) was used followed by chemiluminescence detection using laboratory fresh-made reagent: 100mM TRIS (pH 8,5), luminol (250 mM), coumaric acid (90mM), hydrogen peroxide 30% and visualized with a X-ray film developing machine.
The quantification of reads in RNA-seq samples
To access the expression of R2 splice variant we analyzed ten transcriptomes of cytogenetically normal AML and FACS-sorted bone marrow samples of three healthy individuals. Bone marrow of healthy donors was sorted by FACS as previously described [35]. Diagnostic AML samples were collected from 10 adult patients with cytogenetically normal karyotype enrolled on German-Austrian AML Study Group (AMLSG) treatment protocols for younger adults [AMLSG 07-04 (NCT00151242)]. Written informed consent was obtained from all patients and healthy donors, and the gene expression study was approved by the IRB.
Total RNA was isolated using AllPrep DNA/RNA Kit (Qiagen). RNA integrity was assessed on Agilent Bioanalyzer using Agilent RNA 6000 Pico or Agilent RNA 6000 Nano Kit (Agilent Technologies) and samples with RNA integrity number (RIN) of at least 7.5 were selected for RNA-seq. A total of 1 μg of RNA was rRNA depleted and sequencing libraries were obtained using Ribo-Zero Gold rRNA Removal Kit (human; Illumina) according the manufacturer protocol. The transcriptomes were sequenced on HiSeq2500 (Illumina) and on average 63.2 million reads were obtained per sample. The reads were aligned to reference genome ucsc.hg19 using STAR aligner [45]. Reads mapping to the unique exon of R2 NPM1 with the coordinates chr5:170833400-170833731 of hg19 were quantified using bedtools with options intersect and split. The counts were RPKM normalized, log2 transformed and plotted in GraphPadPrism software.
Cell culture and nucleofection
Human embryonic kidney cells (HEK293) (ATCC CRL-1573) and PBMCs from AML patient were cultured at 37°C and 5% CO2 in DMEM/F-12 and RPMI 1640 medium (Biochrom, Berlin, Germany), respectively, supplemented with 10% fetal bovine serum. 1×10⁶ of HEK293 cells were nucleofected using Amaxa Cell Line Nucleofector® Kit V (Lonza Group, Walkersville, MD) and 4 μg of plasmid DNA, strictly according to the manufacturer’s protocol. The stable cell lines expressing NPM1 variants (NPM1wt, NPM1 R2 and NPM1mut, described fully in following chapter) fused with fluorescent GFP tag were established in the presence of G-418 (400 μg/ml) in the media for two weeks. The patient cells were collected by centrifugation and resuspended at 8 × 10⁶ cells/100 μl for primary AML cells in the Human B Nucleofector® Kit solution (Amaxa Biosystems, Cologne, Germany). PBMCs were nucleofected with 4 μg of appropriate plasmid using the U-013 program of the Nucleofection Device II (Amaxa Biosystems). The nucleofected cells were cultured at 37°C for 1 day and used for immunofluorescence staining (described in Confocal imaging section).
Genetic constructs
The GFP-NPM WT expressing plasmid (gift from Xin Wang, Addgene plasmid #17578) [46] were used for creating NPM1 variants (NPM1wt, NPM1 R2 and NPM1mut) using site directed mutagenesis. The PCR primers were designed to generate addition or substitution of specific regions in the NPM1 gene sequence. The sequences of primers used for the mutation were listed in Supplementary Table 1. The PCR products were performed using a high-fidelity polymerase (KOD-Xtreme Hot-start, Millipore; PCR conditions: 1. polymerase activation 94°C 2 min; 2. denaturation 98°C 10 s; 3. annealing 57° 30 s; 4. extension 68° 6 min 45 s). The PCR products were purified by ethanol precipitation followed by DpnI (New England Biolabs, NEB) digestion of the template plasmid.100 ng of the linear PCR product, DpnI-treated and purified on Clean-up columns (A&A) were ligated by Gibson Assembly cloning (NEB) mix following the manufacturers’ protocol. The resulted constructs were introduced into E.coli DH10B by electroporation (Eporator, Eppendorf). The single cell colonies growing on kanamycin LB-agar were subjected to colony PCR. Appropriate plasmids were isolated (ExtractMe Plasmid Maxi endotoxin-free kit, Blirt) and verified by sequencing service (Genomed S.A.) using sequencing primers (Supplementary Table 1), and used in transfection/nucleofection procedures.
Confocal imaging
HEK293 adherent cells were seeded onto eight-well chamber slides (Thermo Scientific™ Nunc™ Lab-Tek™ II Chamber Slide™) and allowed to adhere to the slide (16 hours) before they were fixed with 4% paraformaldehyde or cold (−20°C) methanol. The cells after PBS (Biochrom, Berlin, Germany) washing, were mounted, counterstained with DAPI, and visualized under Nikon Ti confocal microscope (Sendai Nikon Corporation, Miyagi, Japan).
Nucleofected PBMCs grown in suspension were collected, fixed for 20 min in PBS containing 4% parafomaldehyde. The cells were then centrifuged, washed in deionized water and resuspended in 200 μl deionized water. The cells were smeared on adhesion slides (Menzel-Gläser Polysine Slides, Thermo Scientific), dried and washed with water for eliminating the crystals. The cells were then once again washed in PBS, mounted, stained with DAPI and examined by confocal microscopy.
Statistical analysis
All results are presented as median values. Pairwise comparisons between patient characteristics were performed by Mann-Whitney test for continuous variables and by Fisher’s exact test for categorical variables. Survival curves were calculated for overall survival (OS), event-free survival (EFS) and relapse-free survival (RFS) according to Kaplan-Meier and compared using the two-sided long rank test. A Cox model with stratification to account for treatment intensity was used to identify prognostic variables: in addition to NPM1 splice variants age, WBC count, cytogenetic risk groups, as well as NPM1 mutations, CEBPA double mutations (dm) and FLT3-ITD added as explanatory variables in all regression analyses. To provide quantitative information on the relevance of results, 95% confidence intervals (95% CIs) of hazard ratios (HRs) were computed. Statistical analyses were performed using GraphPad Prism 5 (GraphPad Software, La Jolla, CA) and PASW Statistics 18 (SPSS). P-values <.05 were considered to indicate statistical significance.
Abbreviations
AML (acute myeloid leukemia), CN-AML (cytogenetically normal-AML), NPM1 (nucleophosmin-1), FLT3-ITD (FMS-like tyrosine kinase 3-internal tandem duplication), AMLSG (German-Austrian AML Study Group), HVs (healthy volunteers), PBMCs (peripheral blood mononuclear cells), BMMCs (bone marrow mononuclear cells), qRT-PCR (quantitative reverse transcriptase polymerase chain reaction), ACTB (β-actin), OS (overall survival), EFS (event-free survival), RFS (relapse-free survival), 95% CIs (95% confidence intervals), HRs (hazard ratios), MDS (myelodysplastic syndrome).
Author contributions
KG and LB designed the research. MZ, AD, KG and LB analyzed data and wrote the paper. MZ, AD, GS, JZ, MK, JC, MS, SCC, OJL, EGM, RCS performed the research. AD performed NGS analysis. HD, RFS, KD, LB recruited patients and provided clinical data. MZ, AD, GS, JZ, MK, JC, MS, SCC, EGM, RCS, OJL, RFS, HD, KD, AS, LB and KG discussed results. AS designed and discussed functional study. GS, JZ, MK, JC performed and discussed functional study.
CONFLICTS OF INTEREST
The authors declare no conflicts of interest.
FUNDING
This work is based on the National Centre for Science Grant HARMONIA support UMO-2013/10/M/NZ5/00313 and in part supported by an educational grant of the Medical University of Lublin (DS 462), by the German Research Foundation (Heisenberg-Professor BU 1339/8-1 and SFB 1074 project B03), and by a grant of the Medical Faculty of the University of Ulm (L.SBN.0095). MZ was supported by the European Program for Cooperation in Science and Technology (COST, Action BM0801), EGM was supported by EU program: FP7-REGPOT-2012-CT2012-316254-BASTION.
REFERENCES
1. Döhner H, Weisdorf DJ, Bloomfield CD. Acute myeloid leukemia. N Engl J Med. 2015; 373: 1136–52.
2. Cancer Genome Atlas Research Network. Genomic and epigenomic landscapes of adult de novo acute myeloid leukemia. N Engl J Med. 2013; 368: 2059–74.
3. Haferlach C, Kern W, Schindela S, Kohlmann A, Alpermann T, Schnittger S, Haferlach T. Gene expression of BAALC, CDKN1B, ERG, and MN1 adds independent prognostic information to cytogenetics and molecular mutations in adult acute myeloid leukemia. Genes Chromosomes Cancer. 2012; 51: 257–65.
4. Theilgaard-Mönch K, Boultwood J, Ferrari S, Giannopoulos K, Hernandez-Rivas JM, Kohlmann A, Morgan M, Porse B, Tagliafico E, Zwaan CM, Wainscoat J, Van den Heuvel-Eibrink MM, Mills K, et al. Gene expression profiling in MDS and AML: potential and future avenues. Leukemia. 2011; 25: 909–20.
5. Pajares MJ, Ezponda T, Catena R, Calvo A, Pio R, Montuenga LM. Alternative splicing: an emerging topic in molecular and clinical oncology. Lancet Oncol. 2007; 8: 349–57.
6. Yoshida K, Sanada M, Shiraishi Y, Nowak D, Nagata Y, Yamamoto R, Sato Y, Sato-Otsubo A, Kon A, Nagasaki M, Chalkidis G, Suzuki Y, Shiosaka M, et al. Frequent pathway mutations of splicing machinery in myelodysplasia. Nature. 2011; 478: 64–9.
7. Papaemmanuil E, Cazzola M, Boultwood J, Malcovati L, Vyas P, Bowen D, Pellagatti A, Wainscoat JS, Hellstrom-Lindberg E, Gambacorti-Passerini C, Godfrey AL, Rapado I, Cvejic A, et al. Somatic SF3B1 mutation in myelodysplasia with ring sideroblasts. N Engl J Med. 2011; 365: 1384–95.
8. Papaemmanuil E, Gerstung M, Bullinger L, Gaidzik VI, Paschka P, Roberts ND, Potter NE, Heuser M, Thol F, Bolli N, Gundem G, Van Loo P, Martincorena I, et al. Genomic classification and prognosis in acute myeloid leukemia. N Engl J Med. 2016; 374: 2209–21.
9. Adamia S, Haibe-Kains B, Pilarski PM, Bar-Natan M, Pevzner S, Avet-Loiseau H, Lode L, Verselis S, Fox EA, Burke J, Galinsky I, Dagogo-Jack I, Wadleigh M, et al. A genome-wide aberrant RNA splicing in patients with acute myeloid leukemia identifies novel potential disease markers and therapeutic targets. Clin Cancer Res. 2014; 20: 1135–45.
10. Döhner H, Estey EH, Amadori S, Appelbaum FR, Büchner T, Burnett AK, Dombret H, Fenaux P, Grimwade D, Larson RA, Lo-Coco F, Naoe T, Niederwieser D, et al. Diagnosis and management of acute myeloid leukemia in adults: recommendations from an international expert panel, on behalf of the European LeukemiaNet. Blood. 2010; 115: 453–74.
11. Arber DA, Orazi A, Hasserjian R, Thiele J, Borowitz MJ, Le Beau MM, Bloomfield CD, Cazzola M, Vardiman JW. The 2016 revision to the World Health Organization classification of myeloid neoplasms and acute leukemia. Blood. 2016; 127: 2391–405.
12. Döhner K, Schlenk RF, Habdank M, Scholl C, Rücker FG, Corbacioglu A, Bullinger L, Fröhling S, Döhner H. Mutant nucleophosmin (NPM1) predicts favorable prognosis in younger adults with acute myeloid leukemia and normal cytogenetics: interaction with other gene mutations. Blood. 2005; 106: 3740–6.
13. Falini B, Mecucci C, Tiacci E, Alcalay M, Rosati R, Pasqualucci L, La Starza R, Diverio D, Colombo E, Santucci A, Bigerna B, Pacini R, Pucciarini A, et al. Cytoplasmic nucleophosmin in acute myelogenous leukemia with a normal karyotype. N Engl J Med. 2005; 352: 254–66.
14. Thiede C, Koch S, Creutzig E, Steudel C, Illmer T, Schaich M, Ehninger G. Prevalence and prognostic impact of NPM1 mutations in 1485 adult patients with acute myeloid leukemia (AML). Blood. 2006; 107: 4011–20.
15. Schnittger S, Schoch C, Kern W, Mecucci C, Tschulik C, Martelli MF, Haferlach T, Hiddemann W, Falini B. Nucleophosmin gene mutations are predictors of favorable prognosis in acute myelogenous leukemia with a normal karyotype. Blood. 2005; 106: 3733–9.
16. Borer RA, Lehner CF, Eppenberger HM, Nigg EA. Major nucleolar proteins shuttle between nucleus and cytoplasm. Cell. 1989; 56: 379–90.
17. Yun JP, Chew EC, Liew CT, Chan JY, Jin ML, Ding MX, Fai YH, Li HK, Liang XM, Wu QL. Nucleophosmin/B23 is a proliferate shuttle protein associated with nuclear matrix. J Cell Biochem. 2003; 90: 1140–8.
18. Herrera JE, Savkur R, Olson MO. The ribonuclease activity of nucleolar protein B23. Nucleic Acids Res. 1995; 23: 3974–9.
19. Levine AJ. P53, the cellular gatekeeper for growth and division. Cell. 1997; 88: 323–31.
20. Kurki S, Peltonen K, Laiho M. Nucleophosmin, HDM2 and p53: players in UV damage incited nucleolar stress response. Cell Cycle. 2004; 3: 976–9.
21. Kurki S, Peltonen K, Latonen L, Kiviharju TM, Ojala PM, Meek D, Laiho M. Nucleolar protein NPM interacts with HDM2 and protects tumor suppressor protein p53 from HDM2-mediated degradation. Cancer Cell. 2004; 5: 465–75.
22. Garzon R, Garofalo M, Martelli MP, Briesewitz R, Wang L, Fernandez-Cymering C, Volinia S, Liu C, Schnittger S, Haferlach T, Liso A, Diverio D, Mancini M, et al. Distinctive microRNA signature of acute myeloid leukemia bearing cytoplasmic mutated nucleophosmin. Proc Natl Acad Sci U S A. 2008; 10: 3945–50.
23. Alcalay M, Tiacci E, Bergomas R, Bigerna B, Venturini E, Minardi SP, Meani N, Diverio D, Bernard L, Tizzoni L, Volorio S, Luzi L, Colombo E, et al. Acute myeloid leukemia bearing cytoplasmic nucleophosmin (NPMc+ AML) shows a distinct gene expression profile characterized by up-regulation of genes involved in stem-cell maintenance. Blood. 2005; 106: 899–902.
24. Alharbi RA, Pettengell R, Pandha HS, Morgan R. The role of HOX genes in normal hematopoiesis and acute leukemia. Leukemia. 2013; 5: 1000–8.
25. Haferlach C, Mecucci C, Schnittger S, Kohlmann A, Mancini M, Cuneo A, Testoni N, Rege-Cambrin G, Santucci A, Vignetti M, Fazi P, Martelli MP, Haferlach T, et al. AML with mutated NPM1 carrying a normal or aberrant karyotype show overlapping biologic, pathologic, immunophenotypic, and prognostic features. Blood. 2009; 114: 3024–32.
26. Heath E, Chan SM, Minden MD, Murphy T, Shlush LI, Schimmer AD. Biological and clinical consequences of NPM1 -mutations in AML. Leukemia. 2017; 4: 798–807.
27. Wang D, Umekawa H, Olson MO. Expression and subcellular locations of two forms of nucleolar protein B23 in rat tissues and cells. Cell Mol Biol Res. 1993; 39: 33–42.
28. Dalenc F, Drouet J, Ader I, Delmas C, Rochaix P, Favre G, Cohen-Jonathan E, Toulas C. Increased expression of a COOH-truncated nucleophosmin resulting from alternative splicing is associated with cellular resistance to ionizing radiation in HeLa cells. Int J Cancer. 2002; 100: 662–8.
29. Colombo E, Martinelli P, Zamponi R, Shing DC, Bonetti P, Luzi L, Volorio S, Bernard L, Pruneri G, Alcalay M, Pelicci PG. Delocalization and destabilization of the Arf tumor suppressor by the leukemia-associated NPM mutant. Cancer Res. 2006; 66: 3044–50.
30. Tanaka M, Sasaki H, Kino I, Sugimura T, Terada M. Genes preferentially expressed in embryo stomach are predominantly expressed in gastric cancer. Cancer Res. 1992; 52: 3372–7.
31. Nozawa Y, Van Belzen N, Van der Made AC, Dinjens WN, Bosman FT. Expression of nucleophosmin/B23 in normal and neoplastic colorectal mucosa. J Pathol. 1996; 178: 48–52.
32. Shields LB, Gerçel-Taylor C, Yashar CM, Wan TC, Katsanis WA, Spinnato JA, Taylor DD. Induction of immune responses to ovarian tumor antigens by multiparity. J Soc Gynecol Investig. 1997; 4: 298–304.
33. Subong EN, Shue MJ, Epstein JI, Briggman JV, Chan PK, Partin AW. Monoclonal antibody to prostate cancer nuclear matrix protein (PRO:4-216) recognizes nucleophosmin/B23. Prostate. 1999; 39: 298–304.
34. Dolnik A, Engelmann JC, Scharfenberger-Schmeer M, Mauch J, Kelkenberg-Schade S, Haldemann B, Fries T, Krönke J, Kühn MW, Paschka P, Kayser S, Wolf S, Gaidzik VI, et al. Commonly altered genomic regions in acute myeloid leukemia are enriched for somatic mutations involved in chromatin remodeling and splicing. Blood. 2012; 120: e83–92.
35. Sun SM, Dijkstra MK, Bijkerk AC, Brooimans RA, Valk PJ, Erkeland SJ, Löwenberg B, Jongen-Lavrencic M. Transition of highly specific microRNA expression patterns in association with discrete maturation stages of human granulopoiesis. Br J Haematol. 2011; 155: 395–8.
36. David CJ, Manley JL. Alternative pre-mRNA splicing regulation in cancer: pathways and programs unhinged. Genes Dev. 2010; 24: 2343–64.
37. Makishima H, Visconte V, Sakaguchi H, Jankowska AM, Kar SA, Jerez A, Przychodzen B, Bupathi M, Guinta K, Afable MG, Sekeres MA, Padgett RA, Tiu RV, et al. Mutations in the spliceosome machinery, a novel and ubiquitous pathway in leukemogenesis. Blood. 2015; 119: 3203–11.
38. Grisendi S, Mecucci C, Falini B, Pandolfi PP. Nucleophosmin and cancer. Nat Rev Cancer. 2006; 6: 493–505.
39. Risueño A, Roson-Burgo B, Dolnik A, Hernandez-Rivas JM, Bullinger L, De Las Rivas J. A robust estimation of exon expression to identify alternative spliced genes applied to human tissues and cancer samples. BMC Genomics. 2014; 15: 879.
40. Falini B, Martelli MP, Bolli N, Sportoletti P, Liso A, Tiacci E, Haferlach T. Acute myeloid leukemia with mutated nucleophosmin (NPM1): is it a distinct entity? Blood. 2011; 117: 1109–20.
41. Tsui KH, Cheng AJ, Chang PL, Pan TL, Yung BY. Association of nucleophosmin/B23 mRNA expression with clinical outcome in patients with bladder carcinoma. Urology. 2004; 64: 839–44.
42. Russ AC, Sander S, Luck SC, Lang KM, Bauer M, Rucker FG, Kestler HA, Schlenk RF, Dohner H, Holzmann K, Dohner K, Bullinger L. Integrative nucleophosmin mutation-associated microRNA and gene expression pattern analysis identifies novel microRNA - target gene interactions in acute myeloid leukemia. Haematologica. 2011; 96: 1783–91.
43. Becker H, Marcucci G, Maharry K, Radmacher MD, Mrozek K, Margeson D, Whitman SP, Wu YZ, Schwind S, Paschka P, Powell BL, Carter TH, Kolitz JE, et al. Favorable prognostic impact of NPM1 mutations in older patients with cytogenetically normal de novo acute myeloid leukemia and associated gene- and microRNA-expression signatures: a Cancer and Leukemia Group B Study. J Clin Oncol. 2010; 28: 596–604.
44. Ozsolak F, Milos PM. RNA sequencing: advances, challenges and opportunities. Nat Rev Genet. 2011; 12: 87–98.
45. Dobin A, Davis CA, Schlesinger F, Drenkow J, Zaleski C, Jha S, Batut P, Chaisson M, Gingeras TR. STAR: ultrafast universal RNA-seq aligner. Bioinformatics. 2013; 29: 15–21.
46. Wang W, Budhu A, Forgues M, Wang XW. Temporal and spatial control of nucleophosmin by the Ran-Crm1 complex in centrosome duplication. Nat Cell Biol. 2005; 7: 823–30.