
Introduction to IHC and FISH
The advent of modern laboratory techniques have been instrumental in shaping medicine. These techniques serve as the means to acquire an in-depth knowledge of numerous pathological processes, and have expanded the role of medical laboratories beyond simple diagnostics. It is now possible to obtain reliable prognostic information for several disease processes. Furthermore, the outcome of treatment with particular therapeutic regimens can often be predicted with some certainty.
The concept of IHC was first introduced by Coons in 1941 [1]. This technique involves a multi-stage procedure for tissue fixation followed by interpretation of findings [2]. It detects specific antigens in histologic specimens with the use of target-specific antibodies coupled with colorimetric or fluorescent reagents, facilitating anatomical localization of proteins and phosphoproteins, in situ [3].
IHC is an important ancillary technique that is used for accomplishing a wide range of goals in modern laboratories including the studying the pathogenesis of several disease processes [4, 5]. It is frequently used to characterize many types of neoplasms, thus providing a histologic diagnosis and appropriate subtype of tumor. It can also assist in distinguishing between benign and malignant cell populations for certain tissues. Furthermore, it is used for determining the distribution and differential expression of particular biomarkers in a tissue specimen. This in-turn provides vital information for guiding the decision making process in terms of patient treatment [6–9].
In situ hybridization (ISH) was first described in the year 1969 by Joseph G. Gall [10]. Fluorescent ISH (FISH) is a variant of ISH that utilizes DNA probes that anneal with target gene sequences [11]. The DNA probes are labeled with fluorescent markers that allow detection of hybridization through fluorescence microscopy. This permits the identification of specific genomic aberrations in the sample DNA [11]. RNA in situ hybridization (RNA ISH) is another variant of ISH that is used for the detection of RNA sequences of interest [12, 13].
ISH is a fundamental technique that is commonly used for diagnostic and research purposes while FISH is routinely used to diagnose genetic diseases. FISH also serves an important role in diverse research domains such as documentation of novel oncogenes and gene mapping [11]. RNA ISH has enabled the detection of intracellular molecules such as messenger-RNA (mRNA) and micro-RNA (miRNA) [14, 15]. This has proven to be of significance in studies focused on understanding the pathogenesis of various malignancies [14, 16].
Although IHC and ISH have numerous advantages, the use of these techniques has been associated with certain limitations. The skills of the personnel involved in performing and interpreting IHC is a key factor governing the accuracy and reproducibility of this procedure [6, 8, 17]. The procedure can be associated with reaction bias when performing certain steps, including antigen retrieval and specimen fixation. Notably, antibodies may recognize similar epitopes on different protein targets, which can produce false positives. Interpretation bias is also possible when selecting an antibody panel and analyzing the results [18]. The use of FISH is also restricted by the availability of the probe, since the genetic aberration must be known hybridize the complimentary DNA/RNA sequence. For this reason, FISH cannot be utilized as a screening test for chromosomal aberrations [11, 19, 20]. Also notable, the size of a genomic aberration can also be a limiting factor [21]. Ultimately, utilizing ISH followed by IHC facilitates the complementary confirmation of RNA and protein signals, which provides assurance for questionable targets.
Several modifications to ISH and IHC have improved their accuracy over time [11, 22]. These modifications, combined with efforts such as the establishment of American Society of Clinical Oncology (ASCO) and College of American Pathologists (CAP) guidelines for HER2 testing in breast cancer and a standardized FDA approved IHC scoring system, have aided in increasing the clinical utility of these procedures [23].
The ability of IHC and FISH to identify specific molecular targets may potentially serve a role in identifying biomarkers with predictive, diagnostic and/or prognostic significance [24, 25]. This review will evaluate the role of IHC and FISH in predicting the response to treatment with targeted therapeutic agents. We will primarily focus on past studies that employed therapeutic agents against HER2, EGFR and PD-L1 in an attempt to analyze both successful and failed efforts that used IHC and/or FISH as predictive biomarkers for the success of these agents. Learning from the cases wherein predictive biomarkers have been successfully approved, we will explore the current scenario for biomarker development in FGFR and cMET targeted therapy. Our goal is to provide a better understanding of the use of IHC and FISH as predictive biomarkers, in order to improve the decision-making process concerning targeted therapy utilization for personalized cancer therapy.
Need for robust predictive biomarkers
The concept of targeted cancer therapy aims at creating agents that agonize, antagonize or neutralize specific molecules on cancer cells. Certain tumors overexpress particular molecules that may be critical for survival, growth, proliferation or metastases of malignant tissues [26–28]. Various therapeutic agents such as tyrosine kinase inhibitors and growth inhibitory antibodies selectively target these molecules and eliminate sensitive cancer cell populations [29]. To maximize the clinical benefit of targeted therapy, it is crucial to accurately diagnose the presence of specific target molecules. IHC and FISH are considered as standard testing modalities for the evaluation of HER2 status in breast cancer cases, as per the ASCO/CAP 2013 recommendations [30]. Additionally, IHC and FISH have proven to be of value in determining the prognosis and predicting the response to therapy for agents targeting EGFR and PD-L1 [31–34]. The search for potential predictive biomarkers has been diversified to include anti-FGFR and anti-cMET targeted therapy agents.
Trastuzumab/lapatinib in breast and gastric cancer
HER2 is overexpressed and/or amplified in several types of tumors including 10 – 30% of gastric and gastroesophageal cancers, and 15 – 30% of breast cancer [35]. Other tumors that may possess increased HER2 levels include bladder-, head and neck-, ovarian-, endometrial-, colon-, lung- and uterine/cervical-cancers [27, 28, 36–40]. Similar findings from numerous other studies prompted the development of agents that specifically targeted HER2.
Trastuzumab is a monoclonal antibody specific to HER2 [41]. It inhibits PI3K/Akt and ras-Raf-MAPK signaling pathways by decreasing HER2 activity [42]. A review of data obtained from eight randomized controlled trials (RCTs) evaluating the use of trastuzumab in locally advanced breast cancer showed a hazard ratio (HR) for disease free survival (DFS) to be 0.60 (95% confidence interval (CI) 0.50 - 0.71, P<0.00001), and overall survival (OS) as 0.66 (95% CI 0.57 - 0.77, P<0.00001), strongly favoring treatment regimens utilizing trastuzumab [43]. A different trial, comparing the combination of doxorubicin, cyclophosphamide and docetaxel (AC-T) with combination docetaxel, carboplatin and trastuzumab (ACH), as well as AC-T plus trastuzumab in patients with HER2 positive early stage breast cancer, showed a considerable clinical benefit with the use of trastuzumab. The reported DFS rate at 5 years was 84% in the AC-T plus trastuzumab group, 81% in the TCH group and 75% in the AC-T only group. The OS rate was 92% in the AC-T plus trastuzumab group, 91% in the TCH group and 87% in the AC-T only group [44]. Another trial, called the joint analysis of National Surgical Adjuvant Breast and Bowel Project (NSABP B-31) and North Central Cancer treatment group (NCCTG N9831), compared combination doxorubicin, cyclophosphamide and paclitaxel with the same regimen plus trastuzumab. It showed a relative improvement in OS by 37% (HR of 0.63, 95% CI 0.54 - 0.73 and P<0.001) and an improvement in 10 year OS rate to 84% from 75.2% in the latter group. Additionally, the DFS improved by 40% (HR of 0.60, 95% CI 0.53 - 0.68 and P<0.001) and the 10 year DFS rate increased to 73.7% from 62.2% in the chemotherapy plus trastuzumab group [45]. Thus, it was evident that adjuvant trastuzumab therapy was associated with the improvement in OS and DFS. On the basis of the above and other similar evidence, the Food and Drug Administration (FDA) approved the use of trastuzumab as an adjuvant therapy agent for HER2 positive breast cancer in the year, 2006.
The key to achieving maximum therapeutic benefit with trastuzumab is an accurate diagnosis of HER2 overexpression and/or amplification. In view of this objective, ASCO/CAP issued guidelines for breast cancer in the year 2007 [46]. However, it was noted that there were certain shortcomings associated with recommended tests that may lead to misleading results. The limitations associated with IHC and FISH have been identified in various studies. Polysomy of chromosome 17 is responsible for an increased expression of HER2/neu protein in a minority of breast cancer cases with an absence of gene amplification [47]. IHC can falsely interpret chromosome 17 polysomy as an overexpression of HER2 [48]. It has also been found that tumors with low-grade HER2 gene amplification may have genetic heterogeneity that may influence the interpretation of HER2 status [49, 50]. HER2 genetic heterogeneity has been implicated in causing equivocal HER2 status when using FISH and has also been associated with HER2 IHC 1+/2+ [49, 51, 52]. Lastly, it has been observed that IHC and FISHfail to identify activating mutations of ERBB2 in the absence of HER2/ERBB2 gene amplification and/or overexpression [53].
The above findings prompted ASCO/CAP to bring forth a revised set of guidelines for evaluating HER2 status in patients with newly diagnosed invasive breast cancer. The new guidelines, issued in 2013, increased the HER2 positivity rate by 2% as compared to the previous year when the 2007 guidelines were in effect [23, 54] (Table 1). Thus, a greater number of patients may be able to receive targeted therapy with the implementation of the 2013 ASCO/CAP guidelines.
Table 1: Comparison of ASCO/CAP guidelines 2007 and update published in 2013 for HER2 positivity in breast cancer [45, 53]
Changes |
ASCO/CAP 2007 guidelines |
ASCO/CAP 2013 guidelines |
|---|---|---|
Definition of HER2 positive status |
IHC: |
IHC: |
Definition of equivocal status for HER2 |
IHC: |
Reflex test must be ordered with alternative test on the same specimen, or either of the tests on a new specimen. |
Definition of HER2 negative status |
IHC: |
IHC: |
Definition of indeterminate status for HER2 |
None defined |
HER2 status should be reported as indeterminate if the test results cannot be classified into equivocal, positive or negative due to artifacts, analytic test failure or inadequate handling of specimen. A new specimen should be obtained and the cause of indeterminate result should be documented. |
Criteria for interpretation of ISH |
Using invasive tumor criteria, a minimum of 20 cells must be counted. |
The ISH slide must be entirely scanned prior to counting 20 cells, or areas of HER2 amplification may be defined by using IHC. If visual estimation or image analysis of IHC or ISH slide reveals a second population of cells with increased HER2 signaling and >10% tumor cells, it warrants a separate count of at least 20 cells in this population and has to be reported. When using brightfield ISH, expert opinion must be obtained if the interpretation of the comparison of normal versus tumor cells is difficult due to artifactual patterns. |
Criteria for interpretation of IHC |
More than 30% of invasive tumor cells should have dark, circumferential and homogeneous pattern to report HER2 status as positive. |
More than 10% of invasive tumor cells should have dark, circumferential and homogeneous pattern to report HER2 status as positive (3+ IHC). |
Abbreviations: IHC: Immunohistochemistry; FISH: Fluorescent in-situ hybridization; ISH: In-situ hybridization; HER2: Human epidermal growth factor receptor 2; CEP17: Chromosome enumeration probe 17.
There are multiple points of distinction between the 2013 and 2007 ASCO/CAP guidelines for HER2 positivity in breast cancer. As per the 2013 guidelines, tumors with HER2 gene/ chromosome enumeration probe 17 (CEP17) ratio < 2.0 (≥ 2.2 in 2007 guidelines) together with average HER2 gene copies < 4.0 on dual probe ISH and/or IHC protein expression of 0 in ≤ 10% cells or 1+ in > 10% cells (> 30% cells in 2007 guidelines) are diagnosed as HER2 negative. In cases of single probe ISH, HER2 negative status is defined by an average HER2 copy number of < 4.0. A positive HER2 status is diagnosed by IHC protein expression of 3+, defined as circumferential membrane staining that is intense and complete in > 10% cells. In case of a dual probe ISH, HER2 positivity is defined as average HER2 gene copies ≥ 4.0 and HER2/CEP17 ratio ≥ 2.0. The test is also positive if average HER2 copies are ≥ 6.0 with a HER2/CEP17 ratio of < 2.0, and, if < 4.0 average HER2 gene copies are reported together with a HER2/CEP17 ratio of ≥ 2.0. For a single probe ISH test, HER2 gene copies ≥ 6.0 signals per cell qualify HER2 status as positive.
Reflex testing must be performed using a different assay if the test results are reported as equivocal. An equivocal HER2 status based upon IHC test is defined by either 2+ HER2 protein expression with an intense or complete staining in ≤ 10% invasive tumor cells, or a 2+ HER2 protein expression with moderate/weak or incomplete staining. In dual probe ISH, a HER2/CEP17 ratio < 2.0 associated with average HER2 gene copies ≥ 4.0 and < 6.0 is considered equivocal. For single probe ISH, an equivocal result is defined by ≥ 4.0 and < 6.0 average HER2 copy number.
The new guidelines suggest three levels of testing for HER2-negative patients but exhibit histopathological discordance. In a patient with newly diagnosed breast cancer, a surgical specimen or a core biopsy can be used for performing HER2 testing. If discordance is present, the excisional specimen of the tumor should be tested. If the test is negative and there are persistent concerns regarding the reliability of the result, the test may be repeated using a different block of the tumor specimen. No further testing is required if all three tests are reported as negative.
The 2013 ASCO/CAP guidelines present several recommendations for optimizing the use of bright-field ISH in HER2 testing. It has been suggested that the specimens should be fixed within one hour of being retrieved. Additionally, the acceptable time-frame for specimen processing has been revised to between 6 – 72 hours (previously 6 – 48 hours).
AQUA, or automated quantitative analysis, is one of the latest technologies that have been conceived in an effort to meet ASCO/CAP guidelines. The system uses advanced image analysis algorithms and automated fluorescence microscopy for objectively providing continuous protein expression scores [55]. Consequently, the observer bias in traditional IHC is not present in AQUA analysis. Studies evaluating AQUA analysis in breast cancer have demonstrated that it can meet ASCO/CAP guidelines and thus potentially be used for standardized HER2 testing [56]. Further, data from one study reported that HER2 AQUA analysis (AQUA tissue microarray analysis) was more predictive of response to trastuzumab in metastatic breast cancer, as compared to whole slide FISH or IHC [57]. Nevertheless, large scale validation studies are warranted for adopting HER2 AQUA analysis for use in identifying a predictive biomarker for trastuzumab in breast cancer.
Recent evidence suggests that anti-HER2 agents may be of therapeutic value in patients diagnosed with advanced gastric cancer [58, 59]. Studies evaluating biopsy and surgical specimens of gastric tumors have demonstrated HER2 overexpression and gene amplification in a significant proportion of cases [60, 61].
A considerable amount of discrepancy was noted in HER2 status for gastric tumors when comparing results of IHC and FISH, performed per current guidelines. This was ascribed to incomplete membranous reactivity resulting from basolateral membranous immunoreactivity of glandular cells. Another possible reason may be tumor heterogeneity, found to be higher in gastric cancer when compared to breast cancer [62, 63]. A substantial inter-laboratory variation in scoring for equivocal HER2 IHC 2+ results has also been reported [63]. As a consequence of the inconsistency of IHC/FISH results, it was necessary to develop new guidelines for IHC/FISH scoring to accurately assess HER2 status in gastric tumors.
The trastuzumab for gastric cancer (ToGA) study is a phase III RCT involving patients diagnosed with gastric or gastroesophageal junction cancer. This trial involved the use of modified criteria to determine HER2 status, derived from the IHC scoring system for HER2 in breast cancer. As per the modifications, a strong and incomplete membranous staining was considered a 3+ score (positive), and the 10% area cut-off for membrane staining was to be disregarded [64]. Therefore, the inclusion criteria for study participants was positivity for HER2 overexpression as defined by IHC 3+ or FISH positive (HER2/CEP17 ratio of 2.0) and IHC 2+. The study involved randomization of the participants in a 1:1 ratio to two treatment groups; chemotherapy alone or chemotherapy plus trastuzumab. The median OS in the group receiving chemotherapy plus trastuzumab was 13.8 months (HR: 0.74; P=0.0046) versus 11.1 months for the treatment group that received chemotherapy alone. Thus, the use of an anti-HER2 agent in patients with HER2 positive advanced gastric cancer was found to decrease the risk of death by 26% [65]. Data showed that 15.7% of IHC 1+ and 4.9% IHC 0 cases were FISH positive, while 5% of IHC 3+ cases were FISH negative. The concordance rate of FISH and IHC was 87.2% with the use of the modified scoring system for HER2 status [64].
In addition to the primary goal, the ToGA study helped achieve several other significant objectives. The modified scoring system for HER2 status used in the study was made more reliable and reproducible by adding recommendations to standardize the procedure [66]. The study also showed that the modified scoring system for HER2 status in advanced gastric cancer was predictive of response to a trastuzumab-based treatment regimen [67, 68].
In recent years, lapatinib has emerged as a potent anti-cancer agent. Meta-analysis of three phase III RCTs evaluating the effects of lapatinib in HER2 positive versus negative metastatic breast cancer showed an improvement in progression free survival (PFS) and OS of patients with HER2 positive disease [69]. There is pre-clinical evidence demonstrating dual HER2/EGFR inhibition (NCI-N87 and SNU-216 cell lines) and apoptosis (NCI-N87 only) in gastric cancer cell lines with the use of lapatinib [70]. Lapatinib has exhibited synergistic anti-cancer action with multiple agents in pre-clinical models [70, 71]. Of note, it demonstrated synergistic cell growth inhibition with trastuzumab in HER2 amplified human gastric cancer cell lines [72]. Data obtained from a phase III RCT (EFG104900) showed significant improvement in OS and PFS with the use of combination lapatinib and trastuzumab versus lapatinib monotherapy in HER2 positive metastatic breast cancer patients [73]. Another phase III RCT, the TyTAN study, evaluated the clinical outcome of lapatinib plus paclitaxel versus paclitaxel monotherapy in patients diagnosed with HER2-amplified advanced gastric cancer. HER2 positivity was determined by using FISH for all study participants. All participants also underwent HER2 IHC testing for analysis purposes. The median OS and overall response rate (ORR) were higher with combination paclitaxel plus lapatinib versus paclitaxel monotherapy. Among the study participants receiving combination therapy, a difference in the response to treatment was directly correlated to the HER2 IHC score. Patients with IHC 3+ had a better response to combination therapy compared those with IHC 0/1+ and IHC 2+ [74]. Thus, in addition to demonstrating the activity of lapatinib plus paclitaxel, the TyTAN study also made crucial observations that have brought us closer to devising standardized guidelines for HER2 IHC status positivity in gastric cancer.
There is preliminary data suggesting that clinical outcomes with lapatinib may be influenced by population characteristics. A phase III RCT (TRIO-013/LOGiC-A trial) evaluated lapatinib in combination with capecitabine plus oxaliplatin (CapeOx) for HER2 positive advanced gastric, esophageal and gastroesophageal adenocarcinomas [75]. The study reported no significant benefit in median OS and PFS with lapatinib as compared to placebo. The HER2 IHC status exhibited no association with survival outcomes. However, a subgroup analysis exhibited higher OS in patients of younger age group and Asian ethnicity that received combination lapatinib plus CapeOx [75]. From these observations, it may be inferred that demographic factors such as age and ethnicity may have a bearing on clinical outcomes with lapatinib based therapy. Further research is needed to conclusively determine the effects of demographic influences on survival benefit with lapatinib.
Cetuximab
EGFR, also known as HER1, is a member of the ERBB receptor tyrosine kinase family. Ligand binding induces homodimerization or heterodimerization of EGFR with other members of the ERBB family and leads to downstream signaling through the mitogen activated protein (MAP) kinase and PI3K/Akt pathways [76]. Various studies have implicated the overexpression of EGFR in the progression of cancer [77, 78]. The majority of tumors associated with overexpression of EGFR originate from pancreatic, colorectal, breast and lung tissues [79–83]. EGFR-targeting agents may prove to be of value in such malignancies.
Cetuximab is an anti-EGFR chimeric monoclonal antibody. It binds to the extracellular ligand binding domain of EGFR, consequently blocking downstream signaling pathways associated with EGFR [84, 85]. It also augments internalization and later degradation of the EGFR receptor [85]. In addition, cetuximab has exhibited complement-mediated cytotoxicity and antibody-dependent cellular cytotoxicity (ADCC) [86, 87]. These properties have shown clinical utility in the treatment of several malignancies.
Cetuximab has been approved by the FDA for use in several malignancies. In 2004, cetuximab was first approved for use in combination with irinotecan for EGFR positive metastatic colorectal cancer (mCRC) refractory to irinotecan based therapy [88] (Table 2). Single agent use of cetuximab in EGFR positive mCRC is approved for patients that failed both oxaliplatin and irinotecan based therapy, and for those presenting with recurrent disease along with intolerance to irinotecan based therapy [88–91]. In K-ras wild type, EGFR positive mCRC, combination cetuximab plus FOLFIRI (irinotecan, leucovorin and 5-fluorouracil) is approved as first line therapy [92].
Table 2: List of clinical trials that assessed EGFR IHC and/or EGFR FISH as biomarkers when evaluating targeted therapy agents for EGFR positive malignancies
Drug |
Treatment regimen |
Biomarker |
Tumor histology |
Criteria for biomarker positivity |
Percent of tumor samples expressing the biomarker |
Outcome |
Reference |
|---|---|---|---|---|---|---|---|
Cetuximab |
Cetuximab 400 mg/m2 D1, then 250 mg/m2 weekly; cisplatin 80 mg/m2, vinorelbine 25 mg/m2 |
EGFR IHC |
NSCLC |
EGFR IHC score ≥200 categorized as high and <200 as low, on a scale of 0-300 |
High: 31% (345 of 1121 patients) |
High EGFR expression group: |
FLEX study |
Cetuximab |
Cetuximab with or without T/C |
EGFR FISH, EGFR IHC |
NSCLC |
EGFR FISH positivity by Colorado scoring system; |
EGFR FISH: 51.9% (54 of 104 patients) |
EGFR FISH for cetuximab plus T/C cohort: |
BMS099 study [127] |
Cetuximab |
Cetuximab 400 mg/m2 D1, then 250 mg/m2 weekly; carboplatin (area under curve = 6), paclitaxel 225 mg/m2 |
EGFR FISH |
NSCLC |
EGFR FISH showing ≥4 gene copies in each cell in ≥40% cells, or, gene amplification as defined by ≥15 copies of the gene in ≥10% cells, presence of a gene cluster or a gene-chromosome ratio ≥2 |
59.2% (45 of 76 patients) |
- Median survival time for FISH positive cases was 15 months, versus 7 months for FISH negative cases (p= 0.04) |
[232] |
Cetuximab |
Single agent cetuximab 400 mg/m2 D1, then 250 mg/m2 weekly; Platinum plus cetuximab salvage therapy if disease progression on cetuximab monotherapy |
EGFR IHC |
SCCHN |
EGFR IHC score 1+, 2+ or 3+ on a scale of 0 to 3+, using a standardized IHC assay |
97% (97 of 100 patients) |
Single agent phase: |
[92] |
Cetuximab |
Cetuximab 400 mg/m2 D1, then 250 mg/m2 weekly; fluorouracil 1000 mg/m2, cisplatin 100 mg/m2 or carboplatin (area under curve = 5) |
EGFR IHC |
SCCHN |
EGFR IHC results stratified in 3 groups according to percentage of cells testing positive for EGFR: 0%, >0 to <40% and ≥40%; no criteria for positivity defined |
98% (405 of 413 patients) had detectable EGFR; - 1.9% |
>0 to<40% cells positive for EGFR: |
[94] |
Cetuximab |
Cetuximab 400 mg/m2 D1, then 250 mg/m2 weekly with or without high-dose radiotherapy |
EGFR IHC |
SCCHN |
EGFR IHC results stratified in groups according to percentage of cells testing positive for EGFR: ≤50% and >50%, unknown and undetectable; no criteria for positivity defined |
99% (421 of 424 patients) had detectable EGFR staining; |
PFS: |
[93] |
Cetuximab |
Single agent cetuximab 400 mg/m2 D1, then 250 mg/m2 weekly |
EGFR IHC |
mCRC |
Definition for a negative EGFR IHC (as per study design): Absent membrane staining in ≥500 tumor cells |
- 8.2% (7 of 85 patients) tested negative for EGFR IHC |
- Patients negative for EGFR eligible for participation as per study design |
[98] |
Cetuximab |
cetuximab 400 mg/m2 D1, then 250 mg/m2 weekly; irinotecan 180 mg/m2 every 2 weeks or 125 mg/m2 weekly plus fluorouracil and leucovorin; single agent irinotecan as 350 mg/m2 every three weeks |
EGFR IHC |
mCRC |
EGFR IHC scoring using a standard IHC assay; categorized in 4 groups on basis of percentage of cells positive for EGFR: |
- 41% (135 of 329 patients) with 0 to <10% cells positive for EGFR |
Rate of response with cetuximab plus irinotecan: |
[233] |
Cetuximab |
Cetuximab 400 mg/m2 D1, then 250 mg/m2 weekly |
EGFR IHC |
mCRC |
EGFR IHC scoring using a standard IHC assay: |
- 2.6% (9 of 346 patients) with undetectable EGFR expression |
Outcome (partial response, PR) stratified as per EGFR IHC score: |
[88] |
Cetuximab |
Cetuximab 400 mg/m2 D1, then 250 mg/m2 weekly |
EGFR IHC |
CRC |
EGFR IHC scoring using a standard IHC assay: 0, 1+, 2+ and 3+. |
All candidates required to have EGFR IHC score >0 for enrollment. |
Outcome (treatment responders) stratified as per EGFR IHC score: |
[89] |
Cetuximab |
Cetuximab 400 mg/m2 D1, then 250 mg/m2 weekly; irinotecan 350 mg/m2 at 3 weeks interval |
EGFR IHC |
mCRC |
EGFR IHC scoring criteria: |
All candidates required to have EGFR expression for eligibility. |
Cetuximab plus irinotecan: |
EPIC trial [90] |
Necitumumab |
Necitumumab 800 mg D1 and D8, continued after completion of chemotherapy; cisplatin 75 mg/m2 D1; gemcitabine 1250 mg/m2 D1 and D8 |
EGFR FISH |
Squamous NSCLC |
EGFR FISH results determined using Colorado scoring system |
51% of study participants evaluable for EGFR FISH status in exploratory analysis; 37.3% (208 patients) of the evaluated samples positive for EGFR FISH |
Median OS: |
Abbreviations: EGFR, epithelial growth factor receptor; IHC, immunohistochemistry; FISH, fluorescent in-situ hybridization; NSCLC, non-small cell lung cancer; SCCHN, squamous cell carcinoma of head and neck; CRC, colorectal cancer; mCRC, metastatic colorectal cancer; HR, hazard ratio; CI, confidence interval; OS, overall survival; PFS, progression free survival; TTP, time to progression; RR, response rate; ORR, overall response rate; PR, partial response; T/C. taxanes/carboplatin; D1, day 1; D8, day 8.
In patients diagnosed with squamous cell carcinoma of the head and neck (SCCHN), cetuximab may be used as a single agent in cases with recurrent or metastatic disease that failed platinum based therapy [93] (Table 2). In cases of regionally or locally advanced SCCHN, cetuximab is approved for use in combination with radiotherapy [94]. For metastatic and/or recurrent locoregional SCCHN, cetuximab can be used in combination with 5-fluorouracil plus platinum based chemotherapy [95, 96].
To study the effects of cetuximab, several efforts were made to optimize case selection during the initial clinical studies. Based upon the Herceptin/HercepTest drug-diagnostic test association for trastuzumab (anti-HER2 agent), EGFR expression as determined by an IHC test was required for participants enrolled in clinical trials evaluating cetuximab based therapy [97]. However, review of data showed that patients with colorectal cancer diagnosed as EGFR-negative by IHC testing also responded to treatment with cetuximab [98]. Similar findings were demonstrated in a phase II trial evaluating the effects of cetuximab in refractory mCRC diagnosed as negative for EGFR by IHC testing. 8.2% (7 patients) of all study candidates (85 patients) showed major response with cetuximab monotherapy [99]. Thus, the predictive value of EGFR IHC testing for cetuximab based therapy in colorectal cancer was found to be questionable. In view of the above, the National Comprehensive Cancer Network (NCCN) issued guidelines stating that case selection for cetuximab therapy should not depend upon the results of EGFR IHC testing [100]. However, later studies suggested that using FISH to determine EGFR status may potentially be used as a predictive biomarker for cetuximab based therapy [101, 102].
Several theories have been investigated in the search for a predictive biomarker for cetuximab therapy. Data from a study that evaluated genetic changes in EGFR after treatment with cetuximab or panitumumab in mCRC cases put forth an interesting hypothesis. The dosage of cetuximab that led to inhibition of proliferation in mCRC cell populations with amplified numbers of EGFR copies showed no effect on cell populations lacking EGFR amplification. Thus, it was suggested that case-selection for anti-EGFR therapy may be based upon the number of EGFR gene copies [102]. However, another study involving mCRC patients that received cetuximab based therapy noted a response to treatment among cases that tested negative for EGFR gene amplification on FISH analysis. Therefore, this study suggested that the use of EGFR FISH analysis for selection of mCRC cases that would receive cetuximab was found to be of little value [103].
The KRAS gene is of particular interest in cetuximab based treatment regimens. It belongs to the RAS gene family that produces GDP/GTP binding proteins. RAS plays a crucial role in normal downstream cellular signaling of cell surface receptors for functions related to growth and senescence. Several RAS gene mutations have been associated with oncogenesis [104, 105]. Typically, RAS mutations occur at codons 12, 13 or 61 [106]. KRAS, is specifically mutated at codons 12 or 13 of exon 2 [107–109]. Both KRAS mutations lead to impairment of GTPase activating protein (GAP) binding, leading to constitutive activation [106]. Almost 35-40% of mCRC patients have been reported to have activating mutations in KRAS. These mutations have been associated with activation of intracellular signal transduction pathways through EGFR-independent mechanisms [109].
There is a significant amount of evidence suggesting that KRAS mutation status may be predictive of resistance to cetuximab based therapy in mCRC patients. Several clinical trials and single arm studies involving patients diagnosed with mCRC have demonstrated a direct association between KRAS mutations and resistance to treatment with cetuximab [110–118]. Further studies evaluating specific KRAS mutations and their association with OS and PFS upon treatment with cetuximab have made further observations. Chemotherapy-refractory mCRC cases positive for KRAS mutation at codon 13 showed less resistance to cetuximab therapy [119]. Thus, it appears that specific KRAS mutations may have greater predictive value over others when we attempt to determine response to cetuximab based therapy. In view of the above evidence, the American Society of Clinical Oncology (ASCO) put forth guidelines in 2009 stating that all mCRC patients must undergo tests for KRAS mutations in their tumor tissue prior to initiating treatment with anti-EGFR antibodies. A positive signal for KRAS mutation at codon 12 or 13 shall exclude treatment with any anti-EGFR monoclonal antibody [120].
Extensive research on members of the RAS family has implicated several other crucial mutations that are predictive for resistance to treatment with anti-EGFR antibodies. The CRYSTAL study showed an improvement in objective response, OS and PFS after addition of cetuximab to FOLFIRI versus FOLFIRI alone, in KRAS wild type mCRC patients [121]. DNA samples collected during the study determined KRAS exon 2 mutation status and were re-analyzed for other RAS mutations. These included NRAS codons at exons 2, 3 and 4, and KRAS codons at exons 3 and 4. It was observed that patients with extended RAS mutations showed no benefit in OS, PFS or objective response upon addition of cetuximab to FOLFIRI versus FOLFIRI alone [122]. Similarly, retrospective analysis of the PRIME study demonstrated a lack of response in mCRC patients with extended RAS mutations upon treatment with the combination of panitumumab plus FOLFOX4 (leucovorin, oxaliplatin and fluorouracil) [123]. ASCO guidelines were therefore recently revised to include mutation testing for both NRAS and KRAS at exon 4 (codons 146 and 117), exon 3 (codons 61 and 59) and exon 2 (codons 13 and 12) for all mCRC cases that are being considered for treatment with anti-EGFR monoclonal antibodies [124].
Cetuximab has been evaluated as a potential treatment option for advanced non-small cell lung cancer (NSCLC) (Table 2). The first line Erbitux in lung cancer (FLEX) study was a phase III clinical trial assessing the effects of cetuximab plus first-line chemotherapy (cisplatin and vinorelbine) in advanced EGFR positive NSCLC cases. The combination therapy was associated with a significant improvement in OS, as compared to cisplatin plus vinorelbine alone [123]. Another phase III RCT, BMS099, reported significant improvement in ORR with cetuximab plus chemotherapy (carboplatin plus paclitaxel/docetaxel) versus chemotherapy alone in advanced NSCLC cases [125]. Data gathered during FLEX and BMC099 phase III clinical trials prompted further investigation to determine suitable predictive biomarkers for improvement in outcomes of advanced NSCLC patients.
Numerous endeavors have been made to identify a predictive biomarker for the cetuximab plus chemotherapy treatment regimen in advanced NSCLC. Treatment outcomes of participants involved in the FLEX trial were retrospectively analyzed in association with the status of several biomarkers [126]. Formalin fixed paraffin embedded (FFPE) tissue samples from the study participants were analyzed for KRAS codons 12 and 13 mutations by PCR assay and PTEN expression through IHC and EGFR copy number by dual color FISH. However, it was found that all biomarkers evaluated in this study had no predictive value for treatment efficacy of combination cetuximab plus chemotherapy [126]. Another study assessed the tumor EGFR IHC data collected during the FLEX study and compared cases with high (IHC score ≥ 200 on a scale of 0-300) versus low (IHC score < 200 on a scale of 0-300) tumor EGFR expression [127]. It was observed that patients with high EGFR expression exhibited a significant improvement in OS when treated with combination cetuximab plus chemotherapy versus chemotherapy alone. Conversely, a shorter median OS was noted with cetuximab plus chemotherapy treatment as compared to chemotherapy alone in patients with low EGFR expression. Thus, a high tumor EGFR expression may potentially be predictive of survival benefit from cetuximab based therapy for advanced NSCLC cases [127]. The survival indices in high and low EGFR expression groups were further analyzed to search for possible association with tumor EGFR mutation status. However, it was demonstrated that EGFR mutation status did not limit the improvement in OS for advanced NSCLC with high EGFR expression upon treatment with combination cetuximab plus chemotherapy (oxaliplatin plus vinorelbine) [123]. Much the same as FLEX study based trials, tumor samples obtained from BMS099 clinical trial participants were also evaluated for several predictive biomarkers. This consisted of FISH analysis of EGFR gene copy number, IHC for EGFR protein expression and direct sequencing for EGFR and KRAS mutations. None of the biomarkers assessed in the study exhibited association with ORR, OS or PFS [128].
Contiguous with the studies based on data from FLEX and BMS099 clinical trials, a phase II selection trial involving advanced NSCLC cases receiving cetuximab plus chemotherapy (carboplatin plus paclitaxel) assessed patients for EGFR status using FISH in association with survival outcomes [101]. The criteria for EGFR FISH positivity was established as ≥ 4 gene copies per cell in ≥ 40% cells. Alternatively, EGFR FISH could also be classified as positive based on gene amplification, defined by ≥ 15 copies of the gene in ≥ 10% cells, presence of a gene cluster or a gene-chromosome ratio ≥ 2. The study reported a significant survival benefit (median survival time and PFS) in the FISH positive group as compared to the FISH negative group. Additionally, the FISH positive group had statistically superior disease control rate and a higher number of treatment responders (partial and complete response) as compared to the FISH negative group [101]. These observations have collectively presented evidence suggesting that EGFR FISH may be used as a predictive biomarker for cetuximab based therapy in advanced NSCLC. However, large scale clinical studies are warranted in order to validate the above findings.
The SWOG S0819 was a phase III clinical trial with a primary focus on the evaluation of cetuximab efficacy in combination with chemotherapy for the treatment of advanced NSCLC. Additionally, this trial also assessed EGFR FISH as a predictive biomarker for cetuximab based treatment regimens in advanced NSCLC patients [33]. Positive results for EGFR gene amplification by FISH were defined using the Colorado scoring system. According to this system, specimens with ≥ 4 copies of EGFR signal in ≥ 40% cells, or ≥ 4 spots of gene clusters or ≥ 10% of tumor cells with ≥ 15 copies of EGFR signals or an EGFR/CEP7 ratio ≥ 2 were classified as positive for EGFR [129]. Although no overall improvement in OS was reported for the entire study population, a subgroup analysis demonstrated OS benefit in FISH positive squamous cell NSCLC patients (n= 321, HR= 0.56, P= 0.006) [129]. Therefore, it can be stated that these findings are indicative of the predictive significance of EGFR FISH in squamous cell NSCLC.
With a background of aforementioned studies that provided an assessment of the role of cetuximab in therapy for advanced NSCLC and potential predictive biomarkers, it has become imperative to attempt further validation of this data with biomarker driven prospective studies.
Necitumumab
Necitumumab is another recombinant human monoclonal EGFR antibody [130, 131]. The efficacy of the drug in non-squamous cell and squamous cell NSCLC have been evaluated in the INSPIRE and SQUIRE clinical trials respectively [131–133]. The SQUIRE trial also evaluated potential predictive biomarkers for necitumumab.
The INSPIRE trial was a phase III RCT that assessed the efficacy of necitumumab plus pemetrexed-cisplatin combination versus pemetrexed-cisplatin combination alone in patients with stage IV non-squamous cell NSCLC [132]. This study concluded that necitumumab plus pemetrexed-cisplatin combination had no survival benefit over pemetrexed-cisplatin therapy alone [132].
The SQUIRE trial was a phase III RCT that evaluated necitumumab plus gemcitabine-cisplatin combination versus gemcitabine-cisplatin alone in stage IV squamous NSCLC [131]. A significant benefit in OS was observed with necitumumab plus gemcitabine-cisplatin combination (median OS: 11.5 months; 95% CI: 10.4 – 12.6) as compared to the control group (median OS: 9.9 months; 95% CI: 8.9 – 11.1) [131]. In addition to the above, recently published results from an exploratory analysis of archived tumor samples from the SQUIRE trial have reported outcomes favoring the use of EGFR FISH in squamous NSCLC [134]. Tumor samples were available from 51% of study participants, of which 37.3% (208 patients) were EGFR FISH positive. The treatment HR for OS and PFS in FISH positive patients was recorded as 0.70 and 0.71 versus 1.02 and 1.04 for FISH negative patients, respectively [134]. Thus, it may be suggested that EGFR gene copy number analysis by FISH can potentially be employed as a predictive biomarker for necitumumab in squamous cell NSCLC. Further biomarker-driven clinical trials are necessary to conclusively validate these findings.
On the basis of the observations made in the SQUIRE trial, the US FDA approved necitumumab plus gemcitabine-cisplatin combination for use as a first-line therapy option in metastatic squamous cell NSCLC [135]. Additionally, necitumumab has also been authorized for use by the European Commission (the Committee for Medicinal Products for Human Use; CHMP) for advanced squamous NSCLC in combination with gemcitabine plus cisplatin [136]. Of note, in contrast to the US FDA approval, European Commission limited the approved indication to advanced squamous NSCLC with EGFR expression although they did not specify the methods for testing the expression of EGFR [136]. This is a good example where a clinically meaningful biomarker based subgroup analysis influenced actual approved indication of the treatment regimen.
cMET receptor protein
cMET is a membrane spanning receptor tyrosine kinase that binds to hepatocyte growth factor (HGF) [137]. The binding of HGF/MET leads to activation of multiple downstream molecules through PI3K/AKT, NFκB, MAPK and STAT signaling pathways [138–141]. MET mediates several cellular processes that are stimulated by hepatocyte growth factor/scatter factor (HGF/SF) such as proliferation, motility and morphogenesis [142–144]. Upregulation of HGF/SF and MET genes after injury to organs such as the heart, liver and kidneys suggests that they may also have a role in tissue regeneration and homeostasis [145–148]. MET is gaining significance as a potential target in oncology as it plays a crucial role in mediation of numerous cellular processes [149].
Studies investigating pathogenesis of multiple malignancies have suggested that aberrations in MET may act as oncogenic drivers. These may include MET gene amplification, protein overexpression and MET gene mutation [150, 151]. Tumors of the stomach, breast, thyroid and lung are among several others that have been reported to exhibit MET aberrations [150–155]. MET has also been implicated in resistance to VEGFR and EGFR inhibitor based therapy [149]. Considering the role of the MET pathway in oncogenesis, there is an increasing emphasis on exploring prospects of MET- targeting therapy in several malignancies, together with identification of potential biomarkers for the same.
Efforts undertaken to develop predictive biomarkers and evaluate the efficacy of MET targeting agents have accrued initial success (Table 3). Numerous MET targeting agents, mostly either small molecules or monoclonal antibodies have been developed and are presently being evaluated for their efficacy in several malignancies [149]. A phase II RCT evaluating combination onartuzumab (MET antagonist) plus erlotinib in advanced NSCLC used IHC for diagnosing MET status [156]. MET IHC positive patients receiving onartuzumab plus erlotinib exhibited improvement in OS and PFS. On the other hand, MET IHC negative patients receiving the same combination showed worse survival outcomes when compared to the MET IHC positive group [156]. On account of these findings, it is prudent to further investigate MET IHC as a predictive biomarker for MET antagonist therapy in advanced NSCLC patients.
Table 3: List of clinical trials that assessed MET IHC as a biomarker when evaluating targeted therapy agents for MET positive malignancies
Drug |
Treatment regimen |
Biomarker |
Tumor histology |
Criteria for biomarker positivity |
Percent of tumor samples expressing the biomarker |
Outcome |
Reference |
|---|---|---|---|---|---|---|---|
Onartuzumab |
Onartuzumab 15 mg/kg every 3 weeks; erlotinib 150 mg/day |
MET IHC |
NSCLC |
MET IHC scoring: |
- 52% (66 of 128 patients) |
Risk of disease progression: |
[155] |
Onartuzumab |
Onartuzumab with/without mFOLFOX6 |
MET IHC |
Gastric/ GEJ cancer |
MET IHC score 1+, 2+ or 3+ on a scale of 0 to 3+, using a standard IHC assay |
All candidates required to be positive for MET expression by IHC for enrollment in study. |
ITT group median OS: |
[234] |
Rilotumumab |
Rilotumumab 15 mg/kg D1 every 3 weeks; epirubicin 50 mg/m2 D1, capecitabine 625 mg/m2 BID D1-21, cisplatin 60 mg/m2 D1 |
MET IHC |
Gastric/ GEJ cancer |
MET IHC score 1+, 2+ or 3+ on a scale of 0 to 3+, using a standard IHC assay |
All candidates required to be positive for MET expression by IHC for enrollment in study. |
Early termination of study due to greater mortality in rilotumumab plus ECX group (128 deaths) versus placebo plus ECX (107 deaths) |
RILOMET 1 study |
Rilotumumab |
Rilotumumab 15 mg/kg D1 every 3 weeks; capecitabine 1000 mg/m2 BID D1-14, cisplatin 80 mg/m2 D1 |
MET IHC |
Gastric/ GEJ cancer |
MET IHC score 1+, 2+ or 3+ on a scale of 0 to 3+, using a standard IHC assay |
All candidates required to be positive for MET expression by IHC for enrollment in study. |
Early termination of study due to greater mortality with rilotumumab plus CX versus placebo plus CX [235] |
RILOMET 2 study [159] |
Abbreviations: MET, Hepatocyte growth factor receptor; IHC, immunohistochemistry; NSCLC, non-small cell lung cancer; GEJ, Gastro-esophageal junction; ECX, epirubicin, cisplatin and capecitabine; CX, cisplatin plus capecitabine; ITT, intent to treat; HR, hazard ratio; CI, confidence interval; OS, overall survival; PFS, progression free survival; D1, day 1; BID, twice daily; mFOLFOX6, leucovorin, fluorouracil and oxaliplatin.
A limited number of clinical trials have been conducted to evaluate the role of MET pathway inhibitors and identify potential biomarkers in the treatment of advanced gastric and esophagogastric junction (EGJ) cancers. Rilotumumab is a monoclonal antibody that functions as an HGF/SF inhibitor, thus preventing downstream signaling through cMET pathway [157]. Data from a phase II RCT comparing rilotumumab plus chemotherapy (epirubicin, cisplatin and capecitabine; ECX) versus chemotherapy alone in locally advanced or metastatic gastric/EGJ cancer, was retrospectively analyzed to determine the association between MET pathway biomarkers and clinical outcomes [158]. The tumor samples collected during the trial were examined for MET protein expression by IHC and MET gene copy number by FISH. It was observed that MET gene copy number by FISH analysis showed no correlation with survival outcomes. However, patients with a high MET expression on IHC exhibited greater improvement in survival indices (OS and PFS) with rilotumumab plus chemotherapy treatment versus those with a low MET expression [158]. These findings served as a basis for further studies investigating the efficacy of rilotumumab in advanced gastric and esophagogastric cancers. In addition, data from this study provided initial evidence that suggested a potential use of MET IHC as a predictive biomarker in rilotumumab therapy.
Two phase III trials, RILOMET 1 and RILOMET 2, were initiated to evaluate the efficacy of rilotumumab in combination with cisplatin and capecitabine (ECX and CX) respectively (Table 3). However, both trials were terminated prior to completion due to a greater number of deaths in the patient group receiving rilotumumab as compared to the placebo group [159, 160]. It may be speculated that the case selection, based upon the status of MET protein expression through IHC, may have been responsible for the poor survival outcomes in both studies. Presently, there is a lack of consensus on IHC scoring for MET protein expression. The procedure for MET IHC requires standardization to overcome variability in results from a multitude of factors, such as protocols for staining and tissue processing among others [161]. Efforts to explore alternative biomarker platforms, such as IHC or ISH for HGF expression, may also be considered in future studies.
FGFR
FGFRs are transmembrane receptor tyrosine kinases. Together with fibroblast growth factors (FGF), they are involved in several biologic processes such as differentiation, angiogenesis, mitogenesis and migration [162, 163]. The FGFR family has four members (FGFR1-4), each bearing several isoforms due to alternative mRNA splicing that allows for diverse ligand binding affinities for each isoform [163–169]. Genetic aberrations in FGFRs have been associated with carcinogenesis in several organ systems.
Numerous studies have highlighted the association between genetic abnormalities in members of the FGFR family and tumorigenesis. FGFR deregulation may be the consequence of either amplification, translocation or a point mutation [170]. Aberrations in FGFRs have been implicated in cancers of the bladder, endometrium, breast and stomach [171–183]. In addition, FGFR translocation and mutation have been associated with multiple myeloma and rhabdomyosarcoma, respectively [184–187]. Thus, therapeutic targeting of FGFR may be beneficial in the above malignancies.
Several phase I and phase II trials are presently underway to evaluate FGFR targeting agents.
The anti-FGFR agents being assessed fall into three categories, namely multikinase/nonselective FGFR inhibitors, selective FGFR inhibitors and monoclonal antibodies that target the FGFR pathway [188]. Although the initial results with FGFR inhibitors are encouraging, the survival benefit may be improved with a robust biomarker platform to enhance case selection.
There are several challenges in the development of a predictive biomarker for anti-FGFR pathway agents. FISH has been used in several studies to ascertain the status of FGFR amplification (Table 4). However, the criteria to determine the status of FGFR by FISH have a significant amount of variation [189–197]. This has led to identification of certain factors that need to be better elucidated prior to defining a standardized protocol for FGFR identification by FISH/ISH. One of the concerns is the heterogeneous or focal pattern of amplification in association with CEN8 polysomy that results in a FGFR/CEN8 ratio < 2.0 even with increased FGFR1 signaling in tumor tissue. Another factor is the unknown influence of genomic heterogeneity in certain tumors such as squamous cell carcinoma of the lung and breast cancer on FGFR expression. It is crucial to create an empiric dataset for defining FGFR cut-offs that are predictive of response to anti-FGFR agents [188]. Alongside the efforts to improve FGFR FISH/ISH, alternative biomarker evaluation strategies are also being explored. Screening assays that can evaluate multiple components of the FGFR pathway for aberrations are under investigation in several studies [188].
Table 4: List of clinical trials that assessed FGFR FISH as a biomarker when evaluating FGFR inhibitor based therapy
Drug |
Treatment regimen |
Biomarker |
Tumor histology |
Criteria for biomarker positivity |
Percent of tumor samples expressing the biomarker |
Outcome |
Reference |
|---|---|---|---|---|---|---|---|
Dovitinib |
Dovitinib 500 mg/day, for 5 days followed by 2 days off (28 days cycle) |
FGFR FISH/ CSH/SISH |
Metastatic breast cancer |
≥6 copies of FGFR1 classified as positive for FGFR1 amplification |
- 28% (23 of 81 patients) FGFR1+, HR+ |
Median PFS: |
[236] |
E3810 (Lucitanib) |
Lucitanib 20 mg or 15 mg per day |
- FGFR1 FISH; |
Breast cancer |
- FGFR1 FISH: ≥6 copies of FGFR1 per nucleus or FGFR1/CEN8 > 2.2 |
- 35% (18 of 51 patients) in expansion cohort |
10 breast cancer patients were evaluable for response. |
[193] |
Abbreviations: FGFR: Fibroblast growth factor receptor; CISH: Chromogenic in situ hybridization; SISH: Silver in situ hybridization; FISH, fluorescent in situ hybridization; FGFR1: Fibroblast growth factor receptor 1; HR: Hormone receptor; PFS, progression free survival; SD: Stable disease; PD: Progressive disease; PR, partial response; CGH: Comparative genomic hybridization; FGF3: Fibroblast growth factor 3.
PD-1/PD-L1
Programmed cell death protein, or PD-1, is a receptor molecule expressed on the surface of B cells, T cells and myeloid cells [198, 199]. The primary function of PD-1 is regulation of adaptive immunity. The binding of PD-1 with corresponding ligands (PD-L1/PD-L2) induces inhibition of functioning and proliferation of T cells [199]. PD-1 expression is known to be elevated in exhausted T cells. Pre-clinical studies have shown that the function of exhausted T cells may be partially restored by preventing the interaction of PD-1 with PD-L1 [200–203]. Agents that inhibit the PD-1/PD-L1 interaction have been extensively investigated for potential application in the treatment of cancer.
Several clinical trials have reported a survival benefit associated with the use of PD-1 inhibitory antibodies in various malignancies. The FDA approved the use of PD-1 inhibitors for the treatment of NSCLC (nivolumab and pembrolizumab), melanoma (nivolumab and pembrolizumab), renal cell carcinoma (nivolumab), head and neck cancer (pembrolizumab), Hodgkin’s lymphoma (nivolumab) and bladder cancer (atezolizumab) [34, 204–213]. In addition to the development of PD-1 targeted agents, the identification of predictive biomarkers has also been stressed for improving the selection patients with the highest potential to benefit from this treatment modality.
The expression of PD-L1 has been assiduously evaluated as a predictive biomarker for therapy with anti-PD-1 monoclonal antibodies (Table 5). In light of the successful application of HER2 IHC for trastuzumab based therapy in breast cancer, PD-L1 IHC has been investigated as a predictive biomarker for PD-1 inhibitory based therapy [214]. A phase I trial evaluating nivolumab in melanoma patients defined PD-L1 status as positive if PD-L1 was detected by IHC (Dako IHC, utilizing 28-8 detection antibody) in ≥5% tumor cells. The trial reported that the use of nivolumab was associated with a higher response rate, OS and PFS in PD-L1 IHC positive patients versus those that tested negative for the same [215]. Although fewer in number, PD-L1 negative patients that did respond to nivolumab demonstrated radiological control of disease at par with PD-L1 positive responders that showed almost 75-100% reductions in tumor burden [214–216]. Using the same PD-L1 IHC positivity criteria, a different trial evaluating combination nivolumab plus ipilimumab in advanced melanoma reported a response in 57% of PD-L1 positive and 41% of PD-L1 negative cases [214, 217]. Another trial, again applying the same criteria for PD-L1 IHC status, assessed the efficacy of nivolumab monotherapy in advanced NSCLC. A response rate of 67% was observed in PD-L1 IHC positive cases while those negative for PD-L1 expression on IHC recorded no response with nivolumab therapy [214, 218]. Results obtained for trials evaluating pembrolizumab in melanoma and NSCLC have been largely similar to clinical trials assessing nivolumab in corresponding tumors. A phase I clinical trial assessing the correlation between clinical outcome of melanoma patients receiving pembrolizumab and tumor PD-L1 expression, defined the cut-off as 1% of stained tumor cells for a positive PD-L1 IHC status. The study exhibited a significant improvement of PFS and ORR in patients positive for PD-L1 IHC as compared to those reported as negative [219]. However, nearly 20% of PD-L1 negative patients showed an improvement in PFS with pembrolizumab [214, 219]. Another phase I trial evaluating pembrolizumab in NSCLC defined PD-L1 positivity as having at least 50% of tumor cells expressing PD-L1 on IHC. At 6 months follow-up, the immune related ORR, OS and PFS were found to be considerably higher in the PD-L1 positive versus the PD-L1 negative group [220]. Thus, although clinical evidence indicates that PD-L1 expression may potentially serve as a biomarker, further research is necessary to overcome issues that affect the predictive value of PD-L1 IHC.
Table 5: List of clinical trials that assessed PD-L1 IHC as a biomarker when evaluating targeted therapy agents for PD-L1 positive malignancies
Drug |
Treatment regimen |
Biomarker |
Tumor histology |
Criteria for biomarker positivity |
Percent of tumor samples expressing the biomarker |
Outcome |
Reference |
|---|---|---|---|---|---|---|---|
Atezolizumab |
Atezolizumab 1200 mg every 3 weeks |
PD-L1 IHC |
Urothelial carcinoma |
PD-L1 IHC scoring: |
NA |
Primary analysis demonstrated significant improvement in objective response rate for each group. |
[212] |
Nivolumab |
Ipilimumab 3 mg/kg; Nivolumab 1 mg/kg, initial 4 doses once every 3 weeks, then once every 2 weeks. |
PD-L1 IHC |
Melanoma |
- ≥5% tumor cells exhibiting PD-L1 staining of any intensity in ≥100 evaluable tumor cells using an automated IHC assay |
- 30% (35 of 118 patients) positive for PD-L1 |
Nivolumab plus Ipilimumab: |
[204] |
Pembrolizumab |
Pembrolizumab 10 mg/kg bi-weekly; ipilimumab 3 mg/kg once every 3 weeks for 4 doses |
PD-L1 IHC |
Advanced melanoma |
- ≥1% tumor cells with membranous staining using a standardized IHC assay |
80.5% (671 of 834 patients) positive for PD-L1 |
2 weeks pembrolizumab therapy versus ipilimumab |
[205] |
Nivolumab |
Concurrent therapy: cohort 1-5 |
PD-L1 IHC |
Advanced melanoma |
- ≥5% tumor cells exhibiting PD-L1 staining of any intensity in ≥100 evaluable tumor cells using a standardized automated IHC assay |
- 38% (21 of 56 patients) positive for PD-L1 |
ORR in concurrent therapy cohorts: |
[216] |
Nivolumab |
Docetaxel 75 mg/m2 once every 3 weeks; nivolumab 3 mg/kg once every 2 weeks |
PD-L1 IHC |
Squamous-cell NSCLC |
- Pre-determined categorization of PD-L1 expression: |
- 83% (225 of 272 patients) positive for PD-L1 |
HR for OS according to PD-L1 expression level (nivolumab versus docetaxel therapy): |
[237] |
Nivolumab |
Docetaxel 75 mg/m2 once every 3 weeks; nivolumab 3 mg/kg once every 2 weeks |
PD-L1 IHC |
Non-squamous NSCLC |
- Pre-determined categorization of PD-L1 expression: |
- 78% (455 of 582 patients) positive for PD-L1 |
Treatment with nivolumab by PD-L1 expression interaction P-value (predictive relationship of PD-L1 level for treatment efficacy with nivolumab): |
[207] |
Nivolumab |
Nivolumab 0.3 / 2 / 10 mg/kg every 3 weeks |
PD-L1 IHC |
RCC |
- ≥5% tumor cells exhibiting PD-L1 staining using a standardized automated IHC assay. Additionally, cut-off value of ≥1% was also evaluated. |
- 64% (107 of 168 patients) positive for PD-L1: 78 patients with <5% PD-L1 expression and 29 with ≥5% expression. |
<5% PD-L1 expression: |
[206] |
Nivolumab |
Nivolumab 0.1 / 0.3 / 1 / 3 / 10 mg/kg once every 2 weeks for up to 96 weeks. |
PD-L1 IHC |
Advanced melanoma |
- ≥5% tumor cells exhibiting PD-L1 staining using a standardized automated IHC assay (retrospective analysis) |
- 43.90% (18 of 41 patients) positive for PD-L1 |
PD-L1 positive patients: |
[214] |
Nivolumab |
Nivolumab 1 / 3 / 10 mg/kg every 2 weeks (8 weeks cycle) for up to 96 weeks |
PD-L1 IHC |
Advanced NSCLC |
- ≥5% tumor cells exhibiting PD-L1 staining using a standardized automated IHC assay (retrospective analysis) |
Not available |
PD-L1 positive tumors: |
[238] |
Nivolumab |
Nivolumab 3 mg/kg once every 2 weeks; docetaxel 75 mg/m2 once every 3 weeks |
PD-L1 IHC |
Advanced/metastatic squamous cell NSCLC |
- No specific cut-off value defined as per study design |
- Not applicable |
OS HR for nivolumab versus docetaxel therapy, according to PD-L1 expression level: |
[229] |
Nivolumab |
Nivolumab dose range: 0.1 to 10 mg/kg once every 2 weeks |
PD-L1 IHC |
NSCLC, melanoma, RCC, colorectal cancer, prostate cancer |
- ≥5% tumor cells exhibiting PD-L1 staining using a standardized automated IHC assay |
- 45% (17 of 38 patients) with melanoma positive for PD-L1 |
PD-L1 positive melanoma patients: |
[221] |
Nivolumab |
Sequential escalation of nivolumab dosage: 1, 3, 10 mg/kg, in addition to randomly assigned cohorts with doses ranging from 0.1 mg/kg to 10 mg/kg |
PD-L1 IHC |
Advanced melanoma, NSCLC, RCC, castration resistant prostate cancer, colorectal cancer |
- ≥5% tumor cells exhibiting PD-L1 staining, verified by 2 pathologists |
- 59.52% (25 of 42 patients) positive for PD-L1: 18 melanoma, 7 colorectal, 5 RCC, 10 NSCLC and 2 prostate cancer patients |
Objective response: |
[239] |
Nivolumab |
Nivolumab 1 mg/kg, escalated to 3 mg/kg |
Three probe FISH assay: PDL2 (PDCD1LG2), PDL1 (CD274), control centromeric probe |
Hodgkin’s lymphoma |
- Malignant Reed-Sternberg cells identified and analyzed; Classified as follows: |
- 10 tumor samples available for analysis; All positive for PD-L1/PD-L2 alterations |
Primary outcomes (survival indices): |
[211] |
Pembrolizumab |
Pembrolizumab 10 mg/kg every 2 weeks |
PD-L1 IHC |
Recurrent/metastatic SCCHN |
- a minimum of 1% tumor cells positive for PD-L1 by IHC |
- 78% (81 of 104 patients) positive for PD-L1 |
- 60 patients positive for PD-L1 received treatment. |
KEYNOTE- 012 |
Pembrolizumab (MK3475) |
MK 3475 10 mg/kg every 3 weeks |
PD-L1 IHC |
NSCLC |
- Cut-off value defined by Youden Index from receiver operating characteristics curve, created using irRC assessments |
- 29% (9 of 31 patients) with PD-L1 expression score higher than potential cutoff value |
High PD-L1 expression score group: |
[219] |
Pembrolizumab (MK3475) |
MK 3475 2 mg/kg every 3 weeks or 10 mg/kg every 2 weeks or 10 mg/kg every 3 weeks. |
PD-L1 IHC |
Melanoma |
- ≥1% tumor cells exhibiting PD-L1 staining |
- 77% (55 of 71 patients) |
PD-L1 positive patients: |
[218] |
Abbreviations: PD-L1, Programmed death ligand-1; IHC, immunohistochemistry; ORR, overall response rate; PFS, progression free survival; OS, overall survival; HR, hazard ratio; NSCLC, non-small cell carcinoma; CI, confidence interval; RCC, renal cell carcinoma; SCCHN, squamous cell carcinoma of the head and neck; irRC, immune related response criteria.
Several preclinical and clinical studies have highlighted multiple issues associated with the use of PD-L1 IHC as a biomarker. There is a lack of consensus on the cut-off values that would define a positive PD-L1 IHC test result [214]. It has been observed that the tumors responsive to PD-1 inhibitor agents have a large variation in PD-L1 IHC expression, ranging from 14% in renal cell carcinoma (RCC), to near 100% in melanoma [214, 221–226]. On the other hand, tumors such as sarcoma and colorectal cancer that are presently believed to be less responsive to PD-1 inhibitor agents have been reported to exhibit PD-L1 IHC expression in a somewhat similar range [214, 226, 227]. This indicates that PD-L1 IHC status may not be the sole criteria to determine response to PD-1 inhibitors. Another concern associated with using PD-L1 IHC is the heterogeneous expression of PD-L1 protein within the tumor microenvironment, in-turn leading to interassay variability [228]. Lastly, the expression of PD-L1 is known to be dynamic. Several studies have noted that treatment with various anti-cancer agents may influence the expression of PD-L1 in tumor cells [229, 230]. Therefore, an appropriate timing for tumor biopsy needs to be established for optimizing patient selection. In order to achieve standardization of PD-L1 IHC for potential application as a predictive biomarker, it is critical to resolve the aforementioned issues associated with the same.
Recently, an automated PD-L1 IHC assay has been conceptualized in an effort to accomplish standardized testing for PD-L1 status [231]. The system utilizes 28-8 antibody for detecting PD-L1 in FFPE samples. This assay has been evaluated for nivolumab therapy in NSCLC specimens. Akin to the criteria used in nivolumab trials, the scoring system for the assay used 1% and 5% cut-off values for PD-L1 positivity. This scoring system was validated by three Clinical Laboratory Improvement Amendment certified labs [231]. The assay demonstrated high precision and reproducibility for PD-L1 status in NSCLC tissue specimens [231]. Further, data from two phase III clinical trials involving advanced NSCLC patients suggest that this assay may be used to identify candidates for nivolumab therapy [232, 233]. Several clinical studies are presently underway to validate the utility of this assay for case selection in nivolumab therapy [231]. Other PD-L1 IHC antibody clones include 22C3 (companion IHC for pembrolizumab), SP142 (companion IHC for atezolizumab) and SP263 (companion IHC for durvalumab). Nuances in PD-L1 IHC cutoff thresholds, tumor versus immune cell staining, and concordance across antibodies remain a central question in the field. Ongoing studies such as BLUEPRINT hope to reconcile differences between antibodies, however future endeavors will require clinical data to determine whether pathologic differences confer differential clinical outcome for patients.
Alternative biomarkers
Resolute efforts to identify reliable predictive biomarkers have resulted in evaluation of a diverse range of potential biomarker candidates. PCR based detection of single-locus DNA methylation has been gaining focus as a potential biomarker for cancer prognosis, diagnosis and response to various chemotherapy agents [234]. For the purpose of optimizing the utility of PCR in biomarker detection, newer techniques that have evolved from traditional PCR may serve to be promising tools. Such techniques include sensitive melting analysis after real-time methylation-specific PCR (SMART-MSP), methylation-sensitive high-resolution melting PCR (MS-HRM) and methylation-specific fluorescent amplicon generation PCR (MS-FLAG) among others [234]. O6-methylguanine-DNA methyltransferase (MGMT) is among the first DNA methylation biomarker to be identified [235]. Clinical studies demonstrated that MGMT methylation status, detected using methylation-specific PCR, may serve as a predictive biomarker for glioblastoma patients that were to receive temozolomide [236]. In light of these findings, it is reasonable to state that the potential role of DNA methylation PCR as a predictive biomarker merits comprehensive investigation.
A number of studies have documented an association between the intratumoral infiltration of T-cells and clinical outcomes in several malignancies. Preclinical data suggests that intratumoral cytotoxic T-cell infiltration may well be an indicator of prognosis in an exhaustive list of tumor histologies. This includes merkel cell carcinoma, CRC, urothelial carcinoma, anal squamous cell carcinoma and NSCLC among others [237–241]. In addition to the above, numerous studies have noted high lymphocyte infiltrate to be predictive of response to anti-cancer therapy as well. A retrospective analysis of core biopsies from breast cancer patients that received neoadjuvant therapy found that a higher intratumoral lymphocyte infiltration was associated with greater pathological complete response (pCR) rates as compared to tumors without any infiltrate [242]. Similarly, a study investigating CRC reported a statistically significant correlation between the high density of tumor-infiltrating lymphocytes at the invasive margin of CRC metastases in liver and an increase in PFS with chemotherapy [243]. In view of the above, it may be stated that density of tumor-infiltrating T-cells at the invasive margin may potentially serve as a predictive biomarker, pending substantiation of these findings with further evidence.
Conclusion
The advent of targeted therapy is expected to significantly improve outcomes in patients diagnosed with cancer. The successful application of targeted therapy agents warrants a robust protocol that identifies the presence of the target molecules in the tumor tissues of these patients. In the course of achieving this objective, numerous biomarkers have been developed for several malignancies that are predictive of response to respective targeted therapy (Figure 1).
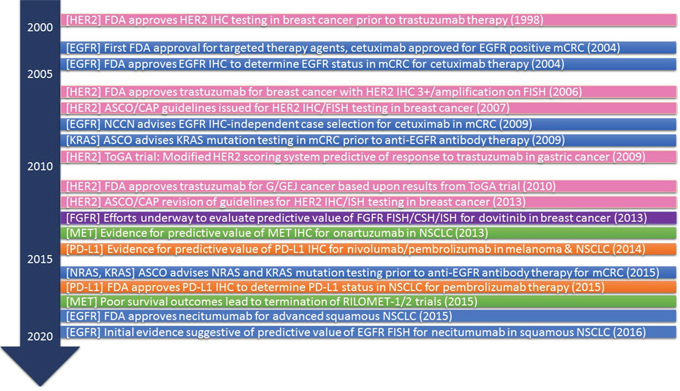
Figure 1: History of predictive biomarkers (IHC and FISH) for targeted therapy in oncology. Abbreviations: HER2, human epidermal growth factor receptor-2; FDA, Food and Drug Administration; IHC, immunohistochemistry; EGFR, epithelial growth factor receptor; ASCO, American Society of Clinical Oncology; CAP, College of American Pathologists; FISH, Fluorescent in situ hybridization; NCCN, National Comprehensive Cancer Network; mCRC, metastatic colorectal cancer; ToGA, trastuzumab for gastric cancer; G/GEJ, gastric/gastroesophageal cancer; FGFR, fibroblast growth factor receptor; CSH, Chromogenic in situ hybridization; ISH, in situ hybridization; PD-L1, programmed death ligand-1
Initial success in developing predictive biomarkers for trastuzumab therapy in HER2 positive breast cancer has led to new research efforts focused on identifying predictive biomarkers for drugs that target other molecules. These include EGFR IHC/FISH, FGFR FISH, MET IHC and PD-L1 IHC for respective targeted therapy agents in a variety of tumor histologies (Figure 1). However, several challenges have been uncovered in this pursuit.
There are several issues associated with the development and use of predictive biomarkers. One of the key concerns with biomarker testing is the definition of a positive test result. The criteria for positivity for each biomarker is a matter of persistent dispute since a lenient criteria would lead to unnecessary therapy and too strict of a criteria will lead to the exclusion of cases that could possibly benefit from targeted therapy agents. In order to resolve this issue, some clinical studies (evaluating PD-L1 IHC as a possible predictive biomarker) have presented outcomes stratified on the basis of a range of PD-L1 IHC positivity definitions. This approach may be replicated for other biomarkers as well to create a database that would serve a crucial role in defining the most appropriate cut-off for a positive test.
Several concerns associated with the procedure of biomarker testing warrant attention. The traditional methods for testing biomarkers lack uniformity and cannot be precisely replicated each time they are performed. This shortcoming has been partly overcome by the introduction of automated assays, yet a significant amount of operator variability is observed. As with HER2 testing in breast cancer, uniform sets of guidelines should be established for biomarker processing and analysis in order to standardize the testing process. In addition to the above, the reasons for one technique being a superior choice over the other for various biomarkers remain to be unclear [244–246]. As previously noted, FISH appears to be a better option in some while in others, IHC appears to be a better technique to evaluate biomarker status [244, 246]. Studies exploring the differences in mechanics and molecular aspects of these techniques would enhance our understanding of the variables that provide an edge to one technique over the other for a specific target. This knowledge would serve to assist in the selection of an ideal biomarker for a particular target molecule.
The feat of achieving maximum benefit from targeted therapy in cancer patients is currently hindered by numerous inadequacies in biomarker testing. Building upon our experiences thus far, we must apply lessons learned from focused research efforts to continue developing predictive biomarkers for anti-cancer therapy. It is truly essential that the challenges associated with biomarker development be met and resolved to achieve better outcomes in the treatment of cancer.
CONFLICTS OF INTEREST
The authors declare no conflicts of interest.
REFERENCES
1. Coons AH, Creech HJ, Jones RN. Immunological Properties of an Antibody Containing a Fluorescent Group. Experimental Biology and Medicine. 1941; 47: 200-2. doi: 10.3181/00379727-47-13084p.
2. Brandtzaeg P. The increasing power of immunohistochemistry and immunocytochemistry. J Immunol Methods. 1998; 216: 49-67.
3. Ramos Vara JA. Technical Aspects of Immunohistochemistry. Veterinary Pathology Online. 2005; 42: 405-26. doi: 10.1354/vp.42-4-405.
4. Ramos Vara JA, Miller MA. When tissue antigens and antibodies get along: revisiting the technical aspects of immunohistochemistry--the red, brown, and blue technique. Vet Pathol. 2014; 51: 42-87. doi: 10.1177/0300985813505879.
5. Tomao F, Papa A, Zaccarelli E, Rossi L, Caruso D, Minozzi M, Vici P, Frati L, Tomao S. Triple-negative breast cancer: new perspectives for targeted therapies. Onco Targets Ther. 2015; 8: 177-93. doi: 10.2147/OTT.S67673.
6. Leong AS, Wright J. The contribution of immunohistochemical staining in tumour diagnosis. Histopathology. 1987; 11: 1295-305.
7. Bodey B. The significance of immunohistochemistry in the diagnosis and therapy of neoplasms. Expert Opin Biol Ther. 2002; 2: 371-93. doi: 10.1517/14712598.2.4.371.
8. Jaffer S, Bleiweiss IJ. Beyond hematoxylin and eosin--the role of immunohistochemistry in surgical pathology. Cancer Invest. 2004; 22: 445-65.
9. de Matos LL, Trufelli DC, de Matos MG, da Silva Pinhal MA. Immunohistochemistry as an Important Tool in Biomarkers Detection and Clinical Practice. Biomarker Insights. 2010; 5: 9-20.
10. Gall JG, Pardue ML. Formation and detection of RNA-DNA hybrid molecules in cytological preparations. Proc Natl Acad Sci U S A. 1969; 63: 378-83.
11. Bishop R. Applications of fluorescence in situ hybridization (FISH) in detecting genetic aberrations of medical significance. Bioscience Horizons. 2010; 3: 85-95. doi: 10.1093/biohorizons/hzq009.
12. Moench TR. In situ hybridization. Mol Cell Probes. 1987; 1: 195-205.
13. Urbanek MO, Nawrocka AU, Krzyzosiak WJ. Small RNA Detection by in Situ Hybridization Methods. Int J Mol Sci. 2015; 16: 13259-86. doi: 10.3390/ijms160613259.
14. Bernuau D, Feldmann G. In situ hybridization: application to the study of gene expression during experimental hepatocarcinogenesis and human hepatocellular carcinoma. Tumour Biol. 1990; 11: 173-80.
15. Moreno Moya JM, Vilella F, Simon C. MicroRNA: key gene expression regulators. Fertil Steril. 2014; 101: 1516-23. doi: 10.1016/j.fertnstert.2013.10.042.
16. Boffa MC. In situ hybridization in hematology. Nouv Rev Fr Hematol. 1989; 31: 137-8.
17. Werner M, Chott A, Fabiano A, Battifora H. Effect of formalin tissue fixation and processing on immunohistochemistry. Am J Surg Pathol. 2000; 24: 1016-9.
18. Yaziji H, Barry T. Diagnostic Immunohistochemistry: what can go wrong? Adv Anat Pathol. 2006; 13: 238-46. doi: 10.1097/01.pap.0000213041.39070.2f.
19. Ried T, Liyanage M, du Manoir S, Heselmeyer K, Auer G, Macville M, Schrock E. Tumor cytogenetics revisited: comparative genomic hybridization and spectral karyotyping. J Mol Med (Berl). 1997; 75: 801-14.
20. Jamil A, Theil KS, Kahwash S, Ruymann FB, Klopfenstein KJ. TEL/AML-1 fusion gene. its frequency and prognostic significance in childhood acute lymphoblastic leukemia. Cancer Genet Cytogenet. 2000; 122: 73-8.
21. Savola S, Nardi F, Scotlandi K, Picci P, Knuutila S. Microdeletions in 9p21.3 induce false negative results in CDKN2A FISH analysis of Ewing sarcoma. Cytogenet Genome Res. 2007; 119: 21-6. doi: 10.1159/000109614.
22. Cayre A, Mishellany F, Lagarde N, Penault Llorca F. Comparison of different commercial kits for HER2 testing in breast cancer: looking for the accurate cutoff for amplification. Breast Cancer Res. 2007; 9: R64. doi: 10.1186/bcr1770.
23. Varga Z, Noske A. Impact of Modified 2013 ASCO/CAP Guidelines on HER2 Testing in Breast Cancer. One Year Experience. PLoS One. 2015; 10: e0140652. doi: 10.1371/journal.pone.0140652.
24. Penault-Llorca FM, Balaton AJ. Monoclonal antibodies in oncology: applications in diagnosis, prognosis and prediction of response to therapy on tissue specimens. [Article in French]. Bull Cancer. 2000; 87:794-803.
25. Masood S, Bui MM. Prognostic and predictive value of HER2/neu oncogene in breast cancer. Microsc Res Tech. 2002; 59: 102-8. doi: 10.1002/jemt.10181.
26. Slamon DJ, Godolphin W, Jones LA, Holt JA, Wong SG, Keith DE, Levin WJ, Stuart SG, Udove J, Ullrich A. Studies of the HER-2/neu proto-oncogene in human breast and ovarian cancer. Science. 1989; 244: 707-12.
27. Eltze E, Wülfing C, Von Struensee D, Piechota H, Buerger H, Hertle L. Cox-2 and Her2/neu co-expression in invasive bladder cancer. International journal of oncology. 2005; 26: 1525-31.
28. Beckhardt RN, Kiyokawa N, Xi L, Liu TJ, Hung MC, El Naggar AK, Zhang HZ, Clayman GL. HER-2/neu oncogene characterization in head and neck squamous cell carcinoma. Archives of Otolaryngology–Head & Neck Surgery. 1995; 121: 1265-70.
29. Menard S, Tagliabue E, Campiglio M, Pupa SM. Role of HER2 gene overexpression in breast carcinoma. J Cell Physiol. 2000; 182: 150-62. doi: 10.1002/(SICI)1097-4652(200002)182:2<150::AID-JCP3>3.0.CO;2-E.
30. Wolff AC, Hammond ME, Hicks DG, Dowsett M, McShane LM, Allison KH, Allred DC, Bartlett JM, Bilous M, Fitzgibbons P, Hanna W, Jenkins RB, Mangu PB, et al. Recommendations for human epidermal growth factor receptor 2 testing in breast cancer: American Society of Clinical Oncology/College of American Pathologists clinical practice guideline update. Arch Pathol Lab Med. 2014; 138: 241-56. doi: 10.5858/arpa.2013-0953-SA.
31. Thibault C, Khodari W, Lequoy M, Gligorov J, Belkacemi Y. HER2 status for prognosis and prediction of treatment efficacy in adenocarcinomas: a review. Crit Rev Oncol Hematol. 2013; 88: 123-33. doi: 10.1016/j.critrevonc.2013.03.003.
32. Hirsch FR, Witta S. Biomarkers for prediction of sensitivity to EGFR inhibitors in non-small cell lung cancer. Curr Opin Oncol. 2005; 17: 118-22.
33. Redman MW, Crowley JJ, Herbst RS, Hirsch FR, Gandara DR. Design of a Phase III Clinical Trial with Prospective Biomarker Validation: SWOG S0819. Clinical Cancer Research. 2012; 18: 4004-12. doi: 10.1158/1078-0432.ccr-12-0167.
34. Garon EB, Rizvi NA, Hui R, Leighl N, Balmanoukian AS, Eder JP, Patnaik A, Aggarwal C, Gubens M, Horn L, Carcereny E, Ahn MJ, Felip E, et al. Pembrolizumab for the Treatment of Non–Small-Cell Lung Cancer. New England Journal of Medicine. 2015; 372: 2018-28. doi:10.1056/NEJMoa1501824.
35. Burstein HJ. The Distinctive Nature of HER2-Positive Breast Cancers. New England Journal of Medicine. 2005; 353: 1652-4. doi:10.1056/NEJMp058197.
36. McKenzie S, DeSombre K, Bast B, Hollis D, Whitaker R, Berchuck A, Boyer C, Bast R. Serum levels of HER-2 neu (C-erbB-2) correlate with overexpression of p185neu in human ovarian cancer. Cancer. 1993; 71: 3942-6.
37. Hetzel DJ, Wilson TO, Keeney GL, Roche PC, Cha SS, Podratz KC. HER-2/neu expression: a major prognostic factor in endometrial cancer. Gynecologic oncology. 1992; 47: 179-85.
38. Schuell B, Gruenberger T, Scheithauer W, Zielinski C, Wrba F. HER 2/neu protein expression in colorectal cancer. BMC cancer. 2006; 6: 123.
39. Hirashima N, Takahashi W, Yoshii S, Yamane T, Ooi A. Protein overexpression and gene amplification of c-erbB-2 in pulmonary carcinomas: a comparative immunohistochemical and fluorescence in situ hybridization study. Modern Pathology. 2001; 14: 556-62.
40. Mitra A, Murty V, Pratap M, Sodhani P, Chaganti R. ERBB2 (HER2/neu) oncogene is frequently amplified in squamous cell carcinoma of the uterine cervix. Cancer research. 1994; 54: 637-9.
41. Kumar CC, Madison V. Drugs targeted against protein kinases. Expert Opin Emerg Drugs. 2001; 6: 303-15. doi: 10.1517/14728214.6.2.303.
42. Albanell J, Codony J, Rovira A, Mellado B, Gascon P. Mechanism of action of anti-HER2 monoclonal antibodies: scientific update on trastuzumab and 2C4. Adv Exp Med Biol. 2003; 532: 253-68.
43. Moja L, Tagliabue L, Balduzzi S, Parmelli E, Pistotti V, Guarneri V, D'Amico R. Trastuzumab containing regimens for early breast cancer. Cochrane Database Syst Rev. 2012; 4: CD006243. doi: 10.1002/14651858.CD006243.pub2.
44. Slamon D, Eiermann W, Robert N, Pienkowski T, Martin M, Press M, Mackey J, Glaspy J, Chan A, Pawlicki M, Pinter T, Valero V, Liu MC, et al. Adjuvant Trastuzumab in HER2-Positive Breast Cancer. The New England Journal of Medicine. 2011; 365: 1273-83. doi: 10.1056/NEJMoa0910383.
45. Perez EA, Romond EH, Suman VJ, Jeong JH, Sledge G, Geyer CE Jr, Martino S, Rastogi P, Gralow J, Swain SM, Winer EP, Colon-Otero G, Davidson NE, et al. Trastuzumab plus adjuvant chemotherapy for human epidermal growth factor receptor 2-positive breast cancer: planned joint analysis of overall survival from NSABP B-31 and NCCTG N9831. J Clin Oncol. 2014; 32: 3744-52. doi: 10.1200/jco.2014.55.5730.
46. Wolff AC, Hammond ME, Schwartz JN, Hagerty KL, Allred DC, Cote RJ, Dowsett M, Fitzgibbons PL, Hanna WM, Langer A, McShane LM, Paik S, Pegram MD, et al. American Society of Clinical Oncology/College of American Pathologists guideline recommendations for human epidermal growth factor receptor 2 testing in breast cancer. Arch Pathol Lab Med. 2007; 131: 18-43. doi: 10.1043/1543-2165(2007)131[18:ASOCCO]2.0.CO;2.
47. Lal P, Salazar PA, Ladanyi M, Chen B. Impact of polysomy 17 on HER-2/neu immunohistochemistry in breast carcinomas without HER-2/neu gene amplification. J Mol Diagn. 2003; 5: 155-9. doi: 10.1016/S1525-1578(10)60467-9.
48. Goud KI, Dayakar S, Vijayalaxmi K, Babu SJ, Reddy PV. Evaluation of HER-2/neu status in breast cancer specimens using immunohistochemistry (IHC) & fluorescence in-situ hybridization (FISH) assay. Indian J Med Res. 2012; 135: 312-7.
49. Striebel JM, Bhargava R, Horbinski C, Surti U, Dabbs DJ. The equivocally amplified HER2 FISH result on breast core biopsy: indications for further sampling do affect patient management. Am J Clin Pathol. 2008; 129: 383-90. doi: 10.1309/KFKDNK8CENVN24VU.
50. Brunelli M, Manfrin E, Martignoni G, Miller K, Remo A, Reghellin D, Bersani S, Gobbo S, Eccher A, Chilosi M, Bonetti F. Genotypic intratumoral heterogeneity in breast carcinoma with HER2/neu amplification: evaluation according to ASCO/CAP criteria. Am J Clin Pathol. 2009; 131: 678-82. doi: 10.1309/AJCP09VUTZWZXBMJ.
51. Yang YL, Fan Y, Lang RG, Gu F, Ren MJ, Zhang XM, Yin D, Fu L. Genetic heterogeneity of HER2 in breast cancer: impact on HER2 testing and its clinicopathologic significance. Breast Cancer Res Treat. 2012; 134: 1095-102. doi: 10.1007/s10549-012-2046-0.
52. Yang YL, Fan Y, Lang RG, Gu F, Fu L. [Association of HER2 genetic heterogeneity with clinicopathological characteristics in breast cancer]. Zhonghua Yi Xue Yi Chuan Xue Za Zhi. 2010; 27: 540-5. doi: 10.3760/cma.j .issn.1003-9406.2010.05.014.
53. Chmielecki J, Ross JS, Wang K, Frampton GM, Palmer GA, Ali SM, Palma N, Morosini D, Miller VA, Yelensky R, Lipson D, Stephens PJ. Oncogenic alterations in ERBB2/HER2 represent potential therapeutic targets across tumors from diverse anatomic sites of origin. Oncologist. 2015; 20: 7-12. doi: 10.1634/theoncologist.2014-0234.
54. Wolff AC, Hammond ME, Hicks DG, Dowsett M, McShane LM, Allison KH, Allred DC, Bartlett JM, Bilous M, Fitzgibbons P, Hanna W, Jenkins RB, Mangu PB, et al. Recommendations for human epidermal growth factor receptor 2 testing in breast cancer: American Society of Clinical Oncology/College of American Pathologists clinical practice guideline update. J Clin Oncol. 2013; 31: 3997-4013. doi: 10.1200/JCO.2013.50.9984.
55. Camp RL, Chung GG, Rimm DL. Automated subcellular localization and quantification of protein expression in tissue microarrays. Nature medicine. 2002; 8: 1323-8.
56. Gustavson MD, Bourke Martin B, Reilly D, Cregger M, Williams C, Mayotte J, Zerkowski M, Tedeschi G, Pinard R, Christiansen J. Standardization of HER2 immunohistochemistry in breast cancer by automated quantitative analysis. Archives of pathology & laboratory medicine. 2009; 133: 1413-9.
57. Giltnane JM, Molinaro A, Cheng H, Robinson A, Turbin D, Gelmon K, Huntsman D, Rimm DL. Comparison of quantitative immunofluorescence with conventional methods for HER2/neu testing with respect to response to trastuzumab therapy in metastatic breast cancer. Archives of pathology & laboratory medicine. 2008; 132: 1635-47.
58. Jorgensen JT. Targeted HER2 treatment in advanced gastric cancer. Oncology. 2010; 78: 26-33. doi: 10.1159/000288295.
59. Gravalos C, Jimeno A. HER2 in gastric cancer: a new prognostic factor and a novel therapeutic target. Ann Oncol. 2008; 19: 1523-9. doi: 10.1093/annonc/mdn169.
60. Yano T, Ochiai A, Doi T, Hashizume K, Nakanishi M, Ouchi K, Tanaka Y, Ohtsu A. Expression of HER2 in gastric cancer: Comparison between protein expression and gene amplification using a new commercial kit. J Clin Oncol (Meeting Abstracts). 2004; 22: 4053.
61. Tanner M, Hollmen M, Junttila T, Kapanen A, Tommola S, Soini Y, Helin H, Salo J, Joensuu H, Sihvo E. Amplification of HER-2 in gastric carcinoma: association with Topoisomerase IIα gene amplification, intestinal type, poor prognosis and sensitivity to trastuzumab. Annals of Oncology. 2005; 16: 273-8.
62. Hofmann M, Stoss O, Shi D, Buttner R, van de Vijver M, Kim W, Ochiai A, Ruschoff J, Henkel T. Assessment of a HER2 scoring system for gastric cancer: results from a validation study. Histopathology. 2008; 52: 797-805. doi: 10.1111/j.1365-2559.2008.03028.x.
63. Sheffield BS, Garratt J, Kalloger SE, Li-Chang HH, Torlakovic EE, Gilks CB, Schaeffer DF. HER2/neu testing in gastric cancer by immunohistochemistry: assessment of interlaboratory variation. Archives of Pathology and Laboratory Medicine. 2014; 138: 1495-502.
64. Bang Y, Chung H, Xu J, Lordick F, Sawaki A, Al Sakaff N, Lipatov O, See C, Rueschoff J, Van Cutsem E. Pathological features of advanced gastric cancer (GC): Relationship to human epidermal growth factor receptor 2 (HER2) positivity in the global screening programme of the ToGA trial. ASCO Meeting Abstracts. 2009; 27: 4556.
65. Bang YJ, Van Cutsem E, Feyereislova A, Chung HC, Shen L, Sawaki A, Lordick F, Ohtsu A, Omuro Y, Satoh T, Aprile G, Kulikov E, Hill J, et al. Trastuzumab in combination with chemotherapy versus chemotherapy alone for treatment of HER2-positive advanced gastric or gastro-oesophageal junction cancer (ToGA): a phase 3, open-label, randomised controlled trial. Lancet. 2010; 376: 687-97. doi: 10.1016/S0140-6736(10)61121-X.
66. Rüschoff J, Dietel M, Baretton G, Arbogast S, Walch A, Monges G, Chenard MP, Penault Llorca F, Nagelmeier I, Schlake W, Höfler H, Kreipe HH. HER2 diagnostics in gastric cancer—guideline validation and development of standardized immunohistochemical testing. Virchows Archiv. 2010; 457: 299-307. doi: 10.1007/s00428-010-0952-2.
67. Van Cutsem E, Kang Y, Chung H, Shen L, Sawaki A, Lordick F, Hill J, Lehle M, Feyereislova A, Bang Y. Efficacy results from the ToGA trial: A phase III study of trastuzumab added to standard chemotherapy (CT) in first-line human epidermal growth factor receptor 2 (HER2)-positive advanced gastric cancer (GC). ASCO Meeting Abstracts. 2009; 27: LBA4509.
68. Gomez Martin C, Plaza JC, Pazo-Cid R, Salud A, Pons F, Fonseca P, Leon A, Alsina M, Visa L, Rivera F, Galan MC, del Valle E, Vilardell F, et al. Level of HER2 Gene Amplification Predicts Response and Overall Survival in HER2-Positive Advanced Gastric Cancer Treated With Trastuzumab. Journal of Clinical Oncology. 2013; 31: 4445-52. doi: 10.1200/jco.2013.48.9070.
69. Amir E, Ocana A, Seruga B, Freedman O, Clemons M. Lapatinib and HER2 status: results of a meta-analysis of randomized phase III trials in metastatic breast cancer. Cancer Treat Rev. 2010; 36: 410-5. doi: 10.1016/j.ctrv.2009.12.012.
70. Kim JW, Kim HP, Im SA, Kang S, Hur HS, Yoon YK, Oh DY, Kim JH, Lee DS, Kim TY, Bang YJ. The growth inhibitory effect of lapatinib, a dual inhibitor of EGFR and HER2 tyrosine kinase, in gastric cancer cell lines. Cancer Lett. 2008; 272: 296-306. doi: 10.1016/j.canlet.2008.07.018.
71. Mimura K, Kono K, Maruyama T, Watanabe M, Izawa S, Shiba S, Mizukami Y, Kawaguchi Y, Inoue M, Kono T, Choudhury A, Kiessling R, Fujii H. Lapatinib inhibits receptor phosphorylation and cell growth and enhances antibody-dependent cellular cytotoxicity of EGFR- and HER2-overexpressing esophageal cancer cell lines. Int J Cancer. 2011; 129: 2408-16. doi: 10.1002/ijc.25896.
72. Wainberg ZA, Anghel A, Desai AJ, Ayala R, Luo T, Safran B, Fejzo MS, Hecht JR, Slamon DJ, Finn RS. Lapatinib, a dual EGFR and HER2 kinase inhibitor, selectively inhibits HER2-amplified human gastric cancer cells and is synergistic with trastuzumab in vitro and in vivo. Clin Cancer Res. 2010; 16: 1509-19. doi: 10.1158/1078-0432.CCR-09-1112.
73. Blackwell KL, Burstein HJ, Storniolo AM, Rugo HS, Sledge G, Aktan G, Ellis C, Florance A, Vukelja S, Bischoff J, Baselga J, O'Shaughnessy J. Overall survival benefit with lapatinib in combination with trastuzumab for patients with human epidermal growth factor receptor 2-positive metastatic breast cancer: final results from the EGF104900 Study. J Clin Oncol. 2012; 30: 2585-92. doi: 10.1200/jco.2011.35.6725.
74. Satoh T, Xu RH, Chung HC, Sun GP, Doi T, Xu JM, Tsuji A, Omuro Y, Li J, Wang JW, Miwa H, Qin SK, Chung IJ, et al. Lapatinib plus paclitaxel versus paclitaxel alone in the second-line treatment of HER2-amplified advanced gastric cancer in Asian populations: TyTAN--a randomized, phase III study. J Clin Oncol. 2014; 32: 2039-49. doi: 10.1200/JCO.2013.53.6136.
75. Hecht JR, Bang YJ, Qin SK, Chung HC, Xu JM, Park JO, Jeziorski K, Shparyk Y, Hoff PM, Sobrero A, Salman P, Li J, Protsenko SA, et al. Lapatinib in Combination With Capecitabine Plus Oxaliplatin in Human Epidermal Growth Factor Receptor 2-Positive Advanced or Metastatic Gastric, Esophageal, or Gastroesophageal Adenocarcinoma: TRIO-013/LOGiC-A Randomized Phase III Trial. J Clin Oncol. 2016; 34: 443-51. doi: 10.1200/jco.2015.62.6598.
76. Olayioye MA, Neve RM, Lane HA, Hynes NE. The ErbB signaling network: receptor heterodimerization in development and cancer. Embo j. 2000; 19: 3159-67. doi: 10.1093/emboj/19.13.3159.
77. Olayioye MA, Neve RM, Lane HA, Hynes NE. NEW EMBO MEMBERS' REVIEW: The ErbB signaling network: receptor heterodimerization in development and cancer. The EMBO Journal. 2000; 19: 3159-67. doi: 10.1093/emboj/19.13.3159.
78. Hynes NE, Lane HA. ERBB receptors and cancer: the complexity of targeted inhibitors. Nat Rev Cancer. 2005; 5: 341-54. doi: 10.1038/nrc1609.
79. Prabhakar CN. Epidermal growth factor receptor in non-small cell lung cancer. Translational Lung Cancer Research. 2015; 4: 110-8. doi: 10.3978/j.issn.2218-6751.2015.01.01.
80. Rimawi MF, Shetty PB, Weiss HL, Schiff R, Osborne CK, Chamness GC, Elledge RM. EGFR Expression in Breast Cancer Association with biologic phenotype and clinical outcomes. Cancer. 2010; 116: 1234-42. doi: 10.1002/cncr.24816.
81. Spano JP, Lagorce C, Atlan D, Milano G, Domont J, Benamouzig R, Attar A, Benichou J, Martin A, Morere JF, Raphael M, Penault-Llorca F, Breau JL, et al. Impact of EGFR expression on colorectal cancer patient prognosis and survival. Ann Oncol. 2005; 16: 102-8. doi: 10.1093/annonc/mdi006.
82. Ueda S, Ogata S, Tsuda H, Kawarabayashi N, Kimura M, Sugiura Y, Tamai S, Matsubara O, Hatsuse K, Mochizuki H. The correlation between cytoplasmic overexpression of epidermal growth factor receptor and tumor aggressiveness: poor prognosis in patients with pancreatic ductal adenocarcinoma. Pancreas. 2004; 29: e1-8.
83. Salomon DS, Brandt R, Ciardiello F, Normanno N. Epidermal growth factor-related peptides and their receptors in human malignancies. Crit Rev Oncol Hematol. 1995; 19: 183-232. doi:
84. Vincenzi B, Zoccoli A, Pantano F, Venditti O, Galluzzo S. Cetuximab: from bench to bedside. Curr Cancer Drug Targets. 2010; 10: 80-95.
85. Hadari Y, Doody J, Wang Y, Patel S, Apblett R, Loizos N, Pereira D, Witte L, Bohlen P, Hicklin D. (2004). The IgG1 monoclonal antibody cetuximab induces degradation of the epidermal growth factor receptor. ASCO Gastrointestinal Cancers Symposium, pp. 22-4.
86. Kang X, Patel D, Ng S, Melchior M, Ludwig D, Hicklin JD. (2007). High affinity Fc receptor binding and potent induction of antibody-dependent cellular cytotoxicity (ADCC) in vitro by anti-epidermal growth factor receptor antibody cetuximab. ASCO Annual Meeting Proceedings, pp. 3041.
87. Martinelli E, De Palma R, Orditura M, De Vita F, Ciardiello F. Anti-epidermal growth factor receptor monoclonal antibodies in cancer therapy. Clinical & Experimental Immunology. 2009; 158: 1-9. doi: 10.1111/j.1365-2249.2009.03992.x.
88. Cunningham D, Humblet Y, Siena S, Khayat D, Bleiberg H, Santoro A, Bets D, Mueser M, Harstrick A, Verslype C. Cetuximab monotherapy and cetuximab plus irinotecan in irinotecan-refractory metastatic colorectal cancer. New England journal of medicine. 2004; 351: 337-45.
89. Lenz HJ, Van Cutsem E, Khambata Ford S, Mayer RJ, Gold P, Stella P, Mirtsching B, Cohn AL, Pippas AW, Azarnia N. Multicenter phase II and translational study of cetuximab in metastatic colorectal carcinoma refractory to irinotecan, oxaliplatin, and fluoropyrimidines. Journal of Clinical Oncology. 2006; 24: 4914-21.
90. Saltz LB, Meropol NJ, Loehrer PJ, Needle MN, Kopit J, Mayer RJ. Phase II trial of cetuximab in patients with refractory colorectal cancer that expresses the epidermal growth factor receptor. Journal of Clinical Oncology. 2004; 22: 1201-8.
91. Sobrero AF, Maurel J, Fehrenbacher L, Scheithauer W, Abubakr YA, Lutz MP, Vega-Villegas ME, Eng C, Steinhauer EU, Prausova J. EPIC: phase III trial of cetuximab plus irinotecan after fluoropyrimidine and oxaliplatin failure in patients with metastatic colorectal cancer. Journal of Clinical Oncology. 2008; 26: 2311-9.
92. Bokemeyer C, Van Cutsem E, Rougier P, Ciardiello F, Heeger S, Schlichting M, Celik I, Köhne CH. Addition of cetuximab to chemotherapy as first-line treatment for KRAS wild-type metastatic colorectal cancer: pooled analysis of the CRYSTAL and OPUS randomised clinical trials. European journal of cancer. 2012; 48: 1466-75.
93. Vermorken JB, Trigo J, Hitt R, Koralewski P, Diaz-Rubio E, Rolland F, Knecht R, Amellal N, Schueler A, Baselga J. Open-label, uncontrolled, multicenter phase II study to evaluate the efficacy and toxicity of cetuximab as a single agent in patients with recurrent and/or metastatic squamous cell carcinoma of the head and neck who failed to respond to platinum-based therapy. Journal of Clinical Oncology. 2007; 25: 2171-7.
94. Bonner JA, Harari PM, Giralt J, Azarnia N, Shin DM, Cohen RB, Jones CU, Sur R, Raben D, Jassem J. Radiotherapy plus cetuximab for squamous-cell carcinoma of the head and neck. New England Journal of Medicine. 2006; 354: 567-78.
95. Vermorken JB, Mesia R, Rivera F, Remenar E, Kawecki A, Rottey S, Erfan J, Zabolotnyy D, Kienzer HR, Cupissol D. Platinum-based chemotherapy plus cetuximab in head and neck cancer. New England Journal of Medicine. 2008; 359: 1116-27.
96. Mesía R, Rivera F, Kawecki A, Rottey S, Hitt R, Kienzer H, Cupissol D, De Raucourt D, Benasso M, Koralewski P. Quality of life of patients receiving platinum-based chemotherapy plus cetuximab first line for recurrent and/or metastatic squamous cell carcinoma of the head and neck. Annals of Oncology. 2010; 21: 1967-73.
97. Faruki H, Lai Goldman M. Application of a pharmacogenetic test adoption model to six oncology biomarkers. Personalized Medicine. 2010; 7: 441-50.
98. Chung KY, Shia J, Kemeny NE, Shah M, Schwartz GK, Tse A, Hamilton A, Pan D, Schrag D, Schwartz L, Klimstra DS, Fridman D, Kelsen DP, et al. Cetuximab shows activity in colorectal cancer patients with tumors that do not express the epidermal growth factor receptor by immunohistochemistry. J Clin Oncol. 2005; 23: 1803-10. doi: 10.1200/JCO.2005.08.037.
99. Wierzbicki R, Jonker DJ, Moore MJ, Berry SR, Loehrer PJ, Youssoufian H, Rowinsky EK. A phase II, multicenter study of cetuximab monotherapy in patients with refractory, metastatic colorectal carcinoma with absent epidermal growth factor receptor immunostaining. Invest New Drugs. 2011; 29: 167-74. doi: 10.1007/s10637-009-9341-6.
100. Engstrom PF, Arnoletti JP, Benson AB 3rd, Chen YJ, Choti MA, Cooper HS, Covey A, Dilawari RA, Early DS, Enzinger PC, Fakih MG, Fleshman J Jr, Fuchs C, et al. NCCN Clinical Practice Guidelines in Oncology: colon cancer. J Natl Compr Canc Netw. 2009; 7: 778-831.
101. Hirsch FR, Herbst RS, Olsen C, Chansky K, Crowley J, Kelly K, Franklin WA, Bunn PA Jr, Varella Garcia M, Gandara DR. Increased EGFR gene copy number detected by fluorescent in situ hybridization predicts outcome in non-small-cell lung cancer patients treated with cetuximab and chemotherapy. J Clin Oncol. 2008; 26: 3351-7. doi: 10.1200/jco.2007.14.0111.
102. Moroni M, Veronese S, Benvenuti S, Marrapese G, Sartore Bianchi A, Di Nicolantonio F, Gambacorta M, Siena S, Bardelli A. Gene copy number for epidermal growth factor receptor (EGFR) and clinical response to antiEGFR treatment in colorectal cancer: a cohort study. Lancet Oncol. 2005; 6: 279-86. doi: 10.1016/s1470-2045(05)70102-9.
103. Italiano A, Follana P, Caroli FX, Badetti JL, Benchimol D, Garnier G, Gugenheim J, Haudebourg J, Keslair F, Lesbats G, Lledo G, Roussel JF, Pedeutour F, et al. Cetuximab shows activity in colorectal cancer patients with tumors for which FISH analysis does not detect an increase in EGFR gene copy number. Ann Surg Oncol. 2008; 15: 649-54. doi: 10.1245/s10434-007-9667-2.
104. Weinberg RA. Fewer and fewer oncogenes. Cell. 1982; 30: 3-4.
105. Kranenburg O. The KRAS oncogene: past, present, and future. Biochim Biophys Acta. 2005; 1756: 81-2. doi: 10.1016/j.bbcan.2005.10.001.
106. Quinlan MP, Settleman J. Isoform-specific ras functions in development and cancer. Future Oncol. 2009; 5:105-16.
107. Prior IA, Lewis PD, Mattos C. A comprehensive survey of Ras mutations in cancer. Cancer Res. 2012; 72: 2457-67. doi: 10.1158/0008-5472.can-11-2612.
108. Bazan V, Migliavacca M, Zanna I, Tubiolo C, Grassi N, Latteri MA, La Farina M, Albanese I, Dardanoni G, Salerno S, Tomasino RM, Labianca R, Gebbia N, et al. Specific codon 13 K-ras mutations are predictive of clinical outcome in colorectal cancer patients, whereas codon 12 K-ras mutations are associated with mucinous histotype. Annals of Oncology. 2002; 13: 1438-46. doi: 10.1093/annonc/mdf226.
109. Normanno N, Tejpar S, Morgillo F, De Luca A, Van Cutsem E, Ciardiello F. Implications for KRAS status and EGFR-targeted therapies in metastatic CRC. Nat Rev Clin Oncol. 2009; 6: 519-27. doi: 10.1038/nrclinonc.2009.111.
110. Bokemeyer C, Bondarenko I, Makhson A, Hartmann JT, Aparicio J, de Braud F, Donea S, Ludwig H, Schuch G, Stroh C, Loos AH, Zubel A, Koralewski P. Fluorouracil, leucovorin, and oxaliplatin with and without cetuximab in the first-line treatment of metastatic colorectal cancer. J Clin Oncol. 2009; 27: 663-71. doi: 10.1200/jco.2008.20.8397.
111. De Roock W, Piessevaux H, De Schutter J, Janssens M, De Hertogh G, Personeni N, Biesmans B, Van Laethem JL, Peeters M, Humblet Y, Van Cutsem E, Tejpar S. KRAS wild-type state predicts survival and is associated to early radiological response in metastatic colorectal cancer treated with cetuximab. Ann Oncol. 2008; 19: 508-15. doi: 10.1093/annonc/mdm496.
112. Di Fiore F, Blanchard F, Charbonnier F, Le Pessot F, Lamy A, Galais MP, Bastit L, Killian A, Sesboue R, Tuech JJ, Queuniet AM, Paillot B, Sabourin JC, et al. Clinical relevance of KRAS mutation detection in metastatic colorectal cancer treated by Cetuximab plus chemotherapy. Br J Cancer. 2007; 96: 1166-9. doi: 10.1038/sj.bjc.6603685.
113. Tol J, Koopman M, Rodenburg CJ, Cats A, Creemers GJ, Schrama JG, Erdkamp FL, Vos AH, Mol L, Antonini NF, Punt CJ. A randomised phase III study on capecitabine, oxaliplatin and bevacizumab with or without cetuximab in first-line advanced colorectal cancer, the CAIRO2 study of the Dutch Colorectal Cancer Group (DCCG). An interim analysis of toxicity. Ann Oncol. 2008; 19: 734-8. doi: 10.1093/annonc/mdm607.
114. Lievre A, Bachet JB, Le Corre D, Boige V, Landi B, Emile JF, Cote JF, Tomasic G, Penna C, Ducreux M, Rougier P, Penault Llorca F, Laurent Puig P. KRAS mutation status is predictive of response to cetuximab therapy in colorectal cancer. Cancer Res. 2006; 66: 3992-5. doi: 10.1158/0008-5472.can-06-0191.
115. Karapetis CS, Khambata Ford S, Jonker DJ, O'Callaghan CJ, Tu D, Tebbutt NC, Simes RJ, Chalchal H, Shapiro JD, Robitaille S, Price TJ, Shepherd L, Au HJ, et al. K-ras mutations and benefit from cetuximab in advanced colorectal cancer. N Engl J Med. 2008; 359: 1757-65. doi: 10.1056/NEJMoa0804385.
116. Van Cutsem E, Lang I, D'haens G, Moiseyenko V, Zaluski J, Folprecht G, Tejpar S, Kisker O, Stroh C, Rougier P. (2008). KRAS status and efficacy in the first-line treatment of patients with metastatic colorectal cancer (mCRC) treated with FOLFIRI with or without cetuximab: The CRYSTAL experience. ASCO Annual Meeting Proceedings, pp. 2.
117. Lievre A, Bachet JB, Boige V, Cayre A, Le Corre D, Buc E, Ychou M, Bouche O, Landi B, Louvet C, Andre T, Bibeau F, Diebold MD, et al. KRAS mutations as an independent prognostic factor in patients with advanced colorectal cancer treated with cetuximab. J Clin Oncol. 2008; 26: 374-9. doi: 10.1200/jco.2007.12.5906.
118. Van Cutsem E, Kohne CH, Hitre E, Zaluski J, Chang Chien CR, Makhson A, D'Haens G, Pinter T, Lim R, Bodoky G, Roh JK, Folprecht G, Ruff P, et al. Cetuximab and chemotherapy as initial treatment for metastatic colorectal cancer. N Engl J Med. 2009; 360: 1408-17. doi: 10.1056/NEJMoa0805019.
119. De Roock W, Jonker DJ, Di Nicolantonio F, Sartore-Bianchi A, Tu D, Siena S, Lamba S, Arena S, Frattini M, Piessevaux H, Van Cutsem E, O'Callaghan CJ, Khambata-Ford S, et al. ASsociation of kras p.g13d mutation with outcome in patients with chemotherapy-refractory metastatic colorectal cancer treated with cetuximab. JAMA. 2010; 304: 1812-20. doi: 10.1001/jama.2010.1535.
120. Allegra CJ, Jessup JM, Somerfield MR, Hamilton SR, Hammond EH, Hayes DF, McAllister PK, Morton RF, Schilsky RL. American Society of Clinical Oncology provisional clinical opinion: testing for KRAS gene mutations in patients with metastatic colorectal carcinoma to predict response to anti-epidermal growth factor receptor monoclonal antibody therapy. J Clin Oncol. 2009; 27: 2091-6. doi: 10.1200/jco.2009.21.9170.
121. Van Cutsem E, Köhne CH, Láng I, Folprecht G, Nowacki MP, Cascinu S, Shchepotin I, Maurel J, Cunningham D, Tejpar S, Schlichting M, Zubel A, Celik I, et al. Cetuximab Plus Irinotecan, Fluorouracil, and Leucovorin As First-Line Treatment for Metastatic Colorectal Cancer: Updated Analysis of Overall Survival According to Tumor KRAS and BRAF Mutation Status. Journal of Clinical Oncology. 2011; 29: 2011-9. doi: 10.1200/jco.2010.33.5091.
122. Van Cutsem E, Lenz HJ, Köhne CH, Heinemann V, Tejpar S, Melezínek I, Beier F, Stroh C, Rougier P, van Krieken JH, Ciardiello F. Fluorouracil, Leucovorin, and Irinotecan Plus Cetuximab Treatment and RAS Mutations in Colorectal Cancer. Journal of Clinical Oncology. 2015; 33: 692-700. doi: 10.1200/jco.2014.59.4812.
123. Douillard JY, Pirker R, O'Byrne KJ, Kerr KM, Storkel S, von Heydebreck A, Grote HJ, Celik I, Shepherd FA. Relationship between EGFR expression, EGFR mutation status, and the efficacy of chemotherapy plus cetuximab in FLEX study patients with advanced non-small-cell lung cancer. J Thorac Oncol. 2014; 9: 717-24. doi: 10.1097/jto.0000000000000141.
124. Allegra CJ, Rumble RB, Hamilton SR, Mangu PB, Roach N, Hantel A, Schilsky RL. Extended RAS Gene Mutation Testing in Metastatic Colorectal Carcinoma to Predict Response to Anti–Epidermal Growth Factor Receptor Monoclonal Antibody Therapy: American Society of Clinical Oncology Provisional Clinical Opinion Update 2015. Journal of Clinical Oncology. 2015. doi: 10.1200/jco.2015.63.9674.
125. Lynch TJ, Patel T, Dreisbach L, McCleod M, Heim WJ, Hermann RC, Paschold E, Iannotti NO, Dakhil S, Gorton S, Pautret V, Weber MR, Woytowitz D. Cetuximab and First-Line Taxane/Carboplatin Chemotherapy in Advanced Non–Small-Cell Lung Cancer: Results of the Randomized Multicenter Phase III Trial BMS099. Journal of Clinical Oncology. 2010; 28: 911-7. doi: 10.1200/jco.2009.21.9618.
126. O'Byrne KJ, Gatzemeier U, Bondarenko I, Barrios C, Eschbach C, Martens UM, Hotko Y, Kortsik C, Paz-Ares L, Pereira JR, von Pawel J, Ramlau R, Roh JK, et al. Molecular biomarkers in non-small-cell lung cancer: a retrospective analysis of data from the phase 3 FLEX study. Lancet Oncol. 2011; 12: 795-805. doi: 10.1016/s1470-2045(11)70189-9.
127. Pirker R, Pereira JR, von Pawel J, Krzakowski M, Ramlau R, Park K, de Marinis F, Eberhardt WE, Paz Ares L, Störkel S. EGFR expression as a predictor of survival for first-line chemotherapy plus cetuximab in patients with advanced non-small-cell lung cancer: analysis of data from the phase 3 FLEX study. The lancet oncology. 2012; 13: 33-42.
128. Khambata Ford S, Harbison CT, Hart LL, Awad M, Xu LA, Horak CE, Dakhil S, Hermann RC, Lynch TJ, Weber MR. Analysis of Potential Predictive Markers of Cetuximab Benefit in BMS099, a Phase III Study of Cetuximab and First-Line Taxane/Carboplatin in Advanced Non–Small-Cell Lung Cancer. Journal of Clinical Oncology. 2010; 28: 918-27. doi: 10.1200/jco.2009.25.2890.
129. Herbst R, Redman M, Kim ES, Semrad TJ, Bazhenova L, Masters G, Oettel K, Guaglianone P, Reynolds C, Karnad A. (2015). A randomized, phase III study comparing carboplatin/paclitaxel or carboplatin/paclitaxel/bevacizumab with or without concurrent cetuximab in patients with advanced non-small cell lung cancer (NSCLC): SWOG S0819. JOURNAL OF THORACIC ONCOLOGY: ELSEVIER SCIENCE INC 360 PARK AVE SOUTH, NEW YORK, NY 10010-1710 USA), pp. S795-S.
130. Paz Ares L, Mezger J, Ciuleanu TE, Fischer JR, von Pawel J, Provencio M, Kazarnowicz A, Losonczy G, de Castro G Jr, Szczesna A, Crino L, Reck M, Ramlau R, et al. Necitumumab plus pemetrexed and cisplatin as first-line therapy in patients with stage IV non-squamous non-small-cell lung cancer (INSPIRE): an open-label, randomised, controlled phase 3 study. Lancet Oncol. 2015; 16: 328-37. doi: 10.1016/S1470-2045(15)70046-X.
131. Thatcher N, Hirsch FR, Luft AV, Szczesna A, Ciuleanu TE, Dediu M, Ramlau R, Galiulin RK, Bálint B, Losonczy G. Necitumumab plus gemcitabine and cisplatin versus gemcitabine and cisplatin alone as first-line therapy in patients with stage IV squamous non-small-cell lung cancer (SQUIRE): an open-label, randomised, controlled phase 3 trial. The lancet oncology. 2015; 16: 763-74.
132. Paz Ares L, Mezger J, Ciuleanu TE, Fischer JR, von Pawel J, Provencio M, Kazarnowicz A, Losonczy G, de Castro G, Szczesna A. Necitumumab plus pemetrexed and cisplatin as first-line therapy in patients with stage IV non-squamous non-small-cell lung cancer (INSPIRE): an open-label, randomised, controlled phase 3 study. The Lancet Oncology. 2015; 16: 328-37.
133. Pirker R. Epidermal growth factor receptor-directed monoclonal antibodies in nonsmall cell lung cancer: an update. Curr Opin Oncol. 2015; 27: 87-93. doi: 10.1097/CCO.0000000000000162.
134. Hirsch F, Boyle T, Thatcher N, Paz Ares L, Varella Garcia M, Kowalewski A, Hozak R, Mi G, Melemed S, Caldwell C. EGFR IHC and FISH Correlative Analyses (SQUIRE Trial): necitumumab plus gemcitabine-cisplatin vs gemcitabine-cisplatin in 1st-line squamous NSCLC. Journal of Thoracic Oncology. 2015.
135. Garnock Jones KP. Necitumumab: First global approval. Drugs. 2016; 76: 283-9.
136. Genova C, Hirsch FR. Clinical potential of necitumumab in non-small cell lung carcinoma. OncoTargets and therapy. 2016; 9: 5427.
137. Bottaro DP, Rubin JS, Faletto DL, Chan AM, Kmiecik TE, Vande Woude GF, Aaronson SA. Identification of the hepatocyte growth factor receptor as the c-met proto-oncogene product. Science. 1991; 251: 802-4.
138. Ponzetto C, Bardelli A, Zhen Z, Maina F, dalla Zonca P, Giordano S, Graziani A, Panayotou G, Comoglio PM. A multifunctional docking site mediates signaling and transformation by the hepatocyte growth factor/scatter factor receptor family. Cell. 1994; 77: 261-71.
139. Johnson GL, Lapadat R. Mitogen-activated protein kinase pathways mediated by ERK, JNK, and p38 protein kinases. Science. 2002; 298: 1911-2. doi: 10.1126/science.1072682.
140. Furge KA, Zhang YW, Vande Woude GF. Met receptor tyrosine kinase: enhanced signaling through adapter proteins. Oncogene. 2000; 19: 5582-9. doi: 10.1038/sj.onc.1203859.
141. Fan S, Gao M, Meng Q, Laterra JJ, Symons MH, Coniglio S, Pestell RG, Goldberg ID, Rosen EM. Role of NF-kappaB signaling in hepatocyte growth factor/scatter factor-mediated cell protection. Oncogene. 2005; 24: 1749-66. doi: 10.1038/sj.onc.1208327.
142. Rosario M, Birchmeier W. How to make tubes: signaling by the Met receptor tyrosine kinase. Trends Cell Biol. 2003; 13: 328-35.
143. Birchmeier C, Birchmeier W, Gherardi E, Vande Woude GF. Met, metastasis, motility and more. Nat Rev Mol Cell Biol. 2003; 4: 915-25. doi: 10.1038/nrm1261.
144. Zhang YW, Vande Woude GF. HGF/SF-met signaling in the control of branching morphogenesis and invasion. J Cell Biochem. 2003; 88: 408-17. doi: 10.1002/jcb.10358.
145. Borowiak M, Garratt AN, Wüstefeld T, Strehle M, Trautwein C, Birchmeier C. Met provides essential signals for liver regeneration. Proceedings of the National Academy of Sciences of the United States of America. 2004; 101: 10608-13. doi: 10.1073/pnas.0403412101.
146. Huh CG, Factor VM, Sánchez A, Uchida K, Conner EA, Thorgeirsson SS. Hepatocyte growth factor/c-met signaling pathway is required for efficient liver regeneration and repair. Proceedings of the National Academy of Sciences of the United States of America. 2004; 101: 4477-82. doi: 10.1073/pnas.0306068101.
147. Morishita R, Aoki M, Hashiya N, Yamasaki K, Kurinami H, Shimizu S, Makino H, Takesya Y, Azuma J, Ogihara T. Therapeutic angiogenesis using hepatocyte growth factor (HGF). Curr Gene Ther. 2004; 4: 199-206.
148. Matsumoto K, Nakamura T. Hepatocyte growth factor: renotropic role and potential therapeutics for renal diseases. Kidney Int. 2001; 59: 2023-38. doi: 10.1046/j.1523-1755.2001.00717.x.
149. Garajová I, Giovannetti E, Biasco G, Peters GJ. c-Met as a Target for Personalized Therapy. Translational Oncogenomics. 2015; 7: 13-31. doi: 10.4137/TOG.S30534.
150. de Melo Gagliato D, Fontes Jardim DL, Falchook G, Tang C, Zinner R, Wheler JJ, Janku F, Subbiah V, Piha Paul SA, Fu S, Hess K, Roy-Chowdhuri S, Moulder S, et al. Analysis of MET Genetic Aberrations in Patients With Breast Cancer at MD Anderson Phase I Unit. Clinical breast cancer. 2014; 14: 468-74. doi: 10.1016/j.clbc.2014.06.001.
151. Dziadziuszko R, Wynes MW, Singh S, Asuncion BR, Ranger Moore J, Konopa K, Rzyman W, Szostakiewicz B, Jassem J, Hirsch FR. Correlation between MET Gene Copy Number by Silver in Situ Hybridization and Protein Expression by Immunohistochemistry in Non-Small-Cell Lung Cancer. Journal of Thoracic Oncology. 2012; 7: 340-7. doi: 10.1097/JTO.0b013e318240ca0d.
152. Christensen JG, Burrows J, Salgia R. c-Met as a target for human cancer and characterization of inhibitors for therapeutic intervention. Cancer Lett. 2005; 225: 1-26. doi: 10.1016/j.canlet.2004.09.044.
153. Peruzzi B, Bottaro DP. Targeting the c-Met signaling pathway in cancer. Clin Cancer Res. 2006; 12: 3657-60. doi: 10.1158/1078-0432.ccr-06-0818.
154. Papotti M, Olivero M, Volante M, Negro F, Prat M, Comoglio PM, DiRenzo MF. Expression of Hepatocyte Growth Factor (HGF) and its Receptor (MET) in Medullary Carcinoma of the Thyroid. Endocr Pathol. 2000; 11: 19-30.
155. Wu CW, Li AF, Chi CW, Chung WW, Liu TY, Lui WY, P'Eng FK. Hepatocyte growth factor and Met/HGF receptors in patients with gastric adenocarcinoma. Oncol Rep. 1998; 5: 817-22.
156. Spigel DR, Ervin TJ, Ramlau RA, Daniel DB, Goldschmidt JH Jr, Blumenschein GR Jr, Krzakowski MJ, Robinet G, Godbert B, Barlesi F, Govindan R, Patel T, Orlov SV, et al. Randomized phase II trial of Onartuzumab in combination with erlotinib in patients with advanced non-small-cell lung cancer. J Clin Oncol. 2013; 31: 4105-14. doi: 10.1200/jco.2012.47.4189.
157. Burgess TL, Sun J, Meyer S, Tsuruda TS, Sun J, Elliott G, Chen Q, Haniu M, Barron WF, Juan T, Zhang K, Coxon A, Kendall RL. Biochemical characterization of AMG 102: a neutralizing, fully human monoclonal antibody to human and nonhuman primate hepatocyte growth factor. Mol Cancer Ther. 2010; 9: 400-9. doi: 10.1158/1535-7163.mct-09-0824.
158. Oliner KS, Tang R, Anderson A, Lan Y, Iveson T, Donehower RC, Jiang Y, Dubey S, Loh E. (2012). Evaluation of MET pathway biomarkers in a phase II study of rilotumumab (R, AMG 102) or placebo (P) in combination with epirubicin, cisplatin, and capecitabine (ECX) in patients (pts) with locally advanced or metastatic gastric (G) or esophagogastric junction (EGJ) cancer. ASCO Annual Meeting Proceedings, pp. 4005.
159. Cunningham D, Tebbutt NC, Davidenko I, Murad AM, Al Batran SE, Ilson DH, Tjulandin S, Gotovkin E, Karaszewska B, Bondarenko I. (2015). Phase III, randomized, double-blind, multicenter, placebo (P)-controlled trial of rilotumumab (R) plus epirubicin, cisplatin and capecitabine (ECX) as first-line therapy in patients (pts) with advanced MET-positive (pos) gastric or gastroesophageal junction (G/GEJ) cancer: RILOMET-1 study. ASCO Annual Meeting Proceedings, pp. 4000.
160. Kang YK, Muro K, Jiang Y, Jain RK, Lizambri R. (2015). A phase 3, multicenter, randomized, double-blind, placebo-controlled study of rilotumumab in combination with cisplatin and capecitabine (CX) as first-line therapy for Asian patients (pts) with advanced MET-positive gastric or gastroesophageal junction (G/GEJ) adenocarcinoma: The RILOMET-2 trial. ASCO Annual Meeting Proceedings, pp. TPS226.
161. Koeppen H, Rost S, Yauch RL. Developing biomarkers to predict benefit from HGF/MET pathway inhibitors. J Pathol. 2014; 232: 210-8. doi: 10.1002/path.4268.
162. Neilson KM, Friesel R. Ligand-independent activation of fibroblast growth factor receptors by point mutations in the extracellular, transmembrane, and kinase domains. J Biol Chem. 1996; 271: 25049-57.
163. Johnson DE, Williams LT. Structural and functional diversity in the FGF receptor multigene family. Advances in cancer research. 1993; 60: 1.
164. Wilkie AO, Morriss Kay GM, Jones EY, Heath JK. Functions of fibroblast growth factors and their receptors. Current Biology. 1995; 5: 500-7.
165. Johnson DE, Lu J, Chen H, Werner S, Williams LT. The human fibroblast growth factor receptor genes: a common structural arrangement underlies the mechanisms for generating receptor forms that differ in their third immunoglobulin domain. Molecular and Cellular Biology. 1991; 11: 4627-34.
166. Chellaiah AT, McEwen DG, Werner S, Xu J, Ornitz DM. Fibroblast growth factor receptor (FGFR) 3. Alternative splicing in immunoglobulin-like domain III creates a receptor highly specific for acidic FGF/FGF-1. Journal of Biological Chemistry. 1994; 269: 11620-7.
167. Zimmer Y, Givol D, Yayon A. Multiple structural elements determine ligand binding of fibroblast growth factor receptors. Evidence that both Ig domain 2 and 3 define receptor specificity. Journal of Biological Chemistry. 1993; 268: 7899-903.
168. Cheon HG, LaRochelle WJ, Bottaro DP, Burgess WH, Aaronson SA. High-affinity binding sites for related fibroblast growth factor ligands reside within different receptor immunoglobulin-like domains. Proceedings of the National Academy of Sciences. 1994; 91: 989-93. doi: 10.1073/pnas.91.3.989.
169. Miki T, Bottaro DP, Fleming TP, Smith CL, Burgess WH, Chan AM, Aaronson SA. Determination of ligand-binding specificity by alternative splicing: two distinct growth factor receptors encoded by a single gene. Proceedings of the National Academy of Sciences. 1992; 89: 246-50.
170. Ahmad I, Iwata T, Leung HY. Mechanisms of FGFR-mediated carcinogenesis. Biochimica et Biophysica Acta (BBA)-Molecular Cell Research. 2012; 1823: 850-60.
171. Jang JH, Shin KH, Park JG. Mutations in fibroblast growth factor receptor 2 and fibroblast growth factor receptor 3 genes associated with human gastric and colorectal cancers. Cancer Research. 2001; 61: 3541-3.
172. Kunii K, Davis L, Gorenstein J, Hatch H, Yashiro M, Di Bacco A, Elbi C, Lutterbach B. FGFR2-amplified gastric cancer cell lines require FGFR2 and Erbb3 signaling for growth and survival. Cancer research. 2008; 68: 2340-8.
173. Cha JY, Maddileti S, Mitin N, Harden TK, Der CJ. Aberrant receptor internalization and enhanced FRS2-dependent signaling contribute to the transforming activity of the fibroblast growth factor receptor 2 IIIb C3 isoform. Journal of Biological Chemistry. 2009; 284: 6227-40.
174. Jacquemier J, Adelaide J, Parc P, Penault Llorca F, Planche J, Delapeyriere O, Birnbaum D. Expression of the FGFR1 gene in human breast‐carcinoma cells. International journal of cancer. 1994; 59: 373-8.
175. Meyer KB, Maia AT, O'Reilly M, Teschendorff AE, Chin SF, Caldas C, Ponder BA. Allele-specific up-regulation of FGFR2 increases susceptibility to breast cancer. PLoS Biol. 2008; 6: e108.
176. Chin K, DeVries S, Fridlyand J, Spellman PT, Roydasgupta R, Kuo WL, Lapuk A, Neve RM, Qian Z, Ryder T. Genomic and transcriptional aberrations linked to breast cancer pathophysiologies. Cancer cell. 2006; 10: 529-41.
177. Gelsi Boyer V, Orsetti B, Cervera N, Finetti P, Sircoulomb F, Rougé C, Lasorsa L, Letessier A, Ginestier C, Monville F. Comprehensive profiling of 8p11-12 amplification in breast cancer. Molecular Cancer Research. 2005; 3: 655-67.
178. Reis Filho JS, Simpson PT, Turner NC, Lambros MB, Jones C, Mackay A, Grigoriadis A, Sarrio D, Savage K, Dexter T. FGFR1 emerges as a potential therapeutic target for lobular breast carcinomas. Clinical Cancer Research. 2006; 12: 6652-62.
179. Hunter DJ, Kraft P, Jacobs KB, Cox DG, Yeager M, Hankinson SE, Wacholder S, Wang Z, Welch R, Hutchinson A. A genome-wide association study identifies alleles in FGFR2 associated with risk of sporadic postmenopausal breast cancer. Nature genetics. 2007; 39: 870-4.
180. Dutt A, Salvesen HB, Chen TH, Ramos AH, Onofrio RC, Hatton C, Nicoletti R, Winckler W, Grewal R, Hanna M. Drug-sensitive FGFR2 mutations in endometrial carcinoma. Proceedings of the National Academy of Sciences. 2008; 105: 8713-7.
181. Pollock P, Gartside M, Dejeza L, Powell M, Mallon MA, Davies H, Mohammadi M, Futreal P, Stratton M, Trent J. Frequent activating FGFR2 mutations in endometrial carcinomas parallel germline mutations associated with craniosynostosis and skeletal dysplasia syndromes. Oncogene. 2007; 26: 7158-62.
182. van Rhijn BW, van Tilborg AA, Lurkin I, Bonaventure J, de Vries A, Thiery JP, van der Kwast TH, Zwarthoff EC, Radvanyi F. Novel fibroblast growth factor receptor 3 (FGFR3) mutations in bladder cancer previously identified in non-lethal skeletal disorders. European Journal of Human Genetics. 2002; 10: 819-24.
183. Cappellen D, De Oliveira C, Ricol D, de Medina S, Bourdin J, Sastre Garau X, Chopin D, Thiery JP, Radvanyi F. Frequent activating mutations of FGFR3 in human bladder and cervix carcinomas. Nature genetics. 1999; 23: 18-20.
184. VI JGT, Cheuk AT, Tsang PS, Chung JY, Song YK, Desai K, Yu Y, Chen QR, Shah K, Youngblood V. Identification of FGFR4-activating mutations in human rhabdomyosarcomas that promote metastasis in xenotransplanted models. The Journal of clinical investigation. 2009; 119: 3395-407.
185. Chang H, Stewart AK, Qi XY, Li ZH, Yi QL, Trudel S. Immunohistochemistry accurately predicts FGFR3 aberrant expression and t (4; 14) in multiple myeloma. Blood. 2005; 106: 353-5.
186. Chesi M, Nardini E, Brents LA, Schröck E, Ried T, Kuehl WM, Bergsagel PL. Frequent translocation t (4; 14)(p16. 3; q32. 3) in multiple myeloma is associated with increased expression and activating mutations of fibroblast growth factor receptor 3. Nature genetics. 1997; 16: 260.
187. Keats JJ, Reiman T, Belch AR, Pilarski LM. Ten years and counting: so what do we know about t (4; 14)(p16; q32) multiple myeloma. Leukemia & lymphoma. 2006; 47: 2289-300.
188. Dienstmann R, Rodon J, Prat A, Perez Garcia J, Adamo B, Felip E, Cortes J, Iafrate A, Nuciforo P, Tabernero J. Genomic aberrations in the FGFR pathway: opportunities for targeted therapies in solid tumors. Annals of oncology. 2013: mdt419.
189. Schildhaus HU, Heukamp LC, Merkelbach Bruse S, Riesner K, Schmitz K, Binot E, Paggen E, Albus K, Schulte W, Ko YD, Schlesinger A, Ansen S, Engel-Riedel W, et al. Definition of a fluorescence in-situ hybridization score identifies high- and low-level FGFR1 amplification types in squamous cell lung cancer. Mod Pathol. 2012; 25: 1473-80. doi: 10.1038/modpathol.2012.102.
190. Weiss J, Sos ML, Seidel D, Peifer M, Zander T, Heuckmann JM, Ullrich RT, Menon R, Maier S, Soltermann A, Moch H, Wagener P, Fischer F, et al. Frequent and focal FGFR1 amplification associates with therapeutically tractable FGFR1 dependency in squamous cell lung cancer. Sci Transl Med. 2010; 2: 62ra93. doi: 10.1126/scitranslmed.3001451.
191. Kim HR, Kim DJ, Kang DR, Lee JG, Lim SM, Lee CY, Rha SY, Bae MK, Lee YJ, Kim SH, Ha SJ, Soo RA, Chung KY, et al. Fibroblast growth factor receptor 1 gene amplification is associated with poor survival and cigarette smoking dosage in patients with resected squamous cell lung cancer. J Clin Oncol. 2013; 31: 731-7. doi: 10.1200/jco.2012.43.8622.
192. Heist RS, Mino Kenudson M, Sequist LV, Tammireddy S, Morrissey L, Christiani DC, Engelman JA, Iafrate AJ. FGFR1 amplification in squamous cell carcinoma of the lung. J Thorac Oncol. 2012; 7: 1775-80. doi: 10.1097/JTO.0b013e31826aed28.
193. Andre F, Bachelot T, Campone M, Dalenc F, Perez-Garcia J, Hurvitz S, Turner N, Rugo H, Shi M, Zhang Y. (2011). A multicenter, open-label phase II trial of dovitinib, an FGFR1 inhibitor, in FGFR1 amplified and non-amplified metastatic breast cancer. ASCO Annual Meeting Proceedings, pp. 508.
194. Dienstmann R, Andre F, Soria J, Tabernero J, De Braud F, Cereda R, Bahleda R, Hollebecque A, Delmonte A, Camboni M. Significant antitumor activity of E-3810, a novel FGFR and VEGFR inhibitor, in patients with FGFR1 amplified breast cancer. Ann Oncol. 2012; 23.
195. Turner N, Pearson A, Sharpe R, Lambros M, Geyer F, Lopez Garcia MA, Natrajan R, Marchio C, Iorns E, Mackay A, Gillett C, Grigoriadis A, Tutt A, et al. FGFR1 amplification drives endocrine therapy resistance and is a therapeutic target in breast cancer. Cancer Res. 2010; 70: 2085-94. doi: 10.1158/0008-5472.can-09-3746.
196. Matsumoto K, Arao T, Hamaguchi T, Shimada Y, Kato K, Oda I, Taniguchi H, Koizumi F, Yanagihara K, Sasaki H, Nishio K, Yamada Y. FGFR2 gene amplification and clinicopathological features in gastric cancer. Br J Cancer. 2012; 106: 727-32. doi: 10.1038/bjc.2011.603.
197. Elbauomy Elsheikh S, Green AR, Lambros MB, Turner NC, Grainge MJ, Powe D, Ellis IO, Reis Filho JS. FGFR1 amplification in breast carcinomas: a chromogenic in situ hybridisation analysis. Breast Cancer Res. 2007; 9: R23. doi: 10.1186/bcr1665.
198. Freeman GJ, Long AJ, Iwai Y, Bourque K, Chernova T, Nishimura H, Fitz LJ, Malenkovich N, Okazaki T, Byrne MC, Horton HF, Fouser L, Carter L, et al. Engagement of the Pd-1 Immunoinhibitory Receptor by a Novel B7 Family Member Leads to Negative Regulation of Lymphocyte Activation. The Journal of Experimental Medicine. 2000; 192: 1027-34.
199. Riley JL. PD-1 signaling in primary T cells. Immunological reviews. 2009; 229: 114-25. doi: 10.1111/j.1600-065X.2009.00767.x.
200. Barber DL, Wherry EJ, Masopust D, Zhu B, Allison JP, Sharpe AH, Freeman GJ, Ahmed R. Restoring function in exhausted CD8 T cells during chronic viral infection. Nature. 2006; 439: 682-7. doi: 10.1038/nature04444.
201. Day CL, Kaufmann DE, Kiepiela P, Brown JA, Moodley ES, Reddy S, Mackey EW, Miller JD, Leslie AJ, DePierres C, Mncube Z, Duraiswamy J, Zhu B, et al. PD-1 expression on HIV-specific T cells is associated with T-cell exhaustion and disease progression. Nature. 2006; 443: 350-4. doi: 10.1038/nature05115.
202. Trautmann L, Janbazian L, Chomont N, Said EA, Gimmig S, Bessette B, Boulassel MR, Delwart E, Sepulveda H, Balderas RS, Routy JP, Haddad EK, Sekaly RP. Upregulation of PD-1 expression on HIV-specific CD8+ T cells leads to reversible immune dysfunction. Nat Med. 2006; 12: 1198-202. doi: 10.1038/nm1482.
203. Petrovas C, Casazza JP, Brenchley JM, Price DA, Gostick E, Adams WC, Precopio ML, Schacker T, Roederer M, Douek DC, Koup RA. PD-1 is a regulator of virus-specific CD8(+) T cell survival in HIV infection. The Journal of Experimental Medicine. 2006; 203: 2281-92. doi: 10.1084/jem.20061496.
204. Rizvi NA, Chow LQM, Borghaei H, Shen Y, Harbison C, Alaparthy S, Chen AC, Gettinger SN. (2014). Safety and response with nivolumab (anti-PD-1; BMS-936558, ONO-4538) plus erlotinib in patients (pts) with epidermal growth factor receptor mutant (EGFR MT) advanced NSCLC. ASCO Annual Meeting Proceedings, pp. 8022.
205. Postow MA, Chesney J, Pavlick AC, Robert C, Grossmann K, McDermott D, Linette GP, Meyer N, Giguere JK, Agarwala SS, Shaheen M, Ernstoff MS, Minor D, et al. Nivolumab and Ipilimumab versus Ipilimumab in Untreated Melanoma. New England Journal of Medicine. 2015; 372: 2006-17. doi:10.1056/NEJMoa1414428.
206. Robert C, Schachter J, Long GV, Arance A, Grob JJ, Mortier L, Daud A, Carlino MS, McNeil C, Lotem M, Larkin J, Lorigan P, Neyns B, et al. Pembrolizumab versus Ipilimumab in Advanced Melanoma. New England Journal of Medicine. 2015; 372: 2521-32. doi:10.1056/NEJMoa1503093.
207. Motzer RJ, Rini BI, McDermott DF, Redman BG, Kuzel TM, Harrison MR, Vaishampayan UN, Drabkin HA, George S, Logan TF. Nivolumab for metastatic renal cell carcinoma: results of a randomized phase II trial. Journal of Clinical Oncology. 2015; 33: 1430-7.
208. Borghaei H, Paz Ares L, Horn L, Spigel DR, Steins M, Ready NE, Chow LQ, Vokes EE, Felip E, Holgado E. Nivolumab versus docetaxel in advanced nonsquamous non–small-cell lung cancer. New England Journal of Medicine. 2015; 373: 1627-39.
209. Brahmer J, Reckamp KL, Baas P, Crinò L, Eberhardt WE, Poddubskaya E, Antonia S, Pluzanski A, Vokes EE, Holgado E. Nivolumab versus docetaxel in advanced squamous-cell non–small-cell lung cancer. New England Journal of Medicine. 2015; 373: 123-35.
210. Weber JS, D'Angelo SP, Minor D, Hodi FS, Gutzmer R, Neyns B, Hoeller C, Khushalani NI, Miller WH, Lao CD. Nivolumab versus chemotherapy in patients with advanced melanoma who progressed after anti-CTLA-4 treatment (CheckMate 037): a randomised, controlled, open-label, phase 3 trial. The Lancet Oncology. 2015; 16: 375-84.
211. Seiwert TY, Burtness B, Mehra R, Weiss J, Berger R, Eder JP, Heath K, McClanahan T, Lunceford J, Gause C. Safety and clinical activity of pembrolizumab for treatment of recurrent or metastatic squamous cell carcinoma of the head and neck (KEYNOTE-012): an open-label, multicentre, phase 1b trial. The Lancet Oncology. 2016.
212. Ansell SM, Lesokhin AM, Borrello I, Halwani A, Scott EC, Gutierrez M, Schuster SJ, Millenson MM, Cattry D, Freeman GJ. PD-1 blockade with nivolumab in relapsed or refractory Hodgkin's lymphoma. New England Journal of Medicine. 2015; 372: 311-9.
213. Rosenberg JE, Hoffman Censits J, Powles T, van der Heijden MS, Balar AV, Necchi A, Dawson N, O'Donnell PH, Balmanoukian A, Loriot Y. Atezolizumab in patients with locally advanced and metastatic urothelial carcinoma who have progressed following treatment with platinum-based chemotherapy: a single-arm, multicentre, phase 2 trial. The Lancet. 2016; 387: 1909-20.
214. Patel SP, Kurzrock R. PD-L1 Expression as a Predictive Biomarker in Cancer Immunotherapy. Mol Cancer Ther. 2015; 14: 847-56. doi: 10.1158/1535-7163.MCT-14-0983.
215. Hodi FS, Sznol M, Kluger HM, McDermott DF, Carvajal RD, Lawrence DP, Topalian SL, Atkins MB, Powderly JD, Sharfman WH. (2014). Long-term survival of ipilimumab-naive patients (pts) with advanced melanoma (MEL) treated with nivolumab (anti-PD-1, BMS-936558, ONO-4538) in a phase I trial. ASCO Annual Meeting Proceedings, pp. 9002.
216. Postow MA, Cardona DM, Taube JM, Anders RA, Taylor CR, Wolchok JD, Callahan MK, Curran MA, Lesokhin AM, Grosso JF. Peripheral and tumor immune correlates in patients with advanced melanoma treated with nivolumab (anti-PD-1, BMS-936558, ONO-4538) monotherapy or in combination with ipilimumab. Journal of Translational Medicine. 2014; 12: O8.
217. Wolchok JD, Kluger H, Callahan MK, Postow MA, Rizvi NA, Lesokhin AM, Segal NH, Ariyan CE, Gordon RA, Reed K. Nivolumab plus ipilimumab in advanced melanoma. New England Journal of Medicine. 2013; 369: 122-33.
218. Gettinger SN, Shepherd FA, Antonia SJ, Brahmer JR, Chow LQM, Juergens RA, Borghaei H, Shen Y, Harbison C, Alaparthy S. (2014). First-line nivolumab (anti-PD-1; BMS-936558, ONO-4538) monotherapy in advanced NSCLC: Safety, efficacy, and correlation of outcomes with PD-L1 status. ASCO Annual Meeting Proceedings, pp. 8024.
219. Kefford R, Ribas A, Hamid O, Robert C, Daud A, Wolchok JD, Joshua AM, Hodi FS, Gangadhar TC, Hersey P. (2014). Clinical efficacy and correlation with tumor PD-L1 expression in patients (pts) with melanoma (MEL) treated with the anti-PD-1 monoclonal antibody MK-3475. ASCO Annual Meeting Proceedings, pp. 3005.
220. Gandhi L, Balmanoukian A, Hui R, Hamid O, Rizvi NA, Leighl N, Gubens M, Goldman JW, Lubiniecki GM, Emancipator K. Abstract CT105: MK-3475 (anti-PD-1 monoclonal antibody) for non-small cell lung cancer (NSCLC): Antitumor activity and association with tumor PD-L1 expression. Cancer Research. 2014; 74: CT105-CT.
221. Taube JM, Anders RA, Young GD, Xu H, Sharma R, McMiller TL, Chen S, Klein AP, Pardoll DM, Topalian SL. Colocalization of inflammatory response with B7-h1 expression in human melanocytic lesions supports an adaptive resistance mechanism of immune escape. Science translational medicine. 2012; 4: 127ra37-ra37.
222. Grosso J, Horak CE, Inzunza D, Cardona DM, Simon JS, Gupta AK, Sankar V, Park JS, Kollia G, Taube JM. (2013). Association of tumor PD-L1 expression and immune biomarkers with clinical activity in patients (pts) with advanced solid tumors treated with nivolumab (anti-PD-1; BMS-936558; ONO-4538). ASCO Annual Meeting Proceedings, pp. 3016.
223. Thompson RH, Gillett MD, Cheville JC, Lohse CM, Dong H, Webster WS, Chen L, Zincke H, Blute ML, Leibovich BC. Costimulatory molecule B7‐H1 in primary and metastatic clear cell renal cell carcinoma. Cancer. 2005; 104: 2084-91.
224. Fay AP, Callea M, Gray KP, Ho TH, Song J, Carvo I, Lampron ME, Albiges L, Stanton ML, McDermott DF. (2014). PD-L1 expression in non-clear cell renal cell carcinoma and benign kidney tumors. ASCO Annual Meeting Proceedings, pp. 4526.
225. Konishi J, Yamazaki K, Azuma M, Kinoshita I, Dosaka Akita H, Nishimura M. B7-H1 expression on non-small cell lung cancer cells and its relationship with tumor-infiltrating lymphocytes and their PD-1 expression. Clinical Cancer Research. 2004; 10: 5094-100.
226. Dong H, Strome SE, Salomao DR, Tamura H, Hirano F, Flies DB, Roche PC, Lu J, Zhu G, Tamada K. Tumor-associated B7-H1 promotes T-cell apoptosis: a potential mechanism of immune evasion. Nature medicine. 2002; 8: 793-800.
227. D’Angelo SP, Shoushtari AN, Agaram NP, Kuk D, Qin LX, Carvajal RD, Dickson MA, Gounder M, Keohan ML, Schwartz GK. Prevalence of tumor-infiltrating lymphocytes and PD-L1 expression in the soft tissue sarcoma microenvironment. Human pathology. 2015; 46: 357-65.
228. McLaughlin J, Han G, Schalper KA, Carvajal Hausdorf D, Pelakanou V, Rehman J, Velcheti V, Herbst R, LoRusso P, Rimm DL. Quantitative Assessment of the Heterogeneity of PD-L1 Expression in Non–Small-Cell Lung Cancer. JAMA oncology. 2015: 1-9.
229. Sheng J, Fang W, Yu J, Chen N, Zhan J, Ma Y, Yang Y, Huang Y, Zhao H, Zhang L. Expression of programmed death ligand-1 on tumor cells varies pre and post chemotherapy in non-small cell lung cancer. Scientific reports. 2016; 6: 20090.
230. Champiat S, Ileana E, Giaccone G, Besse B, Mountzios G, Eggermont A, Soria JC. Incorporating immune-checkpoint inhibitors into systemic therapy of NSCLC. J Thorac Oncol. 2014; 9: 144-53. doi: 10.1097/jto.0000000000000074.
231. Phillips T, Simmons P, Inzunza HD, Cogswell J, Novotny Jr J, Taylor C, Zhang X. Development of an Automated PD-L1 Immunohistochemistry (IHC) Assay for Non–Small Cell Lung Cancer. Applied Immunohistochemistry & Molecular Morphology. 2015; 23: 541.
232. Spigel DR, Reckamp KL, Rizvi NA, Poddubskaya E, West HJ, Eberhardt WEE, Baas P, Antonia SJ, Pluzanski A, Vokes EE. (2015). A phase III study (CheckMate 017) of nivolumab (NIVO; anti-programmed death-1 [PD-1]) vs docetaxel (DOC) in previously treated advanced or metastatic squamous (SQ) cell non-small cell lung cancer (NSCLC). ASCO Annual Meeting Proceedings, pp. 8009.
233. Paz Ares L, Horn L, Borghaei H, Spigel DR, Steins M, Ready N, Chow LQM, Vokes EE, Felip E, Holgado E. (2015). Phase III, randomized trial (CheckMate 057) of nivolumab (NIVO) versus docetaxel (DOC) in advanced non-squamous cell (non-SQ) non-small cell lung cancer (NSCLC). ASCO Annual Meeting Proceedings, pp. LBA109.
234. Kristensen LS, Hansen LL. PCR-based methods for detecting single-locus DNA methylation biomarkers in cancer diagnostics, prognostics, and response to treatment. Clinical chemistry. 2009; 55: 1471-83.
235. Mikeska T, Craig JM. DNA methylation biomarkers: cancer and beyond. Genes. 2014; 5: 821-64.
236. Hegi ME, Diserens AC, Godard S, Dietrich PY, Regli L, Ostermann S, Otten P, Van Melle G, de Tribolet N, Stupp R. Clinical trial substantiates the predictive value of O-6-methylguanine-DNA methyltransferase promoter methylation in glioblastoma patients treated with temozolomide. Clin Cancer Res. 2004; 10: 1871-4.
237. Paulson KG, Iyer JG, Tegeder AR, Thibodeau R, Schelter J, Koba S, Schrama D, Simonson WT, Lemos BD, Byrd DR, Koelle DM, Galloway DA, Leonard JH, et al. Transcriptome-wide studies of merkel cell carcinoma and validation of intratumoral CD8+ lymphocyte invasion as an independent predictor of survival. J Clin Oncol. 2011; 29: 1539-46. doi: 10.1200/jco.2010.30.6308.
238. Galon J, Costes A, Sanchez Cabo F, Kirilovsky A, Mlecnik B, Lagorce Pages C, Tosolini M, Camus M, Berger A, Wind P, Zinzindohoue F, Bruneval P, Cugnenc PH, et al. Type, density, and location of immune cells within human colorectal tumors predict clinical outcome. Science. 2006; 313: 1960-4. doi: 10.1126/science.1129139.
239. Sharma P, Shen Y, Wen S, Yamada S, Jungbluth AA, Gnjatic S, Bajorin DF, Reuter VE, Herr H, Old LJ, Sato E. CD8 tumor-infiltrating lymphocytes are predictive of survival in muscle-invasive urothelial carcinoma. Proc Natl Acad Sci U S A. 2007; 104: 3967-72. doi: 10.1073/pnas.0611618104.
240. Grabenbauer GG, Lahmer G, Distel L, Niedobitek G. Tumor-infiltrating cytotoxic T cells but not regulatory T cells predict outcome in anal squamous cell carcinoma. Clin Cancer Res. 2006; 12: 3355-60. doi: 10.1158/1078-0432.ccr-05-2434.
241. Kawai O, Ishii G, Kubota K, Murata Y, Naito Y, Mizuno T, Aokage K, Saijo N, Nishiwaki Y, Gemma A, Kudoh S, Ochiai A. Predominant infiltration of macrophages and CD8(+) T Cells in cancer nests is a significant predictor of survival in stage IV nonsmall cell lung cancer. Cancer. 2008; 113: 1387-95. doi: 10.1002/cncr.23712.
242. Denkert C, Loibl S, Noske A, Roller M, Muller BM, Komor M, Budczies J, Darb Esfahani S, Kronenwett R, Hanusch C, von Torne C, Weichert W, Engels K, et al. Tumor-associated lymphocytes as an independent predictor of response to neoadjuvant chemotherapy in breast cancer. J Clin Oncol. 2010; 28: 105-13. doi: 10.1200/jco.2009.23.7370.
243. Halama N, Michel S, Kloor M, Zoernig I, Benner A, Spille A, Pommerencke T, von Knebel DM, Folprecht G, Luber B. Localization and density of immune cells in the invasive margin of human colorectal cancer liver metastases are prognostic for response to chemotherapy. Cancer research. 2011; 71: 5670-7.
244. Kroese M, Zimmern RL, Pinder SE. HER2 status in breast cancer–an example of pharmacogenetic testing. Journal of the Royal Society of Medicine. 2007; 100: 326-9.
245. Teixido C, Karachaliou N, Peg V, Gimenez Capitan A, Rosell R. Concordance of IHC, FISH and RT-PCR for EML4-ALK rearrangements. Transl Lung Cancer Res. 2014; 3: 70-4. doi: 10.3978/j.issn.2218-6751.2014.02.02.
246. Teixidó C, Karachaliou N, González Cao M, Morales Espinosa D, Rosell R. Assays for predicting and monitoring responses to lung cancer immunotherapy. Cancer biology & medicine. 2015; 12: 87-95.