
INTRODUCTION
Acute myeloid leukemia (AML) is an aggressive hematopoietic malignancy associated with severe morbidity and poor clinical outcome [1, 2]. Cytogenetic abnormalities of AML assessed at diagnosis are generally recognized as the most valuable independent prognostic factors in AML, allowing the classification of AML into favorable, intermediate, and poor prognostic groups [2, 3]. However, in approximately 50% of AML patients, no cytogenetic abnormality is detectable at the diagnosis time, often called as cytogenetically normal AML (CN-AML) [1, 2]. Such patients are in an intermediate-risk prognostic category, but among them are subgroups of patients who have molecular markers associated with either a favorable prognosis or an unfavorable prognosis [2–4]. Over the past decades, several gene mutations, such as CEBPA, NPM1, FLT3-ITD, C-KIT, DNMT3A, and IDH1/2, and changes in gene expression, such as overexpression of BAALC, ERG, EVI1, and MN1, have been discovered to strongly affect clinical outcome of CN-AML patients [4]. Accordingly, further refinement of relevant molecular alterations in different AML subgroups might eventually result in more individual treatment approaches and potentially improve outcome.
RAS proto-oncogenes, including KRAS, NRAS, and HRAS, encode a membrane-localized G protein of 21 kDa regulate the growth and differentiation of many cell types [5–7]. RAS proteins are located on the inner surface of the plasma membrane and act as molecular switches that transduce extracellular signals to the nucleus [5–7]. It is inactive when bound to GDP and active when bound to GTP [5–7]. RAS activation caused by its mutation giving rise to an abnormal protein resistant to GTP hydrolysis by GTPase leads to a constitutively active GTP-bound protein that stimulates a critical network of signal transduction pathways that result in cellular proliferation, survival, and differentiation [5–7]. RAS mutations at codons 12, 13, and 61 are common events in human cancers, and are frequently detected in AML with their clinical relevance been systematically determined [5–7]. Herein, we investigated RAS expressions and their clinical significances in de novo AML patients.
RESULTS
RAS expressions and mutations in AML
We first examined KRAS and NRAS expressions in controls and newly diagnosed AML patients. KRAS expression in AML patients (median 1.024) was significantly up-regulated than controls (median 0.319) (P=0.008, Figure 1A). By the cut-off value (defined as mean+2SD in controls), KRAS overexpression was identified in 35/143 (24%) of AML patients. Moreover, increased NRAS expression was also found in AML patients compared with controls (median 4.896 vs 2.838) (P=0.044, Figure 1B), and identified in 37/143 (26%) of AML patients based on the cut-off value (defined as mean+2SD in controls). Moreover, KRAS expression was positively correlated with NRAS expression in AML patients (R=0.605, P<0.001).
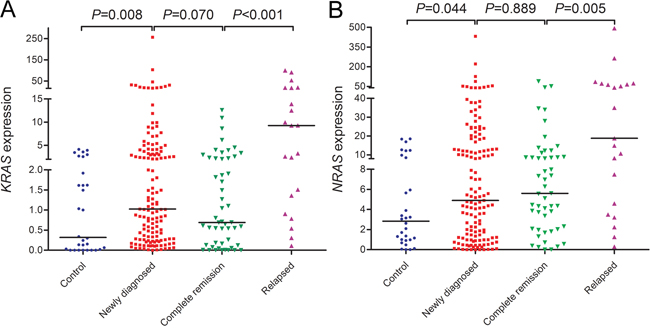
Figure 1: RAS expressions in controls and AML patients including newly diagnosed AML, AML at complete remission time, and relapsed AML. (A) KRAS expression. (B) NRAS expression.
KRAS and NRAS mutations were scanned in all patients. KRAS mutation was found in 4% (6/143) patients, whereas 8% (12/143) patients harbored NRAS mutation. Notably, no significant differences was observed regarding KRAS (median 2.759 vs 1.017, P=0.330) and NRAS (median 16.148 vs 4.738, P=0.355) expression in patients with and without KRAS mutation. In addition, patients with and without NRAS mutation also showed similar level of KRAS (median 1.274 vs 1.017, P=0.350) and NRAS (median 5.055 vs 4.896, P=0.884) expression. All these results suggested that RAS expressions were not correlated with RAS mutations in AML.
Clinical and laboratory characteristics of AML
Previous study has revealed the clinical significance of RAS mutations in de novo AML patients [8]. Herein, we further investigated the correlation of RAS expressions with clinico-pathologic features. As is shown in Table 1, KRAS high-expressed (KRAShigh) patients were associated with older age (P=0.034), higher white blood cells (P=0.007), and a tendency of higher platelets (P=0.057), whereas NRAS high-expressed (NRAShigh) patients were only correlated with older age (P=0.009). Additionally, only KRAS but not NRAS expression showed significant differences in the distribution of karyotypes, and KRAS overexpression showed lower frequency in t(15;17) subtypes (P=0.048). Among gene mutations, KRAS overexpression was correlated with U2AF1 mutation (P=0.033), whereas NRAS overexpression might be associated with IDH1/2 mutations (P=0.059).
Table 1: Correlation analyses of KRAS and NRAS expressions with clinic-pathologic features in AML patients
Patient’s parameters |
KRAS expression |
NRAS expression |
||||
|---|---|---|---|---|---|---|
Low |
High |
P |
Low |
High |
P |
|
Sex, male/female |
62/46 |
25/10 |
0.166 |
64/42 |
23/14 |
1.000 |
Age, median (range) |
54 (15-87) |
60 (10-93) |
0.034 |
54 (10-93) |
63 (17-87) |
0.009 |
WBC, median (range) |
13.2 (0.3-528.0) |
34.5 (0.8-197.7) |
0.007 |
16.6 (0.3-528.0) |
23.0 (1.2-135.4) |
0.543 |
HB, median (range) |
75 (34-144) |
82 (34-135) |
0.844 |
77 (34-138) |
76 (34-144) |
0.863 |
PLT, median (range) |
32 (3-415) |
43 (9-399) |
0.057 |
32 (3-415) |
46 (9-399) |
0.181 |
BM blasts, median (range) |
47.0 (1.0*-97.5) |
38.8 (21.5-92.0) |
0.983 |
44.8 (1.0*-97.5) |
48.5 (6.5*-92.0) |
0.855 |
Karyotypic classifications |
0.230 |
0.399 |
||||
Favorable |
34 (31.5%) |
6 (17.1%) |
31 (29.2%) |
8 (21.6%) |
||
Intermediate |
60 (55.6%) |
23 (65.7%) |
62 (58.5%) |
21 (56.8%) |
||
Poor |
12 (11.1%) |
4 (11.4%) |
11 (10.4%) |
6 (16.2%) |
||
No data |
2 (1.9%) |
2 (5.7%) |
2 (1.9%) |
2 (5.4%) |
||
Karyotypes |
0.048 |
0.250 |
||||
Normal |
46 (42.6%) |
16 (45.7%) |
46 (43.4%) |
16 (43.2%) |
||
t(8;21) |
10 (9.3%) |
3 (8.6%) |
8 (7.5%) |
5 (13.5%) |
||
inv(16) |
0 (0%) |
1 (2.9%) |
1 (0.9%) |
0 (0%) |
||
t(15;17) |
24 (22.2%) |
1 (2.9%) |
22 (20.8%) |
3 (8.1%) |
||
+8 |
3 (2.8%) |
2 (5.7%) |
5 (4.7%) |
0 (0%) |
||
t(9;22) |
0 (0%) |
1 (2.9%) |
0 (0%) |
1 (2.7%) |
||
-5/5q- |
2 (1.9%) |
0 (0%) |
1 (0.9%) |
1 (2.7%) |
||
-7/7q- |
1 (0.9%) |
0 (0%) |
1 (0.9%) |
0 (0%) |
||
Complex |
10 (9.3%) |
4 (11.4%) |
9 (8.5%) |
5 (13.5%) |
||
Others |
10 (9.3%) |
5 (14.3%) |
11 (10.4%) |
4 (10.8%) |
||
No data |
2 (1.9%) |
2 (5.7%) |
2 (1.9%) |
2 (5.4%) |
||
Gene mutations |
||||||
KRAS (+/-) |
5/103 |
1/34 |
1.000 |
3/103 |
3/34 |
0.339 |
NRAS (+/-) |
7/101 |
5/30 |
0.167 |
9/97 |
3/34 |
1.000 |
Double CEBPA (+/-) |
4/88 |
0/26 |
0.575 |
4/85 |
0/29 |
0.571 |
NPM1 (+/-) |
8/84 |
3/23 |
0.705 |
7/82 |
4/25 |
0.461 |
FLT3-ITD (+/-) |
12/80 |
2/24 |
0.526 |
11/78 |
3/26 |
1.000 |
C-KIT (+/-) |
5/87 |
1/25 |
1.000 |
4/85 |
2/27 |
0.635 |
IDH1 (+/-) |
1/91 |
1/25 |
0.394 |
0/89 |
2/27 |
0.059 |
IDH2 (+/-) |
1/91 |
1/25 |
0.394 |
0/89 |
2/27 |
0.059 |
DNMT3A (+/-) |
5/87 |
3/23 |
0.372 |
7/82 |
1/28 |
0.677 |
U2AF1 (+/-) |
1/91 |
3/23 |
0.033 |
3/86 |
1/28 |
1.000 |
SRSF2 (+/-) |
2/90 |
1/25 |
0.530 |
2/87 |
1/28 |
1.000 |
CR (+/-) |
51/49 (51.0%) |
11/24 (31.4%) |
0.051 |
48/50 (49.0%) |
14/23 (37.8%) |
0.333 |
AML, acute myeloid leukemia; WBC, white blood cells; HB, hemoglobin; PLT, platelets; BM, bone marrow; CR, complete remission. *, AML patients less than 20% BM blasts often with typical cytogenetics such as t(15;17).
Prognostic value of RAS expressions and mutations in AML
Follow-up data was available in 135 AML patients after receiving induction chemotherapy (median: 10 months, 95% CI: 6.374-123.626). In whole-cohort AML, KRAShigh patients showed had an obvious tendency of lower complete remission (CR) rate, whereas NRAS did not (Table 1). Both KRAS and NRAS expressions were not correlated with CR rate among non-acute promyelocytic leukemia (APL) patients [43% (34/79, KASlow) vs 29% (10/34, KRASlow), P=0.210 and 41% (32/79, NRASlow) vs 35% (12/34, NRAShigh), P=0.677]. Among CN-AML, KRAShigh and NRAShigh patients also presented an obvious tendency of lower CR rate [47% (20/43, KRASlow) vs 25% (4/16, KRAShigh), P=0.078 and 47% (20/43, NRASlow) vs 25% (4/16, NRAShigh), P=0.078].
Survival analyses were further performed in 135 AML patients. Kaplan-Meier analyses demonstrated that KRAShigh was associated with shorter overall survival (OS) time among whole-cohort AML, non-APL AML, and CN-AML patients (Figure 2A, 2B and 2C). However, NRAShigh was not correlated with OS time in whole-cohort AML and non-APL AML (Figure 2D and 2E), but had an obvious tendency of shorter OS time in CN-AML (Figure 2F). Next, we classified patients into three groups (both low vs either high vs both high) regarding RAS expressions, and showed in Figure 2G, 2H and 2I (whole-cohort AML, non-APL AML, and CN-AML). Cox regression analyses were further performed to determine the prognostic impact of RAS expressions in AML, and showed that KRAS was an independent prognostic biomarker in CN-AML (Table 2) but not in whole-cohort AML and non-APL AML patients (data not shown).
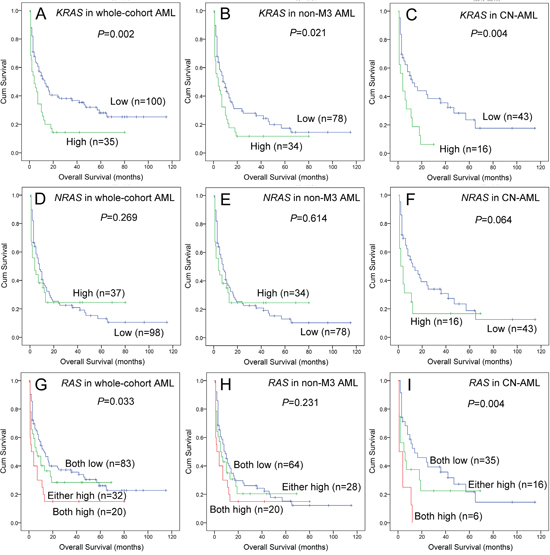
Figure 2: The impact of RAS expressions on overall survival in AML patients. (A, B and C) For KRAS expression in whole-cohort AML, non-APL AML, and CN-AML patients. (D, E and F) For NRAS expression in whole-cohort AML, non-APL AML, and CN-AML patients. (G, H and I) For RAS expression in whole-cohort AML, non-APL AML, and CN-AML patients, “both low” indicated neither KRAS nor NRAS overexpression, “either high” indicated either KRAS or NRAS overexpression, “both high” indicated both KRAS and NRAS overexpression.
Table 2: Univariate and multivariate analyses of prognostic factors for overall survival in cytogenetically normal AML patients
Univariate analysis |
Multivariate analysis |
|||
|---|---|---|---|---|
Hazard ratio (95% CI) |
P value |
Hazard ratio (95% CI) |
P value |
|
KRAS expression |
2.443 (1.277-4.675) |
0.007 |
2.464 (1.113-5.453) |
0.026 |
NRAS expression |
1.798 (0.937-3.452) |
0.078 |
1.805 (0.467-2.522) |
0.849 |
Age |
2.125 (1.166-3.874) |
0.014 |
1.812 (0.895-3.670) |
0.099 |
WBC |
2.618 (1.431-4.788) |
0.002 |
1.985 (1.001-3.938) |
0.050 |
CEBPA* mutations |
1.013 (0.241-4.262) |
0.986 |
||
NPM1 mutations |
0.679 (0.240-1.927) |
0.467 |
||
FLT3-ITD mutations |
0.607 (0.211-1.742) |
0.353 |
||
C-KIT mutations |
0.734 (0.100-5.402) |
0.761 |
||
KRAS mutations |
5.323 (1.534-18.476) |
0.008 |
8.702 (1.794-42.209) |
0.007 |
NRAS mutations |
1.609 (0.673-3.850) |
0.285 |
||
IDH1 mutations |
8.565 (1.759-41.710) |
0.008 |
6.609 (1.279-34.135) |
0.024 |
IDH2 mutations |
5.707 (0.714-45.644) |
0.101 |
||
DNMT3A mutations |
1.412 (0.545-3.656) |
0.477 |
||
U2AF1 mutations |
2.179 (0.290-16.342) |
0.449 |
||
SRSF2 mutations |
2.915 (0.669-12.705) |
0.154 |
||
WBC, white blood cells. Variables including age (≤60 vs. >60 years), WBC (≥30×109 vs. <30×109 /L), RAS expression (lower vs. higher), and gene mutations (mutant vs. wild-type). Multivariate analysis includes variables with P<0.100 in univariate analysis. *, double CEBPA mutations.
The published data from two independent cohorts of CN-AML patients available in Gene Expression Omnibus (GEO) databases were set as the independent validation cohort. Through the online tools GenomicScape, KRAS overexpression was significantly related to shorter OS time (Figure 3A and 3B), whereas NRAS was not found (Figure 3C and 3D).
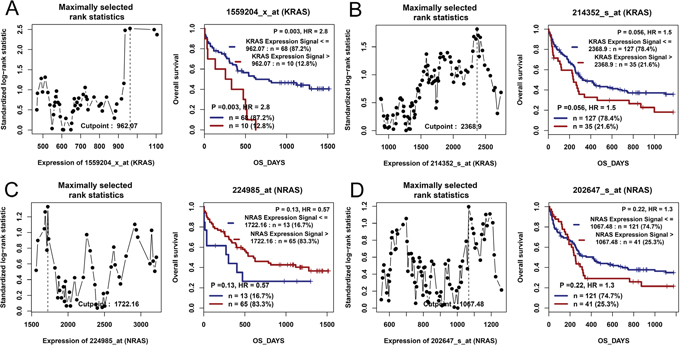
Figure 3: The impact of RAS expressions on overall survival in CN-AML patients by bioinformatics analysis. Two independent cohorts of 78 and 162 CN-AML patients were obtained from Gene Expression Omnibus data (http://www.ncbi.nlm.nih.gov/geo/; accession number GSE12417). Survival analysis was performed through the online web tool Genomicscape (http://genomicscape.com/microarray/survival.php). (A) For KRAS in a cohort of 78 CN-AML patients. (B) For KRAS in a cohort of 162 CN-AML patients. (C) For NRAS in a cohort of 78 CN-AML patients. (D) For NRAS in a cohort of 162 CN-AML patients.
Lastly, we further analyzed the impact of RAS abnormalities (overexpression and mutation) on prognosis. We divided patients into groups regarding RAS expressions and mutations including KRAS normal (without mutation and overexpression) vs KRAS abnormal (with mutation or overexpression), NRAS normal vs NRAS abnormal, and RAS normal vs RAS abnormal. All the results were presented in Figure 4.
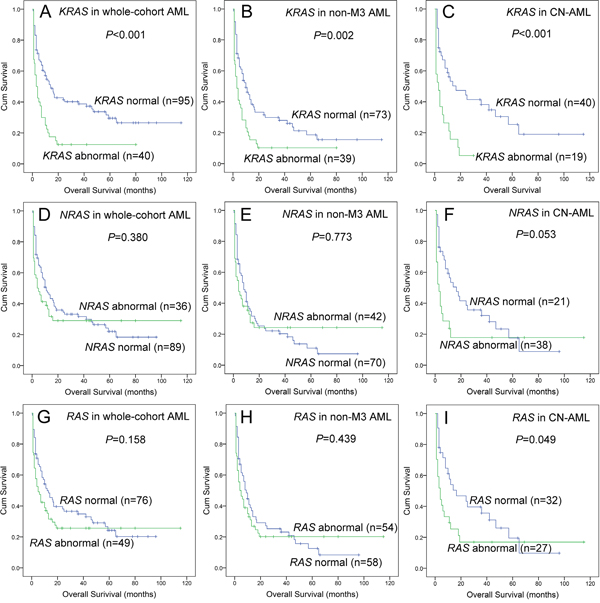
Figure 4: The impact of RAS abnormalities on overall survival in AML patients. (A, B and C) For KRAS abnormalities in whole-cohort AML, non-APL AML, and CN-AML patients. (D, E and F) For NRAS abnormalities in whole-cohort AML, non-APL AML, and CN-AML patients. (G, H and I) For RAS abnormalities in whole-cohort AML, non-APL AML, and CN-AML patients. “Abnormal” indicated gene with overexpression or mutation, whereas “normal” indicated gene without overexpression and mutation.
RAS expressions in the surveillance of AML
To observe the dynamic change of RAS expressions in AML patients of different clinical stages, we further detected RAS expressions in 51 patients who achieved CR after induction therapy and 21 relapsed patients. As was shown in Figure 1A and 1B, KRAS expression rather than NRAS expression in CR time tended to decrease compared to newly diagnosis time, and both KRAS and NRAS expressions were significantly increased when in relapse time.
DISCUSSION
The signal switch molecules RAS proteins play crucial roles in relaying growth-promoting signals from cell surface receptors [5–7]. Oncogenic point mutations of RAS are identified in -30% of human cancers especially in pancreatic cancer, lung cancer, and colon cancer [5–7]. Significantly, RAS mutations, usually in KRAS and NRAS, are also frequent events in myeloid malignancies, and have been detected in 3% to 40% of myelodysplastic syndrome (MDS) and AML [5–7]. In this study, KRAS and NRAS mutations were identified in 4% and 8% AML patients, which showed lower percentage compared to previous study. Possible reasons were that we only detected hot-spot mutations in RAS, or the differences in ethnics. Moreover, the prognostic value of RAS mutations in AML remains controversial. Several investigators reported RAS mutations emerged as significant predictors for improved clinical outcome [9]. Meanwhile, NRAS mutation was associated with adverse prognosis and increased risk of leukemia transformation in MDS [10]. Conversely, the opponents hold the view that RAS mutations were associated with distinct cytogenetic subgroups, usually M4, but not correlated with prognosis in AML patients [11, 12]. Our previous study also analyzed the clinical significance of RAS mutations in de novo AML, but did not have an independent effect on prognosis [8]. In addition, we also did not observe the impact of FLT3, NPM1 and CEBPA mutations on prognosis, which might be due to the small size of patients with mutations in our cohort.
In the present study, we mainly focused on RAS expressions in AML, and found that both KRAS and NRAS overexpression were common events more frequently than RAS mutations in de novo AML patients. Notably, our study did not find significant association of RAS overexpression with RAS mutations. Similarly, a recent report also showed KRAS mutation did not correlate with mRNA expression [13]. These results suggested that RAS overexpression and mutations were independent events contributing to the pathogenesis of AML. Moreover, RAS overexpression rather than RAS mutations might play more critical roles in leukemogenesis. The underlying mechanism during leukemogenesis caused by RAS overexpression needed further studies. Interestingly, we observed that KRAS overexpression was associated with U2AF1 mutations, whereas NRAS overexpression was associated with IDH1/2 mutations. As is well known, RNA splicing factor gene U2AF1 and isocitrate dehydrogenase gene IDH1/2 mutations are recurrent in de novo AML especially in CN-AML, and have a prognostic impact on assessing treatment outcome [14, 15]. However, it was the first time to report the association of RAS overexpression with these gene mutations. No functional studies were found to verify our results. In addition, due to the limited cases of RAS mutations in our cohort, perspective studies in a larger cohort of AML patients are required to confirm these findings, and further reveal the underlying molecular mechanism.
Importantly, our study revealed the impact of RAS expressions on clinical outcome of AML. Firstly, a negative effect of KRAS overexpression was observed among whole-cohort AML and CN-AML patients. The results indicated that KRAS activation may be associated with chemoresistance in the induction therapy of AML. Although there were no functional studies to validate the hypothesis in AML, several investigations revealed the oncogenic role of KRAS abnormalities (overexpression or mutation) were associated with resistant to anticancer drug treatments phenomenally and/or mechanically [16–18]. Secondly, both our data and the published GEO databases showed that KRAS overexpression was a prognostically adverse predictor in CN-AML patients. More importantly, KRAS expression may increase the power in predicting prognosis when combined with other molecular alterations such as NRAS expression or NRAS/KRAS mutations. The prognostic value of KRAS expression has been determined in various cancers. For instance, Chen et al disclosed that KRAS overexpression predicted poor prognosis in patients with colorectal cancer [19]. Moreover, RAS expressions as an independent indicator of patient outcomes in lung cancer treated with bevacizumab plus chemotherapy [20]. Thirdly, we further found RAS expressions could be used as a biomarker for monitoring disease treatment and recurrence in AML. Collectively, these above results emphasized a more crucial role of KRAS from RAS family in the process of leukemogenesis, and could act as a potential therapeutic target for designing cancer gene therapy.
Taken together, our findings reveal that RAS overexpression and mutations are common events in AML with potential therapeutic target value. KRAS overexpression independent of RAS mutations confers an adverse prognosis in CN-AML.
MATERIALS AND METHODS
Patients and samples
This study was approved by the Institutional Review Board of the Affiliated People’s Hospital of Jiangsu University. After written informed consents were obtained from all participants, bone marrow (BM) was collected from 143 de novo AML patients at newly diagnosis time, 51 AML patients at CR time, and 21 AML patients at relapse time. The diagnosis and classification of AML patients were established according to the 2008 World Health Organization (WHO) criteria. BM samples from 30 healthy donors were collected as controls. The separation of BM mononuclear cells (BMMNCs) was performed using Lymphocyte Separation Medium (TBD Sciences, Tianjin, China) and washed twice with PBS.
Treatment regimen
All the AML patients received chemotherapy including induction therapy and subsequent consolidation treatment as reported in our previous literature [21, 22]. For patients with APL, induction therapy was oral all-trans retinoic acid (ATRA) together with daunorubicin in combination with cytarabine, and maintenance therapy was oral mercaptopurine, oral methotrexate, and oral ATRA over two years. For non-APL patients, induction therapy was one or two courses of daunorubicin combined with cytarabine, whereas subsequent consolidation treatment included high-dose cytarabine, mitoxantrone combined with cytarabine, homoharringtonine together with cytarabine, and etoposide in combination with cytarabine.
Cytogenetic analyses
Karyotypes were analyzed at the newly diagnosis time by conventional R-banding method and karyotype risk was classified according to reported previously [23].
RNA isolation and reverse transcription
Total RNA was extracted from the BMMNCs using Trizol reagent (Invitrogen, Carlsbad, CA, USA). The synthesis of cDNA was performed by reverse transcription as reported [24].
Real-time quantitative PCR
KRAS and NRAS expressions were detected by real-time quantitative PCR (RQ-PCR) using AceQ qPCR SYBR Green Master Mix (Vazyme Biotech Co., Piscataway, NJ, USA). The primers of KRAS and NRAS expressions were used as reported [25, 26]. PCR conditions were conducted at 95 °C for 5 min, followed by 40 cycles at 95 °C for 10 s, 60 °C for 30 s, 72 °C for 32 s, and 75 °C for 32 s. Housekeeping gene ABL was used to calculate the abundance of KRAS and NRAS mRNA. The detection of ABL expression was performed with primers as reported [27]. Both positive [K562 cell lines samples, cultured in RPMI 1640 medium containing 10% fetal calf serum (ExCell Bio, Shanghai, China)] and negative controls (ddH2O) were included in each assay. Relative KRAS and NRAS expressions levels were calculated using 2-ΔΔCT method.
DNA extraction and gene mutation detection
Genomic DNA was isolated from BMMNCs using genomic DNA purification kit (Gentra, Minneapolis, MN, USA). The hot-spot mutations (codons 12, 13 and 61) of KRAS and NRAS were screened using high-resolution melting analysis (HRMA) as reported [8]. All positive samples were confirmed by DNA sequencing. The other gene mutations including NPM1, C-KIT, DNMT3A, IDH1, IDH2, and U2AF1 were also detected by HRMA [28–33], whereas FLT3-ITD and CEBPA mutations were examined by DNA sequencing (BGI Tech Solutions Co., Shanghai, China) [34, 35].
Gene Expression Omnibus datasets
Two independent cohorts of CN-AML patients (78 and 162 patients) from GEO data (http://www.ncbi.nlm.nih.gov/geo/; accession number GSE12417) were applied to analyze the prognostic impact of KRAS and NRAS expressions using the online web tool Genomicscape (http://genomicscape.com/microarray/survival.php) [36, 37].
Statistical analyses
Mann-Whitney’s U test and Pearson Chi-square/Fisher exact test were employed to compare the difference of continuous and categorical variables between two groups. The relationship between KRAS expression and NRAS expression was analyzed by Spearman test. The impact of KRAS and NRAS expressions on prognosis was determined by Kaplan-Meier and Cox regression analyses. All the statistical analyses were performed through SPSS 20.0 software package. For all analyses, a two-tailed P value less than 0.05 was determined as statistically significant.
Abbreviations
AML: acute myeloid leukemia; CR: complete remission; CN-AML: cytogenetically normal AML; GEO: Gene Expression Omnibus; MDS: myelodysplastic syndrome; BM: bone marrow; WHO: World Health Organization; BMMNCs: BM mononuclear cells; APL: acute promyelocytic leukemia; ATRA: all-trans retinoic acid; RQ-PCR: real-time quantitative PCR; HRMA: high-resolution melting analysis; OS: overall survival.
Author contributions
Jun Qian and Jiang Lin conceived and designed the experiments; Jing-dong Zhou and Xi-xi Li performed the experiments; Dong-dong Yao, Ji-chun Ma, Hong Guo, and Zhao-qun Deng gave technical support; Jing-dong Zhou and Dong-ming Yao analyzed the data; Ting-juan Zhang and Wei Zhang contributed clinical data collection; Jing-dong Zhou wrote the paper.
ACKNOWLEDGMENTS
This work was supported by National Natural Science foundation of China (81270630), Special Funds of “Ke Jiao Qiang Wei” Project of Jiangsu Province, 333 Project of Jiangsu Province (BRA2016131), Six Talent Peaks Project in Jiangsu Province (2015-WSN-115), Medical Innovation Team of Jiangsu Province (CXTDB2017002), Postgraduate Research & Practice Innovation Program of Jiangsu Province (KYCX17_1821), China Postdoctoral Science Foundation funded project (2016M601748), Social Development Foundation of Zhenjiang (SH2015058, SH2016045, SH2016046), Key Medical Talent Program of Zhenjiang City.
CONFLICTS OF INTEREST
The authors stated that there are no conflicts of interest regarding the publication of this article.
REFERENCES
1. Estey E, Döhner H. Acute myeloid leukaemia. Lancet. 2006; 368:1894-907.
2. Döhner H, Estey EH, Amadori S, Appelbaum FR, Büchner T, Burnett AK, Dombret H, Fenaux P, Grimwade D, Larson RA, Lo-Coco F, Naoe T, Niederwieser D, et al. Diagnosis and management of acute myeloid leukemia in adults: recommendations from an international expert panel, on behalf of the European LeukemiaNet. Blood. 2010; 115:453-74.
3. Mrózek K, Heerema NA, Bloomfield CD. Cytogenetics in acute leukemia. Blood Rev. 2004; 18:115-36.
4. Mrózek K, Marcucci G, Paschka P, Whitman SP, Bloomfield CD. Clinical relevance of mutations and gene-expression changes in adult acute myeloid leukemia with normal cytogenetics: are we ready for a prognostically prioritized molecular classification? Blood. 2007; 109:431-48.
5. Alvarado Y, Giles FJ. Ras as a therapeutic target in hematologic malignancies. Expert Opin Emerg Drugs. 2007; 12:271-84.
6. Le DT, Shannon KM. Ras processing as a therapeutic target in hematologic malignancies. Curr Opin Hematol. 2002; 9:308-15.
7. Braun BS, Shannon K. Targeting Ras in myeloid leukemias. Clin Cancer Res. 2008; 14:2249-52.
8. Yang X, Qian J, Sun A, Lin J, Xiao G, Yin J, Chen S, Wu D. RAS mutation analysis in alarge cohort of Chinese patients with acute myeloid leukemia. Clin Biochem. 2013; 46:579-83.
9. Neubauer A, Dodge RK, George SL, Davey FR, Silver RT, Schiffer CA, Mayer RJ, Ball ED, Wurster-Hill D, Bloomfield CD. Prognostic importance of mutations in the ras proto-oncogenes in de novo acute myeloid leukemia. Blood. 1994; 83:1603-11.
10. Paquette RL, Landaw EM, Pierre RV, Kahan J, Lübbert M, Lazcano O, Isaac G, McCormick F, Koeffler HP. N-ras mutations are associated with poor prognosis and increased risk of leukemia in myelodysplastic syndrome. Blood. 1993; 82:590-9.
11. Radich JP, Kopecky KJ, Willman CL, Weick J, Head D, Appelbaum F, Collins SJ. N-ras mutations in adult de novo acute myelogenous leukemia: prevalence and clinical significance. Blood. 1990; 76:801-7.
12. Stirewalt DL, Kopecky KJ, Meshinchi S, Appelbaum FR, Slovak ML, Willman CL, Radich JP. FLT3, RAS, and TP53 mutations in elderly patients with acute myeloid leukemia. Blood. 2001; 97:3589-95. Erratum in: Blood. 2001; 98:924.
13. Pectasides D, Kotoula V, Papaxoinis G, Alexopoulou Z, Dervenis C, Samantas E, Papaparaskeva K, Charalambous E, Gkakou C, Agalianos C, Kalogeras KT, Pentheroudakis G, Fountzilas G. Expression patterns of growth and survival genes with prognostic implications in advanced pancreatic cancer. Anticancer Res. 2016; 36:6347-56.
14. Ohgami RS, Ma L, Merker JD, Gotlib JR, Schrijver I, Zehnder JL, Arber DA. Next-generation sequencing of acute myeloid leukemia identifies the significance of TP53, U2AF1, ASXL1, and TET2 mutations. Mod Pathol. 2015; 28:706-14.
15. Marcucci G, Maharry K, Wu YZ, Radmacher MD, Mrózek K, Margeson D, Holland KB, Whitman SP, Becker H, Schwind S, Metzeler KH, Powell BL, Carter TH, et al. IDH1 and IDH2 gene mutations identify novel molecular subsets within de novo cytogenetically normal acute myeloid leukemia: a Cancer and Leukemia Group B study. J Clin Oncol. 2010; 28:2348-55.
16. Tao S, Wang S, Moghaddam SJ, Ooi A, Chapman E, Wong PK, Zhang DD. Oncogenic KRAS confers chemoresistance by upregulating NRF2. Cancer Res. 2014; 74:7430-41.
17. Wei F, Liu Y, Bellail AC, Olson JJ, Sun SY, Lu G, Ding L, Yuan C, Wang G, Hao C. K-Ras mutation-mediated IGF-1-induced feedback ERK activation contributes to the rapalog resistance in pancreatic ductal adenocarcinomas. Cancer Lett. 2012; 322:58-69.
18. Réjiba S, Wack S, Aprahamian M, Hajri A. K-ras oncogene silencing strategy reduces tumor growth and enhances gemcitabine chemotherapy efficacy for pancreatic cancer treatment. Cancer Sci. 2007; 98:1128-36.
19. Chen S, Wang Y, Zhang Y, Wan Y. Low expression of PKCα and high expression of KRAS predict poor prognosis in patients with colorectal cancer. Oncol Lett. 2016; 12:1655-60.
20. An SJ, Huang YS, Chen ZH, Han JF, Yang JJ, Zhou Q, Xie Z, Yang Y, Yan HH, Wu YL. Lower Ras expression as an independent predictor of patient outcomes in lung cancer treated with bevacizumab plus chemotherapy. Cancer Gene Ther. 2014; 21:110-4.
21. Li Y, Lin J, Yang J, Qian J, Qian W, Yao DM, Deng ZQ, Liu Q, Chen XX, Xie D, An C, Tang CY. Overexpressed let-7a-3 is associated with poor outcome in acute myeloid leukemia. Leuk Res. 2013; 37:1642-7.
22. Zhou JD, Zhang TJ, Li XX, Ma JC, Guo H, Wen XM, Zhang W, Yang L, Yan Y, Lin J, Qian J. Epigenetic dysregulation of ID4 predicts disease progression and treatment outcome in myeloid malignancies. J Cell Mol Med. 2017; 21:1468-81. https://doi.org/10.1111/jcmm.13073.
23. Grimwade D, Hills RK, Moorman AV, Walker H, Chatters S, Goldstone AH, Wheatley K, Harrison CJ, Burnett AK; National Cancer Research Institute Adult Leukaemia Working Group. Refinement of cytogenetic classification in acute myeloid leukemia: determination of prognostic significance of rare recurring chromosomal abnormalities among 5876 younger adult patients treated in the United Kingdom Medical Research Council trials. Blood. 2010; 116:354-65.
24. Zhou JD, Yang L, Zhang YY, Yang J, Wen XM, Guo H, Yao DM, Ma JC, Chen Q, Lin J, Qian J. Overexpression of BAALC: clinical significance in Chinese de novo acute myeloid leukemia. Med Oncol. 2015; 32:386.
25. Birkeland E, Busch C, Berge EO, Geisler J, Jönsson G, Lillehaug JR, Knappskog S, Lønning PE. Low BRAF and NRAS expression levels are associated with clinical benefit from DTIC therapy and prognosis in metastatic melanoma. Clin Exp Metastasis. 2013; 30:867-76.
26. Ruíz-Godoy RL, Garcia-Cuellar CM, Herrera González NE, Suchil BL, Pérez-Cárdenas E, Sácnchez-Pérez Y, Suárez-Roa ML, Meneses A. Mutational analysis of K-ras and Ras protein expression in larynx squamous cell carcinoma. J Exp Clin Cancer Res. 2006; 25:73-8.
27. Zhou JD, Yao DM, Han L, Xiao GF, Guo H, Zhang TJ, Li XX, Yuan Q, Yang L, Lin J, Qian J. Low NKD1 expression predicts adverse prognosis in cytogenetically normal acute myeloid leukemia. Tumour Biol. 2017; 39:1-8.
28. Lin J, Yao DM, Qian J, Chen Q, Qian W, Li Y, Yang J, Wang CZ, Chai HY, Qian Z, Xiao GF, Xu WR. Recurrent DNMT3A R882 muta-tions in Chinese patients with acute myeloid leukemia and myelodysplastic syndrome. PLoS One. 2011; 6:e26906.
29. Qian J, Yao DM, Lin J, Qian W, Wang CZ, Chai HY, Yang J, Li Y, Deng ZQ, Ma JC, Chen XX. U2AF1 mutations in Chinese patients with acute myeloid leukemia and myelodysplastic syndrome. PLoS One. 2012; 7:e45760.
30. Lin J, Yang J, Wen XM, Yang L, Deng ZQ, Qian Z, Ma JC, Guo H, Zhang YY, Qian W, Qian J. Detection of SRSF2-P95 mutation by high-resolution melting curve analysis and its effect on prognosis in myelodysplastic syndrome. PLoS One. 2014; 9:e115693.
31. Yang J, Yao DM, Ma JC, Yang L, Guo H, Wen XM, Xiao GF, Qian Z, Lin J, Qian J. The prognostic implication of SRSF2 mutations in Chinese patients with acute myeloid leukemia. Tumour Biol. 2016; 37:10107-14.
32. Lin J, Yao DM, Qian J, Chen Q, Qian W, Li Y, Yang J, Wang CZ, Chai HY, Qian Z, Xiao GF, Xu WR. IDH1 and IDH2 mutation analysis in Chinese patients with acute myeloid leukemia and myelodysplastic syndrome. Ann Hematol. 2012; 91:519-25.
33. Lin J, Qian J, Yao DM, Li Y, Yang J, Chen Q, Chai HY, Xiao GF, Xu WR. Rapid and reliable detection of IDH1 R132 mutations in acute myeloid leukemia using high-resolution melting curve analysis. Clin Biochem. 2011; 44:779-83.
34. Wen XM, Lin J, Yang J, Yao DM, Deng ZQ, Tang CY, Xiao GF, Yang L, Ma JC, Hu JB, Qian W, Qian J. Double CEBPA mutations are prognostically favorable in non-APL acute myeloid leukemia patients with wild-type NPM1 and FLT3-ITD. Int J Clin Exp Pathol. 2014; 7:6832-40.
35. Wen XM, Hu JB, Yang J, Qian W, Yao DM, Deng ZQ, Zhang YY, Zhu XW, Guo H, Lin J, Qian J. CEBPA methylation and mutation in myelodysplastic syndrome. Med Oncol. 2015; 32:192.
36. Metzeler KH, Hummel M, Bloomfield CD, Spiekermann K, Braess J, Sauerland MC, Heinecke A, Radmacher M, Marcucci G, Whitman SP, Maharry K, Paschka P, Larson RA, et al. An 86-probe-set gene-expression signature predicts survival in cytogenetically normal acute myeloid leukemia. Blood. 2008; 112:4193-201.
37. Kassambara A, Rème T, Jourdan M, Fest T, Hose D, Tarte K, Klein B. GenomicScape: an easy-to-use web tool for gene expression data analysis. Application to investigate the molecular events in the differentiation of B cells into plasma cells. PLoS Comput Biol. 2015; 11:e1004077.