
INTRODUCTION
KRAS is one of the most commonly mutated oncogenes in NSCLC, with a reported frequency of 15–30% [1]. Due to the lack of a direct RAS inhibitor with clinically proven efficacy [2], targeting RAS downstream signaling such as the RAF->MEK->ERK->MAPK pathway has become a promising approach [3]. Since RAS activates more than a dozen downstream signaling pathways [4], a combination approach was found necessary to achieve durable response [5, 6]. In a recent large scale screening [7], MEK inhibitors were among the most effective agents in KRAS-mutant cancers [7], making MEK inhibitor a promising backbone for combination therapy [8].
In combination with docetaxel, the MEK inhibitor selumetinib was shown initially in a phase II trial to be highly promising in advanced NSCLC with KRAS mutation [9]. However, this initial signal of efficacy was not confirmed in a recent phase III study, the SELECT-1 trial (NCT01933932). One of the potential explanations is that concomitant mutations (e.g. PIK3CA, PTEN, LKB1, etc.) could modify the treatment response as shown previously [10, 11]. For example, in a study based on genetically-engineered mouse (GEM) models, concomitant loss of LKB1 conferred primary resistance to the combination of selumetinib with docetaxel [11]. Considering KRAS also activates multiple other signaling pathways [4], identifying novel MEK inhibitor-based combination therapies with potential effectiveness in cancer cells with various concomitant mutations is therefore urgently needed. An ideal combination would enhance the therapeutic effect of MEK inhibition (MEKi), have minimal or no added side effects, and be potentially effective against a wide range of concomitant mutations.
Targeting cancer metabolism in combination with MEK inhibition might be such a candidate strategy. Studies have shown that targeting cancer metabolism is effective in tumors harboring different mutations in either oncogenes (e.g. MYC, PIK3CA, etc.) or tumor suppressors (e.g. TP53, PTEN, LKB1, etc.) [12–14], likely because those genetic alterations are actively involved in the metabolic process and control the metabolic rewiring of cancer cells [15]. In fact, due to the unique metabolic features of cancer cells, genetic changes that confer resistance to traditional therapies may paradoxically offer treatment advantages when cancer metabolism is targeted [12, 16].
Phenformin, a biguanide antidiabetic agent is such a compound that inhibits cancer metabolism by primarily targeting mitochondria complex I [12]. Phenformin has been shown to have direct anti-cancer effects [17–19] and to enhance the therapeutic effects of either radiation [20] or targeted therapies [21]. While the loss of LKB1 promotes lung cancer metastasis [22], LKB1 also functions as a master regulator of cell metabolism through activation of the downstream AMPK signaling pathway [23]. With the presence of functional LKB1, the depletion of ATP by phenformin activates AMPK signaling which subsequently inhibits the mTOR pathway resulting in growth arrest [24]. However, with the loss of functional LKB1, the reduced ability to adapt to energy stress due to inactivation of AMPK signaling directly renders the cells prone to apoptosis [16, 24]. This dual effect of phenformin (and also metformin) under alternative LKB1 status makes its combination with MEKi an appealing strategy for KRAS-mutant NSCLC. In addition, lung cancer in general has high rate of aerobic glycolysis [25, 26] (hence the clinical use of PET imaging [27]), which becomes even more prominent in the setting of KRAS and LKB1 mutations [11], therefore making the use of phenformin even more relevant [16].
On the basis of these data, we aimed to determine if concomitant LKB1 mutation in KRAS-mutant NSCLC directly associates with decreased response to MEK inhibitor selumetinib, and if so, to define the underlying mechanism. We also assessed whether phenformin can overcome the resistance by enhancing the therapeutic effect of selumetinib. The findings from this study also help us to understand whether the dual targeting of MEK and cancer metabolism may be a novel and effective strategy to tackle KRAS-mutant NSCLC.
RESULTS
A systematic review suggests concomitant LKB1 mutation in KRAS-mutant NSCLC confers relative resistance to the MEK inhibitor selumetinib
Although a previous study based on GEM models suggested that concomitant lkb1 loss in the setting of krasG12D mutation confers primary resistance to selumetinib and docetaxel in combination [11], it did not provide clear evidence to show decreased sensitivity to selumetinib alone, probably due to small sample size (their Supplementary Figure 5) [11]. To address this question, we first conducted a systematic review aiming to identify all NSCLC cell lines harboring KRAS mutation that were tested with selumetinib in the literature. Table 1 is the summary of these 23 cell lines with their KRAS and LKB1 status. When we used IC50 < = 1 μM to define the sensitive cell lines and > 1 μM for the resistant ones, we observed a correlation between concomitant LKB1 mutation and relative resistance to selumetinib (Figure 1A, two-tailed Fisher’s exact test, p = 0.0318). Due to the contradictory reports regarding Calu-1 and H358 cells in the literature, only 21 out of the 23 cell lines were used for statistical analysis. Since the H1155 cell line has a silent LKB1 mutation, it was included in the LKB1 wild type group. An attempt to compare the reported IC50 value by using nonparametric Mann–Whitney test also revealed concomitant LKB1 mutation correlates with higher IC50 (Figure 1B, two-tailed, p = 0.042). Interestingly, when we expanded the criteria to include NSCLC cell lines harboring any RAS and/or RAF mutations, we observed an even stronger correlation possibly due to the increased sample size (Supplementary Table 1 and Supplementary Figure 1A and 1B).
Table 1: Characterization of the 23 NSCLC cell lines used in the systematic review
Cell line |
KRAS status |
LKB1 status |
Selumetinib IC50 (μM) |
|---|---|---|---|
Considered as sensitive to selumetinib (IC50 < = 1 mM) |
|||
H441 |
KRAS G12V |
WT(1) |
< 0.30(2) |
Calu-6 |
KRAS Q61K |
WT(3) |
0.32(4), 0.33(2), 1.0(5) |
SK-LU-1 |
KRAS G12D |
WT(3) |
0.5(5) |
H2009 |
KRAS G12A |
WT(6, 7) |
0.99(4) |
H727 |
KRAS G12V |
WT(1) |
0.01(8) |
SW900 |
KRAS G12V |
WT(9) |
0.28(8) |
H1944 |
KRAS G13D |
K62N, K78N |
< 0.30(2) |
A427 |
KRAS G12D |
Null(10, 11) |
0.55(2) |
H2122 |
KRAS G12C |
P281fs*6, deletion(10, 12) |
< 0.1(5), 1.0(13) |
Considered as resistant to selumetinib (IC50 > 1 μM) |
|||
A549 |
KRAS G12S |
Q37* |
0.8(2), > 1(14), 5(15), ~5(16), 6.3(8), ~10(5), > 10(17) |
H23 |
KRAS G12C |
W332* |
1.5(2), > 10(17) |
H460 |
KRAS G12S |
Q37* |
1.7(2), 9.6(8), > 10(15), > 10(5) |
H2030 |
KRAS G12C |
E317*, E357K, M392I |
2.2(2) |
H2122 |
KRAS G12C |
P281fs*6 |
~3(16) |
H1734 |
KRAS G13C |
M51fs*14 |
4.2(2) |
H157 |
KRAS G12R |
Null(10, 11) |
9.3(8), > 10(17) |
HCC44 |
KRAS G12C |
M51I, 52 → 162 stop(10) |
~10(16) |
H1355 |
KRAS G13C |
R49L(6, 18) |
~100(16) |
H647 |
KRAS G13D |
Null(19) |
> 5.0(2), > 10(5) |
H2887 |
KRAS G12V(6, 20, 21) |
WT(6) |
38(16) |
H1155 |
KRAS Q61H |
WT (silent: I46I, P281P) |
> 5.0(2) |
Controversial results in literature |
|||
Calu-1 |
KRAS G12C |
WT(12) |
< 0.2(2), > 1(14), ~130(16) |
H358 |
KRAS G12C |
WT(12) |
0.2(17), 0.5(2), 1.0(14), ~10(16), > 10(8) |
All cell lines were extracted from the literature according to the search criteria stated in the text. They all have KRAS mutation, and were tested with selumetinib. Unless specifically noted, all mutation profiles were confirmed in COSMIC database. Since COSMIC database does not report wild type (WT) genes, the wild type LKB1 status was confirmed through literature search. Numbers in parentheses correspond to the cited studies.
References
1. Molina-Arcas M, Hancock DC, Sheridan C, Kumar MS, Downward J. Coordinate direct input of both KRAS and IGF1 receptor to activation of PI3 kinase in KRAS-mutant lung cancer. Cancer Discov. 2013; 3:548–63.
2. Garon EB, Finn RS, Hosmer W, Dering J, Ginther C, Adhami S, et al. Identification of common predictive markers of in vitro response to the Mek inhibitor selumetinib (AZD6244; ARRY-142886) in human breast cancer and non-small cell lung cancer cell lines. Mol Cancer Ther. 2010; 9:1985–94.
3. Onozato R, Kosaka T, Achiwa H, Kuwano H, Takahashi T, Yatabe Y, et al. LKB1 gene mutations in Japanese lung cancer patients. Cancer Sci. 2007; 98:1747–51.
4. Meng J, Peng H, Dai B, Guo W, Wang L, Ji L, et al. High level of AKT activity is associated with resistance to MEK inhibitor AZD6244 (ARRY-142886). Cancer Biol Ther. 2009; 8:2073–80.
5. Dry JR, Pavey S, Pratilas CA, Harbron C, Runswick S, Hodgson D, et al. Transcriptional pathway signatures predict MEK addiction and response to selumetinib (AZD6244). Cancer Res. 2010; 70:2264–73.
6. Greer RM, Peyton M, Larsen JE, Girard L, Xie Y, Gazdar AF, et al. SMAC mimetic (JP1201) sensitizes non-small cell lung cancers to multiple chemotherapy agents in an IAP-dependent but TNF-α-independent manner. Cancer Res. 2011; 71:7640–8.
7. Mahoney CL, Choudhury B, Davies H, Edkins S, Greenman C, Haaften G, et al. LKB1/KRAS mutant lung cancers constitute a genetic subset of NSCLC with increased sensitivity to MAPK and mTOR signalling inhibition. Br J Cancer. 2009; 100:370–5.
8. Friday BB, Yu C, Dy GK, Smith PD, Wang L, Thibodeau SN, et al. BRAF V600E disrupts AZD6244-induced abrogation of negative feedback pathways between extracellular signal-regulated kinase and Raf proteins. Cancer Res. 2008; 68:6145–53.
9. Hata AN, Yeo A, Faber AC, Lifshits E, Chen Z, Cheng KA, et al. Failure to induce apoptosis via BCL-2 family proteins underlies lack of efficacy of combined MEK and PI3K inhibitors for KRAS mutant lung cancers. Cancer Res. 2014; 74:3146–56.
10. Matsumoto S, Iwakawa R, Takahashi K, Kohno T, Nakanishi Y, Matsuno Y, et al. Prevalence and specificity of LKB1 genetic alterations in lung cancers. Oncogene. 2007; 26:5911–8.
11. Shackelford DB, Abt E, Gerken L, Vasquez DS, Seki A, Leblanc M, et al. LKB1 inactivation dictates therapeutic response of non-small cell lung cancer to the metabolism drug phenformin. Cancer Cell. 2013; 23:143–58.
12. Liu Y, Marks K, Cowley GS, Carretero J, Liu Q, Nieland TJ, et al. Metabolic and functional genomic studies identify deoxythymidylate kinase as a target in LKB1-mutant lung cancer. Cancer Discov. 2013; 3:870–9.
13. Sun C, Hobor S, Bertotti A, Zecchin D, Huang S, Galimi F, et al. Intrinsic resistance to MEK inhibition in KRAS mutant lung and colon cancer through transcriptional induction of ERBB3. Cell Rep. 2014; 7:86–93.
14. Acquaviva J, Smith DL, Sang J, Friedland JC, He S, Sequeira M, et al. Targeting KRAS-mutant non-small cell lung cancer with the Hsp90 inhibitor ganetespib. Mol Cancer Ther. 2012; 11:2633–43.
15. Troiani T, Vecchione L, Martinelli E, Capasso A, Costantino S, Ciuffreda LP, et al. Intrinsic resistance to selumetinib, a selective inhibitor of MEK1/2, by cAMP-dependent protein kinase A activation in human lung and colorectal cancer cells. Br J Cancer. 2012; 106:1648–59.
16. Meng J, Dai B, Fang B, Bekele BN, Bornmann WG, Sun D, et al. Combination treatment with MEK and AKT inhibitors is more effective than each drug alone in human non-small cell lung cancer in vitro and in vivo. PloS one. 2010; 5:e14124.
17. Yoon YK, Kim HP, Han SW, Oh dY, Im SA, Bang YJ, et al. KRAS mutant lung cancer cells are differentially responsive to MEK inhibitor due to AKT or STAT3 activation: implication for combinatorial approach. Mol Carcinog. 2010; 49:353–62.
18. Tsai LH, Chen PM, Cheng YW, Chen CY, Sheu GT, Wu TC, et al. LKB1 loss by alteration of the NKX2-1/p53 pathway promotes tumor malignancy and predicts poor survival and relapse in lung adenocarcinomas. Oncogene. 2013.
19. Wallin JJ, Edgar KA, Guan J, Berry M, Prior WW, Lee L, et al. GDC-0980 is a novel class I PI3K/mTOR kinase inhibitor with robust activity in cancer models driven by the PI3K pathway. Mol Cancer Ther. 2011; 10:2426–36.
20. Querings S, Altmüller J, Ansén S, Zander T, Seidel D, Gabler F, et al. Benchmarking of mutation diagnostics in clinical lung cancer specimens. PloS one. 2011; 6:e19601.
21. Barbie DA, Tamayo P, Boehm JS, Kim SY, Moody SE, Dunn IF, et al. Systematic RNA interference reveals that oncogenic KRAS-driven cancers require TBK1. Nature. 2009; 462:108–12.
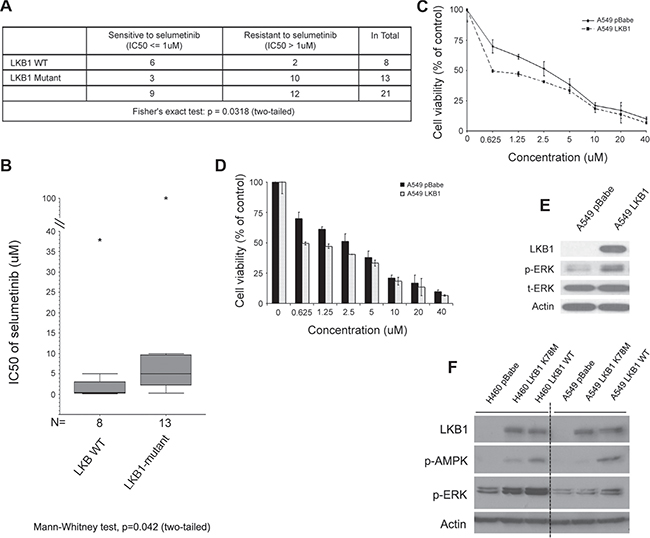
Figure 1: Concomitant LKB1 mutation correlates with selumetinib resistance and decreased level of p-ERK in KRAS-mutant NSCLC. (A) Except the two cell lines (Calu-1 and H358) with controversial reported sensitivity to selumetinib, all other cell lines listed in Table 1 are included here for statistical analysis. When using IC50 > 1 μM to define resistance to selumetinib, cell lines with concomitant LKB1 mutation (excluding silent mutation) have significantly higher chance of resistance (Fisher›s exact test: p = 0.0318, two-tailed). (B) A direct comparison of IC50 between LKB1 wild type (including silent mutation) and mutant NSCLC cell lines. Whenever possible, for each cell line, the median value of reported IC50 was used for the Mann–Whitney nonparametric test. For cell lines only having a range of value, such as > x or < y μM, then x or y value was used for estimation (p = 0.042, two-tailed). The “*” stands for outliers. (C) Representative growth inhibition assay. Isogenic A549pBabe and A549LKB1 cells were incubated with different concentrations of selumetinib for 72 hrs. With the re-expression of LKB1, cells were more sensitive to selumetinib with lower IC50. (D) Histogram of c. Cells were tested in quadruplicates. (E) Loss of LKB1 in A549pBabe cells was associated with low level of p-ERK, suggesting decreased dependency on MEK->ERK->MAPK signaling. (F) A similar phenomenon was observed using other isogenic cell lines. When using cells engineered with kinase dead LKB1 (K78M) as comparison, fully functional wild type LKB1 had the most definitive association with elevated level of p-ERK.
LKB1 inactivation associates with decreased sensitivity to selumetinib and reduced phospho-ERK level in isogenic KRAS-mutant NSCLC cell lines
To confirm the findings from our systematic review, we used isogenic KRAS-mutant NSCLC cell lines to study how LKB1 affects the response to selumetinib in the setting of KRAS mutation. Using the pBABEpuro-based retroviral infection system, we established isogenic A549, H460 and H157 stable cell lines over-expressing wild type LKB1 (labeled A549LKB1, H460LKB1 and H157LKB1 respectively) compared to their clones infected with empty vector (named A549pBabe, H460pBabe and H157pBabe respectively). Shown as an example in Figure 1C and 1D, A549LKB1 cells were more sensitive to selumetinib at certain concentrations than A549pBabe cells. A similar effect was observed in isogenic H460 and H157 cell lines (Supplementary Figure 1C and 1D). When exploring possible mechanisms for this observation, we found that A549pBabe cells have a very low level of phospho-ERK1/2 (p-ERK1/2) compared to A549LKB1 cells (Figure 1E), suggesting LKB1 inactivation is associated with less dependency on the MEK->ERK->MAPK signaling pathway, and hence decreased sensitivity to the MEK inhibitor selumetinib. Re-expression of LKB1 significantly enhanced p-ERK1/2, suggesting increased dependency might be the potential reason for enhanced sensitivity to the inhibition of this signaling pathway. This is in agreement with the observation by Chen Z et al. of a significantly decreased p-ERK1/2 level in tumors of krasG12D/lkb1-/- GEM mice compared to krasG12D/lkb1+/+ GEM mice by either IHC or Western blot, which correlated with the primary resistance to selumetinib and docetaxel combination therapy [11]. Interestingly, we observed the same phenomenon in other isogenic cell lines such as H460 (Figure 1F). When we used their isogenic cells expressing kinase dead LKB1 (K78M) as a comparison, we found that while fully functional wild type LKB1 was associated with arguably the highest level of p-ERK, the kinase dead LKB1 also led to an increased level of p-ERK. This suggests that loss of LKB1 protein via genetic alteration is critical in the reduction of p-ERK level, but LKB1 kinase activity is dispensable in this process. However, how LKB1 affects p-ERK, and whether there is a feedback loop sent from LKB1 to MAPK signaling since LKB1 can be negatively phosphorylated by ERK [28], are still currently under investigation.
LKB1 inactivation dictates enhanced sensitivity to the metabolic drug phenformin, which may synergize with the antitumor effect of selumetinib in KRAS-mutant NSCLC cell lines
In order to identify a potential MEKi based combination therapy to circumvent selumetinib resistance relating to LKB1 mutation, we performed an initial screening to examine the major differences between the isogenic cells. Using A549 cells as an example, we found consistent elevation of p-S6 in A549pBabe cells compared to A549LKB1 cells (Figure 2A), suggesting that a combination with mTOR inhibitor such as AZD8055 might be fruitful. However, a pilot study did not demonstrate clear selectivity of AZD8055 for LKB1-mutamt cells (Supplementary Figure 2A), possibly because AZD8055 inhibits both mTORC1 and mTORC2 while the inhibitory effect on mTOR from LKB1-AMPK activation is primarily on mTORC1 [29].
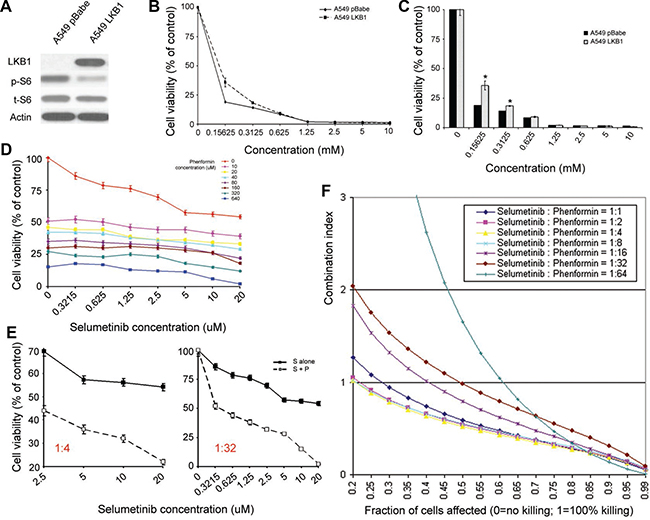
Figure 2: LKB1 inactivation dictates enhanced sensitivity to the metabolic drug phenformin, which enhances the antitumor effect of selumetinib in KRAS-mutant NSCLC cell lines. (A) In A549 cells as an example, the upregulation of p-S6 was consistently observed in cells with LKB1 inactivation. (B and C) Growth inhibition assay. Shown here are the isogenic A549 cells with alternative LKB1 status. The loss of LKB1 rendered A549 cells more sensitive to phenformin. c is the histogram of b. (D) Cell proliferation assay using different concentrations and ratios of selumetinib and phenformin in combination. The experiment ended at ~ 40 hrs after incubation. Cells were prepared in triplicate. (E) An illustration to show that under certain combination ratio (e.g. selumetinib/phenformin=1:4 or 1:32), phenformin enhanced the antitumor effect of selumetinib in ~ 40 hrs. (F) CalcuSyn was used to calculate the combination index, and demonstrated a synergistic effect at certain concentration and combination of selumetinib and phenformin. A549pBabe cells were used in d, e & f. For similar studies using A549LKB1 cells, please refer to the Supplementary Figure 2C and 2E. S: selumetinib; P: phenformin; S+P: selumetinib in combination with phenformin. The asterisks (*) denote statistical significance (p < 0.01).
LKB1 is an energy sensor, and it has been recently shown in NSCLC that regardless of the genetic background, LKB1 inactivation dictates enhanced sensitivity to the metabolic drug phenformin [16]. Thus, we wondered if we could circumvent selumetinib resistance associated with LKB1 loss by combining with phenformin (Supplementary Figure 4). In addition, since phenformin may serve as an AMPK activator in cells with wild type LKB1 [16, 21, 24], and negatively regulates mTOR activity, it is also reasonable to combine selumetinib with phenformin in cancer cells with wild type LKB1 (Supplementary Figure 4). More importantly, this combination could serve as a proof-of-concept study to investigate the value of dual targeting MEK and cancer metabolism for KRAS-mutant NSCLC.
Using isogenic A549 cells as an example, Figure 2B and 2C shows that A549pBabe cells were more sensitive to phenformin than A549LKB1 cells, which is consistent with reported findings [16], although a much lower dose was used in our proliferation assay. When we tested phenformin in cell lines established from GEM models, namely 634 (krasG12D/wt/p53-/-/lkb1wt/wt) and t2 (krasG12D/wt/p53-/-/lkb1-/-) [30], we observed a similar phenomenon (Supplementary Figure 2B). We then tested the combination effect of selumetinib and phenformin with different concentration ratios in A549 cells with alternative LKB1 status (Figure 2D and Supplementary Figure 2C), and found that at certain concentration range and combination ratios, phenformin enhanced the effect of selumetinib irrespective of LKB1 status (Figure 2E and Supplementary Figure 2D). When we used CalcuSyn to calculate the combination index, we observed a synergistic effect at certain concentration ratios irrespective of LKB1 status, although the optimal ratio between selumetinib and phenformin was different (Figure 2F and Supplementary Figure 2E). This is likely due to different sensitivity to selumetinib and phenformin in cells with alternative LKB1 status.
Phenformin enhances the anti-tumor effect of selumetinib in vitro through different mechanisms in KRAS-mutant NSCLC cell lines with alternative LKB1 status
To confirm the potential synergism, a colony assay was performed, which again demonstrated that at certain combination ratios, phenformin could significantly enhance the anti-tumor effect of selumetinib (Figure 3A). Similar results were observed in H460 isogenic cells as well (Supplementary Figure 5A). Since apoptosis is one of the most important mechanisms of cell death, we investigated the effect of combination treatment on cell apoptosis. By using flow cytometry to quantify the apoptotic population after 48 hours of treatment, we found the combination of phenformin and selumetinib resulted in significantly more apoptotic cells irrespective of LKB1 status (Figure 3B and 3C). This observation correlated well with significant down-regulation of the anti-apoptotic protein BCL-XL, which is abundantly expressed in lung cancers and correlates with poor prognosis [31, 32] (Figure 3D). Interestingly, with unknown mechanism, a significantly reduced level of BCL-2 after combination treatment was also observed in A549pBabe cells but not in A549LKB1 cells (Figure 3D).
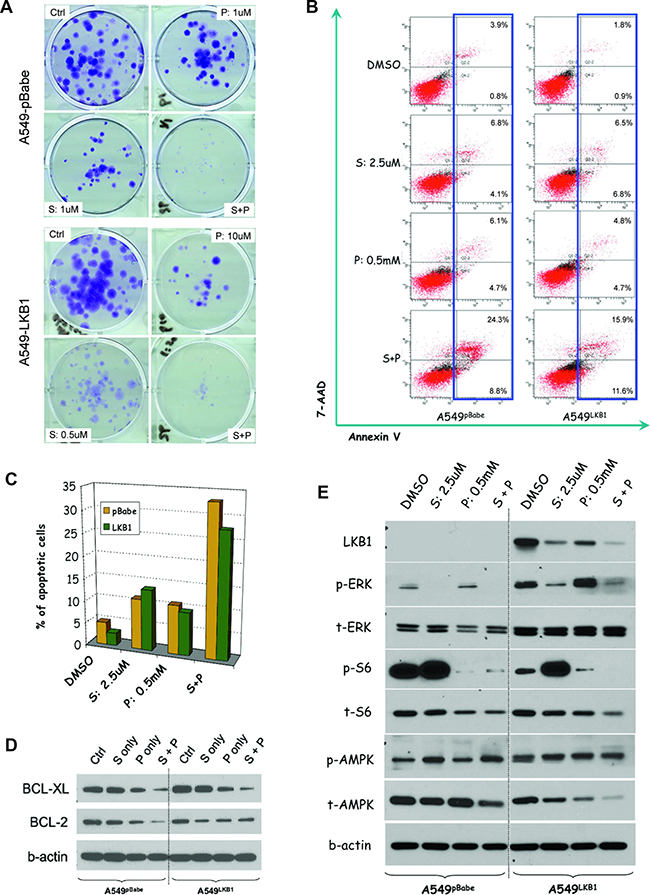
Figure 3: Phenformin enhances the anti-tumor effect of selumetinib in vitro through different mechanisms in KRAS-mutant NSCLC cell lines with alternative LKB1 status. (A) Colony assays starting with 200 cells after incubation with DMSO (ctrl), selumetinib (S), phenformin (P) or the combination (S+P) for 2 weeks. Regardless of the LKB1 status, the combination of S and P had better growth inhibition effect than either agent alone. Please note the different ratios of S and P used for each cell line. (B) After 48 hours treatment, the apoptotic population was measured via flow cytometry based on 7-AAD and annexin V staining. Irrespective of LKB1 status, the combination treatment resulted in more apoptotic cells. (C) Histogram representation of b. (D) In both A549pBabeand A549LKB1 cells, the combination therapy potently downregulated BCL-XL level. However, only in A549pBabe cells, the S+P combination reduced BCL-2 level more significantly than either S or P alone. (E) Western blot showing LKB1 inactivation resulted in lower level of p-ERK but high p-S6. Selumetinib alone potently suppressed p-ERK but upregulated p-S6 after incubation for 48 hrs. Phenformin helped suppress p-S6. Although in A549LKB1 cells, the suppression was parallel to AMPK activation (i.e. increased p-AMPK/t-AMPK ratio), in A549pBabe cells, no significant change in p-AMPK/t-AMPK ratio was observed.
Since phenformin may inhibit mTOR signaling through the activation of AMPK in cells with wild type LKB1 [16, 21, 24], but the loss of LKB1 dictates sensitivity to phenformin [16], we wondered if the observed synergy was due to different mechanisms in cells with different LKB1 status. An analysis of potential involved signaling pathways showed in both cases, the combination of phenformin and selumetinib significantly inhibited p-ERK and p-S6 (Figure 3E). In A549pBabe cells, compared to the control group receiving DMSO, phenformin did not affect the p-AMPK/t-AMPK (total AMPK) ratio. However, in A549LKB1 cells, there was significant elevation of p-AMPK/t-AMPK ratio, suggesting the inhibition of p-S6 by phenformin in A549LKB1 cells was parallel to the activation of AMPK but was AMPK-independent in A549pBabe cells (Figure 3E). To confirm above findings are not A549 cell line specific, we performed similar experiments using isogenic H460 cells. As shown in Supplementary Figure 5C, the combination of selumetinib and phenformin again significantly reduced the levels of p-ERK and p-S6. Consistent to our observation from A549 isogenic cells, only in H460LKB1 cells, such inhibition of phosphorylated ERK and S6 was parallel to the activation of AMPK. Taking these data together, although phenformin enhanced the effect of selumetinib regardless of the LKB1 status, the underlying mechanisms were different.
Phenformin enhances the therapeutic effect of selumetinib in vivo regardless of the LKB1 status, and their combination resulted in more robust apoptosis and attenuation of major growth signaling pathways
To directly compare treatment response in tumors with different LKB1 status, the isogenic A549pBabe and A549LKB1 cells were implanted in the same mouse on the left and right flank respectively (Figure 4A upper panel). Our expectation was that if LKB1 does have tumor suppressing function, then the tumor on the right side (from A549LKB1 cells) would be smaller over time than the tumor on the left (from A549pBabe cells). If the loss of LKB1 confers resistance to selumetinib, but dictates sensitivity to phenformin, then after selumetinib treatment the size difference between A549pBabe and A549LKB1 tumors would be even greater. However, the difference would be smaller after treatment with phenformin. If phenformin enhances the anti-tumor effect of selumetinib, then tumors of both sides after combination treatment would be significantly smaller than control tumors or those treated with either selumetinib or phenformin alone (Figure 4A upper panel). As expected, A549LKB1 tumors (right) did grow more slowly than A549pBabe tumors (left) in the control group (received diluted DMSO), and the loss of LKB1 (A549pBabe tumors) did confer resistance to selumetinib (Figure 4B–4D, and Supplementary Figure 6). However, although the A549pBabe tumors (left) were significantly smaller in mice treated with phenformin than in control mice before treatment day 18 (Figure 4B), some of these tumors eventually caught up and there was no significant difference on the day of sacrifice (Figure 4B–4D, and Supplementary Figure 6). This observation suggested that, at least in this xenograft model, single agent phenformin at the current dose/frequency was not sufficient to achieve long-term tumor suppression. However, phenformin did enhance the therapeutic effect of selumetinib significantly and consistently regardless of the LKB1 status (Figure 4B–4D). Importantly, at the dose used, all mice tolerated the combination treatment well without significant side effects observed (e.g. skin rash, body weight, gross histology of major organs, etc) (Supplementary Figure 3A and 3B).
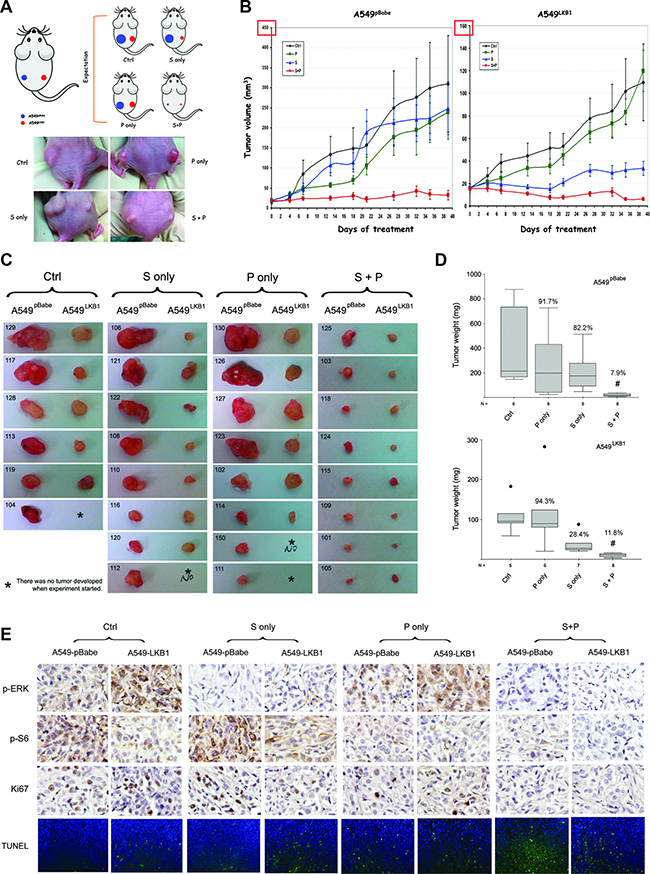
Figure 4: Phenformin enhances the therapeutic effect of selumetinib in vivo regardless of LKB1 status. (A) Upper panel: illustration of the xenograft model in nude mice. ~ 1.5 million A549pBabe and A549LKB1 cells were implanted on the left and right flank of nude mice respectively. Treatment started once the tumors became palpable. Mice were orally gavaged daily with DMSO (ctrl), selumetinib (S, 50 mg/kg), phenformin (P, 100 mg/kg) or the combination (S+P), 5 days per week. Lower panel: representative mouse from each group on day 26 post-treatment. (B) Xenograft tumor growth curve. A549LKB1 tumors were smaller than A549pBabe tumors, consistent with the tumor-suppressing function of LKB1. A549pBabe tumors were resistant to selumetinib whereas A549LKB1 tumors were sensitive, consistent with in vitro data shown in the previous figures. Although A549pBabe tumors were more sensitive to phenformin initially, growth of some tumors quickly caught up resulting in no statistical difference after day 18. The combination of S and P potently inhibited the growth of tumors of both A549pBabe and A549LKB1 cells. (C) All tumors harvested from the mice. Tumors of A549pBabe and A549LKB1 cells from the same mice were placed next to each other. Some mice did not develop tumor from A549LKB1 cells (labeled with *). The individual number indicates each individual mouse. The combination of selumetinib and phenformin demonstrated potent inhibition. (D) Box-and-Whisker plots showing the weight of tumors in c. The medians of tumor weight from each group were compared using nonparametric Kruskal–Wallis test. Tumors treated with combination therapy had the lowest weight (i.e. smallest). The percentage of median tumor weight over the control is shown on each Box-and-Whisker plot. (E) Representative IHC staining of p-ERK, p-S6, Ki67, and representative TUNEL staining of tumor sections from different groups with alternative LKB1 status. Again, the combination of selumetinib and phenformin resulted in the lowest signals of p-ERK, p-S6, Ki67 and TUNEL staining. The # denotes statistical significance (p < 0.01 in either case).
IHC analysis of the tumor tissue confirmed that the combination of phenformin and selumetinib resulted in decreased levels of p-ERK regardless of LKB1 status (Figure 4E). In accordance with the enhanced apoptosis observed in vitro (Figure 3B–3D) and suppressed tumor growth in vivo (Figure 4B–4D), we also observed less Ki-67 and increased TUNEL signals in the group receiving combination treatment (Figure 4E). Hence, this combination treatment suppressed tumor growth likely through the inhibition of cell proliferation as well as the activation of apoptosis. When comparing the matched tumors in each group, A549LKB1 tumors showed significantly higher TUNEL signal than A549pBabe tumors in the control group, which confirms the tumor suppressing function of LKB1 (Supplementary Figure 3C). In almost every mouse treated with selumetinib only, the TUNEL signal was significantly higher in the A549LKB1 tumor than its matched A549pBabe tumor, consistent with our observation that the loss of LKB1 confers resistance to selumetinib whereas the restoration of wild type LKB1 enhances sensitivity (Supplementary Figure 3D). In the larger A549pBabe tumors in the phenformin only group (e.g. #130, 126, 127 and 123 in Figure 4C), we observed only minimal TUNEL signal (data not shown), which could explain the loss of growth inhibition by phenformin at that time point (Figure 4B and 4D). A similar statistical analysis could not be performed in the combination (S+P) group due to tiny or even undetectable tumor foci.
DISCUSSION
Through a meta-analysis based on multiple reported studies, as well as our own isogenic cell lines, we have clearly demonstrated that in the setting of KRAS mutation, LKB1 inactivation correlates with decreased response to the MEK inhibitor selumetinib probably through decreased dependency on MEK->ERK->MAPK signaling pathway. This is consistent with the previous observation using GEM models harboring kras G12D mutation [11]. Interestingly, using BRAFV600E mutant melanoma cells, Zheng et al. demonstrated that LKB1 could be negatively phosphorylated at the Ser325 and Ser428 sites by ERK and RSK, respectively [28]. We thus wondered if a similar situation occurs in KRAS-mutant NSCLC, and whether there exists a negative feedback loop sent from LKB1 to RAF->MEK->ERK so that when LKB1 is inactivated, the activity of MAPK signaling is correspondingly attenuated, hence the seemingly reduced dependency. However, a recent study by Kaufman et al. using an LKB1 loss-associated gene expression signature suggested that human lung cancer differs substantially from the expression profile of the krasG12D/lkb1 floxed GEM model [33], therefore raising the concern that the sensitivity to MEK inhibition observed in GEM models may not be extrapolated to human lung cancer with LKB1 mutation. While biological differences do exist between murine models and cancer patients, we found the gene expression profiling of human cancer in Kaufman’s study has no selection regarding RAS/RAF status, but this was compared directly to the data derived from the krasG12D/lkb1 floxed GEM which uniformly harbors krasG12D mutation [33]. Therefore data needs to be interpreted cautiously, and preferably under a defined genetic context. This is especially important for LKB1 since its regulation and function is highly context dependent [34, 35].
Our study again confirmed that LKB1 inactivation sensitized lung cancer cells to phenformin as previously observed [16]. However, despite using comparable dose and frequency, in our xenograft model, phenformin alone was not sufficient to continue suppressing the growth even of tumors derived from LKB1-deficient A549pBabe cells. This differs from the observations using GEM models, which demonstrated that phenformin alone was potent enough to significantly reduce lung tumor load in kras/lkb1 double mutant mice [16]. These different outcomes may be due to differences in the metabolism of cancer cells modified by growth under different environments (e.g. flank vs. lungs), for example, subcutaneous implantation will likely place the cancer cells in a much less vascularized and more hypoxic environment compared to orthotopic growth [36]. Another factor may be suboptimal delivery of phenformin in our xenograft model. Nevertheless, it seems the tested concentrations of phenformin were sufficient to enhance the therapeutic response to selumetinib.
Interestingly, the enhancement of selumetinib activity by phenformin occurred regardless of LKB1 status, although different mechanisms were employed. In LKB1-wild type NSCLCs, the combination of MEK inhibitor and metformin was found to down-regulate GLI1 transcriptional activity to mediate an anti-tumor activity [37]. The action of phenformin paralleled the activation of AMPK in cells with wild type LKB1 but not in LKB1-deficient isogenic cells, consistent with the literature [16, 21]. However, in LKB1-deficient cells, whether phenformin suppressed p-S6 in an AMPK-independent manner through inhibiting mTORC1 in a rag GTPase-dependent manner much like metformin [38], or through other mechanisms needs further investigation. While the combination of selumetinib and phenformin significantly suppressed BCL-XL level regardless of LKB1 status, it is intriguing that BCL-2 was only significantly down-regulated in vitro in A549pBabe cells. Although this could be due to different regulation of BCL-XL and BCL-2 as previously pointed out [39], the exact mechanism needs to be further explored. Nevertheless, the observation that phenformin was able to enhance selumetinib regardless of LKB1 status is important and novel. It suggests a pre-screening of LKB1 status is not necessary for this combination therapy. Since there is no standard approach to evaluate the functional status of LKB1 in the clinical setting (as it can be potentially affected by both genetic and epigenetic modifications), this finding offers convenience if such combination therapy is considered for KRAS-mutant NSCLC.
As a biguanide anti-diabetic drug, phenformin was withdrawn from the market in the 1970s due to rare but severe lactic acidosis [40, 41]. However, it has several advantages over its sister drug metformin from the perspective of targeting cancer metabolism: 1) it is almost 50 times more potent than metformin in targeting mitochondrial complex I [42]; 2) it does not require specific transporters as metformin does, therefore it has superior bioavailability than metformin [43]. Because of these features, there is resurged interest in using phenformin for cancer treatment, and side effects are expected to be less common in cancer therapy since the agent does not need to be taken daily as in diabetes treatment [16]. However, with the current unavailability of phenformin for clinical use, it will be interesting to test MEK inhibition in combination with metformin, especially considering metformin has anti-cancer mechanisms specifically relevant to KRAS-mutant cancer, such as down-regulation of PI3K->AKT->mTOR signaling [44], displacement of constitutively active KRAS from the cell membrane and uncoupling of the MAPK signaling pathway [45]. This idea is supported by a recent published study by Vujic et al. who showed metformin synergized with trametinib (another MEK inhibitor) in NRAS-mutant melanoma, lung cancer and neuroblastoma [46]. In fact, we have designed a similar murine lung cancer co-clinical trial as previously reported [11], to combine metformin and MEK inhibition in KRAS-driven lung cancer GEM models with different concomitant mutations, and plan to incorporate the data into a clinical trial using the same combination for patients with KRAS-mutant NSCLC.
Overall, our study has not only identified a novel combination of phenformin with MEK inhibition for KRAS-mutant NSCLC, it also provides proof of concept that dual targeting of an oncogenic growth signal and cancer metabolism can be a novel and fruitful approach to achieve steady and significant tumor suppression. However, since the metabolic rewiring of cancer cells is very context dependent [12], mitochondrial complex 1 may not always be the best target. Therefore, one of our future goals is to identify the potential metabolism targets in a defined genetic and phenotypic context, for example, to identify the most important enzyme or metabolic intermediate in the most crucial metabolic pathway (e.g. glycolysis vs. TCA cycle vs. glutaminolysis, etc.) in lung adenocarcinoma harboring KRAS mutation, and determine how concomitant genetic alterations such as LKB1 inactivation modify the metabolic targets. Such investigations have the potential to make targeting cancer metabolism more precise, and to add another layer of accuracy in personalized therapy.
In summary, our study has demonstrated that in KRAS-mutant NSCLC, concomitant LKB1 mutation correlates with decreased response to selumetinib. However, regardless of LKB1 status, phenformin enhances the therapeutic response of selumetinib. This study serves as the proof of concept that dual targeting of MEK and cancer metabolism may be a novel approach to tackle KRAS-mutant NSCLC.
MATERIALS AND METHODS
Systematic review
The search term “selumetinib” OR “AZD6244” OR “AZD 6244” OR “ARRY142886” OR “ARRY 142886” OR “ARRY-142886” was used for the initial search on PubMed, followed by manual selection with the goal of identifying all NSCLC cell types harboring KRAS mutation that were treated with selumetinib. The genetic background of KRAS and LKB1 were confirmed through the COSMIC database (http://cancer.sanger.ac.uk). Wild type LKB1 was also confirmed through literature search. Selumetinib IC50 values were extracted and used for initial study of the correlation between LKB1 status and sensitivity to selumetinib. The cells were defined as sensitive to selumetinib if their IC50 was equal to or lower than 1uM, or resistant if the IC50 was higher than 1μM as previously described [47].
Drugs
Selumetinib (AZD6244, Catalog No. S1008) and phenformin (Catalog No. S2542) were purchased from Selleck Chemicals. For in vitro studies, selumetinib was prepared as 20mM stock solution in DMSO and phenformin 200 mM in H2O. For in vivo studies, selumetinib was first dissolved into a homogenous suspension in a minimum volume of DMSO, and then diluted in H2O to a final concentration of 20 mg/ml. Phenformin was dissolved in H2O with a final concentration of 40 mg/ml. 50 μl of each drug was used for daily oral gavage.
Culture of cell lines and assessment of cytotoxicity of selumetinib, phenformin, or their combinations
NSCLC cell lines A549, H460 and H157 were purchased from the American Type Culture Collection (ATCC), and their identities were verified by genotyping service at Emory University. Mutations in LKB1 in A549, H460 and H157 were verified by genomic sequencing [48]. The pBABEpuro-based retroviruses encoding wild type LKB1 were used to infect and establish stable isogenic cell lines for A549, H460 and H157; all have KRAS mutation but LKB1 inactivation. Here, A549LKB1, H460LKB1 and H157LKB cells have stable expression of wild-type LKB1 cDNA, whereas A549pBabe, H460pBabe and H157pBabe cells only encode empty vector (LKB1 deficient) [49]. The cells were grown in RPMI medium supplemented with 10% FBS and 1% penicillin/streptomycin and maintained at 37oC in an incubator under an atmosphere containing 5% CO2. As previously described [30], the GEM model derived cell lines 634 (krasG12D/wt/p53-/-/lkb1wt/wt) and t2 (krasG12D/wt/p53-/-/lkb1-/-) were cultured in RPMI medium supplemented with 10% FBS and 1% penicillin/streptomycin/glutamine. The cells were routinely screened for the presence of mycoplasma. Cytotoxic effects were determined using the SRB (sulforhodamine B) method as previously described [50]. Briefly, 150μl of cell suspensions containing ~2000 viable cells in logarithmic growth phase were plated into each well of a 96-well flat bottom plate, and incubated overnight before exposure to selumetinib or phenformin or their combination. Cells were prepared in triplicates or quadruplicates. Upon treatment termination, the floating dead cells and their debris were removed and the attached cells were fixed with cold 10% trichloroacetic acid for 30min at 4oC. Cells were then washed with water and stained with 0.4% SRB (Fisher Scientific) for 30 minutes at room temperature, washed again with 1% acetic acid, followed by stain solubilization with 10mM Tris at room temperature on a shaker for 15 minutes. The plates were read on a plate reader (Biotek Synergy MX) using an absorbance wavelength of 565nm, and cell proliferation status was derived from the raw absorbance (OD) data.
In vitro evaluation of the combination effects of selumetinib and phenformin
Synergy was determined for the isogenic cell line A549pBabe and A549LKB1. The cells were exposed for 40 hours to selumetinib at 0, 0.3215, 0.625, 1.25, 2.5, 5, 10 and 20 μM, and phenformin at 0, 10, 20, 40, 80, 160, 320 and 640 μM, in all possible combinations. The results of the combined treatment were analyzed according to the isobolographic method of Chou and Talalay [51] by using the Calcusyn software program (Biosoft). The resulting combination index (CI) was used as a quantitative measure of the degree of interaction between the two drugs. A CI equal to 1 denotes additivity, CI greater than 1 antagonism, and CI value less than 1 indicates synergism [51].
Colony formation assay
As previously described [52], ~200 isogenic A549pBabe and A549LKB1 cells were plated in 6-well plates and incubated with different concentrations of selumetinib and phenformin, as well as their various combinations for 2 weeks. Upon treatment termination, the cell colonies were fixed with glutaraldehyde (6% v/v) and stained with crystal violet (0.5% w/v). Triplicates were performed throughout the studies.
Apoptosis assay
A549pBabe and A549LKB1 cells were treated with either diluted DMSO, selumetinib alone, phenformin alone, or their combination as indicated, and cells were collected after 48 hours by trypsinization, washed with cold × 1 phosphate-buffered saline (PBS), and stained with Annexin V-phycoerythrin (PE) and 7-AAD (BD PharMingen) for 15 minutes at room temperature. The apoptotic population of the samples was then measured using a fluorescence-activated cell sorting (FACS) caliber bench-top flow cytometer (Becton Dickinson). FlowJo software (Tree Star) was used for apoptosis analysis.
Immunoblotting of effector proteins
Depending on the experimental purposes, cells with or without treatment were subjected to immunoblotting through standard Western blot. Briefly, total protein was extracted from cell lysates and concentration determined. ~20 μg protein was subjected to SDS-PAGE, followed by membrane transfer and antibody incubation. Primary antibodies were anti-LKB1 (cat #3047), anti-total and phospho AMPK (cat #2532 and #2535S), anti-total and phospho ERK (cat #9101 and #9102), anti-total and phospho Akt (cat #9271 and #9272), anti-total and phospho S6 (cat #2317 and #4857) from Cell Signaling Technology; anti-Bcl-XL (cat #sc8392) and anti-Bcl-2 (cat #sc509) from Santa Cruz Biotechnology; and anti-β-actin (cat #A5441) from Sigma Aldrich. Secondary HRP conjugated antibodies (anti-mouse, cat # W4021, and anti-rabbit, cat # W4011) were from Promega. The blots were developed using an enhanced chemiluminescence system as described [53].
Assessment of the selumetinib and phenformin combination in vivo
Female athymic nude mice, 4 to 6 weeks old, were used in this study. The animal experimental protocol was approved by the Institutional Animal Care and Use Committees of Emory University. In order to have a direct comparison, ~ 1.5 million A549pBabe and A549LKB1 cells were implanted on the left and right flank of the same nude mice respectively. Once the tumors became palpable, mice were orally gavaged daily with either diluted DMSO (Ctrl), selumetinib (S, 50 mg/kg), phenformin (P, 100 mg/kg) or the combination (S+P), 5 days per week. Phenformin solution was prepared directly in water. Since selumetinib does not dissolve well in water, a few drops of DMSO was added initially to the calculated “master” dose just to achieve a homogenous suspension, and then water was added to make the “master” volume, followed by aliquot preparation for daily use. The volume of DMSO used was < 1%. This suspension was either vortexed or finger-tap mixed each time before being administered via oral gavage. The tumor volume and body weight were measured periodically 2~3 times a week. Tumor volume was calculated using the formula: V = 1/2 * AB2 where A and B are two perpendicular tumor diameters measured by a caliper, and A > = B. Upon sacrifice, tumors were dissected and weighed, followed by tissue fixation, sectioning and immunohistochemistry (IHC). Major organs such as lungs, liver, spleen, kidney etc. were also harvested for toxicity evaluation.
Immunohistochemistry staining and analysis
Xenograft tumor tissues were harvested, and then formalin fixed and paraffin embedded before sectioning. First, the sections were pre-heated at 60 degrees for 30 minutes, passed through a series of xylene and alcohol treatments followed by antigen retrieval using 1× citrate buffer for 10 minutes. The slides were allowed to cool for 30 minutes at room temperature and quenched using 3% hydrogen peroxide in distilled water. The sections were washed and then blocked using 2.5% normal horse serum following the instructions from the Kit (Vectastain Kit, Vector Laboratories). Besides H&E staining, standard IHC was used to compare phospho ERK (cat #4370), S6 (cat #4857), as well as Ki67 (prediluted from Life Technologies).
Statistical analysis
The comparison of mean tumor volume on the growth curve was carried out using one-way ANOVA. The median tumor weights after dissection were compared with nonparametric Kruskal–Wallis test, and presented using Box-and-Whisker plots. For comparison between two groups, student t test was used to compare the means whereas the Mann–Whitney test was used to compare the median. SPSS version 20 was used to conduct these statistical calculations. All P values were two-sided and values less than 0.05 were considered statistically significant.
Abbreviations
The abbreviations used are: AMPK, AMP-activate protein kinase; ERK, extracellular-signal-regulated kinase; GEM, genetically engineered mouse; LKB1, liver kinase B1; MAPK, mitogen-activated protein kinase; MEF, mouse embryonic fibroblast; MEK, MAPK/ERK kinase; MEKi, MAPK/ERK kinase inhibitor; mTOR, mammalian target of rapamycin; NSCLC, non-small cell lung cancer.
Author contributions
Conception and design: J. Zhang, W. Zhou, D.M. Shin Development of methodology: All Acquisition of data (provided animals, acquired and managed patients, provided facilities, etc.): All Analysis and interpretation of data (e.g., statistical analysis, biostatistics, computational analysis): J. Zhang, Z.G. Chen, W. Zhou, D.M. Shin Writing, review, and/or revision of the manuscript: J. Zhang, W. Zhou, D.M. Shin Administrative, technical, or material support (i.e., reporting or organizing data, constructing databases): Fadlo R. Khuri Study supervision: W. Zhou and D.M. Shin. Other [Supply of mouse model]: K. Wong.
ACKNOWLEDGMENTS
We would like to acknowledge Dr. Anthea Hammond for the critical reading and editorial assistance. This work is supported by T32 training grant (1T32CA160040–01A1, J. Zhang, is an awardee; PI: D.M. Shin), R01-CA140571 (W. Zhou), R01-CA203928 (W. Zhou) and P01 CA116676 (F.R. Khuri).
CONFLICTS OF INTEREST
The authors declare no conflicts of interest.
REFERENCES
1. Rodenhuis S, van de Wetering ML, Mooi WJ, Evers SG, van Zandwijk N, Bos JL. Mutational activation of the K-ras oncogene. A possible pathogenetic factor in adenocarcinoma of the lung. N Engl J Med. 1987; 317:929–935.
2. Young A, Lyons J, Miller AL, Phan VT, Alarcón IR, McCormick F. Ras signaling and therapies. Adv Cancer Res. 2009; 102:1–17.
3. Montagut C, Settleman J. Targeting the RAF-MEK-ERK pathway in cancer therapy. Cancer Lett. 2009; 283:125–134.
4. Schubbert S, Shannon K, Bollag G. Hyperactive Ras in developmental disorders and cancer. Nat Rev Cancer. 2007; 7:295–308.
5. Legrier ME, Yang CP, Yan HG, Lopez-Barcons L, Keller SM, Pérez-Soler R, Horwitz SB, McDaid HM. Targeting protein translation in human non small cell lung cancer via combined MEK and mammalian target of rapamycin suppression. Cancer Res. 2007; 67:11300–11308.
6. Engelman JA, Chen L, Tan X, Crosby K, Guimaraes AR, Upadhyay R, Maira M, McNamara K, Perera SA, Song Y, Chirieac LR, Kaur R, Lightbown A, et al. Effective use of PI3K and MEK inhibitors to treat mutant Kras G12D and PIK3CA H1047R murine lung cancers. Nat Med. 2008; 14:1351–1356.
7. Garnett MJ, Edelman EJ, Heidorn SJ, Greenman CD, Dastur A, Lau KW, Greninger P, Thompson IR, Luo X, Soares J, Liu Q, Iorio F, Surdez D, et al. Systematic identification of genomic markers of drug sensitivity in cancer cells. Nature. 2012; 483:570–575.
8. Corcoran RB, Cheng KA, Hata AN, Faber AC, Ebi H, Coffee EM, Greninger P, Brown RD, Godfrey JT, Cohoon TJ, Song Y, Lifshits E, Hung KE, et al. Synthetic lethal interaction of combined BCL-XL and MEK inhibition promotes tumor regressions in KRAS mutant cancer models. Cancer Cell. 2013; 23:121–128.
9. Jänne PA, Shaw AT, Pereira JR, Jeannin G, Vansteenkiste J, Barrios C, Franke FA, Grinsted L, Zazulina V, Smith P, Smith I, Crinò L. Selumetinib plus docetaxel for KRAS-mutant advanced non-small-cell lung cancer: a randomised, multicentre, placebo-controlled, phase 2 study. Lancet Oncol. 2013; 14:38–47.
10. Wee S, Jagani Z, Xiang KX, Loo A, Dorsch M, Yao YM, Sellers WR, Lengauer C, Stegmeier F. PI3K pathway activation mediates resistance to MEK inhibitors in KRAS mutant cancers. Cancer Res. 2009; 69:4286–4293.
11. Chen Z, Cheng K, Walton Z, Wang Y, Ebi H, Shimamura T, Liu Y, Tupper T, Ouyang J, Li J, Gao P, Woo MS, Xu C, et al. A murine lung cancer co-clinical trial identifies genetic modifiers of therapeutic response. Nature. 2012; 483:613–617.
12. Galluzzi L, Kepp O, Vander Heiden MG, Kroemer G. Metabolic targets for cancer therapy. Nat Rev Drug Discov. 2013; 12:829–846.
13. Blandino G, Valerio M, Cioce M, Mori F, Casadei L, Pulito C, Sacconi A, Biagioni F, Cortese G, Galanti S, Manetti C, Citro G, Muti P, et al. Metformin elicits anticancer effects through the sequential modulation of DICER and c-MYC. Nat Commun. 2012; 3:865.
14. Freed-Pastor WA, Mizuno H, Zhao X, Langerød A, Moon SH, Rodriguez-Barrueco R, Barsotti A, Chicas A, Li W, Polotskaia A, Bissell MJ, Osborne TF, Tian B, et al. Mutant p53 disrupts mammary tissue architecture via the mevalonate pathway. Cell. 2012; 148:244–258.
15. Levine AJ, Puzio-Kuter AM. The control of the metabolic switch in cancers by oncogenes and tumor suppressor genes. Science. 2010; 330:1340–1344.
16. Shackelford DB, Abt E, Gerken L, Vasquez DS, Seki A, Leblanc M, Wei L, Fishbein MC, Czernin J, Mischel PS, Shaw RJ. LKB1 inactivation dictates therapeutic response of non-small cell lung cancer to the metabolism drug phenformin. Cancer Cell. 2013; 23:143–158.
17. Appleyard MV, Murray KE, Coates PJ, Wullschleger S, Bray SE, Kernohan NM, Fleming S, Alessi DR, Thompson AM. Phenformin as prophylaxis and therapy in breast cancer xenografts. Br J Cancer. 2012; 106:1117–1122.
18. Rosilio C, Lounnas N, Nebout M, Imbert V, Hagenbeek T, Spits H, Asnafi V, Pontier-Bres R, Reverso J, Michiels JF, Sahra IB, Bost F, Peyron JF. The metabolic perturbators metformin, phenformin and AICAR interfere with the growth and survival of murine PTEN-deficient T cell lymphomas and human T-ALL/T-LL cancer cells. Cancer Lett. 2013; 336:114–126.
19. Orecchioni S, Reggiani F, Talarico G, Mancuso P, Calleri A, Gregato G, Labanca V, Noonan DM, Dallaglio K, Albini A, Bertolini F. The biguanides metformin and phenformin inhibit angiogenesis, local and metastatic growth of breast cancer by targeting both neoplastic and microenvironment cells. Int J Cancer. 2015; 136:E534–544.
20. Wang J, Xia S, Zhu Z. Synergistic effect of phenformin in non-small cell lung cancer (NSCLC) ionizing radiation treatment. Cell Biochem Biophys. 2015; 71:513–518.
21. Yuan P, Ito K, Perez-Lorenzo R, Del Guzzo C, Lee JH, Shen CH, Bosenberg MW, McMahon M, Cantley LC, Zheng B. Phenformin enhances the therapeutic benefit of BRAF(V600E) inhibition in melanoma. Proc Natl Acad Sci USA. 2013; 110:18226–18231.
22. Ji H, Ramsey MR, Hayes DN, Fan C, McNamara K, Kozlowski P, Torrice C, Wu MC, Shimamura T, Perera SA, Liang MC, Cai D, Naumov GN, et al. LKB1 modulates lung cancer differentiation and metastasis. Nature. 2007; 448:807–810.
23. Shackelford DB, Shaw RJ. The LKB1-AMPK pathway: metabolism and growth control in tumour suppression. Nat Rev Cancer. 2009; 9:563–575.
24. Zhou W, Zhang J, Marcus AI. LKB1 Tumor Suppressor: Therapeutic Opportunities Knock when LKB1 Is Inactivated. Genes Dis. 2014; 1:64–74.
25. Zhang WC, Shyh-Chang N, Yang H, Rai A, Umashankar S, Ma S, Soh BS, Sun LL, Tai BC, Nga ME, Bhakoo KK, Jayapal SR, Nichane M, et al. Glycine decarboxylase activity drives non-small cell lung cancer tumor-initiating cells and tumorigenesis. Cell. 2012; 148:259–272.
26. Pelicano H, Martin DS, Xu RH, Huang P. Glycolysis inhibition for anticancer treatment. Oncogene. 2006; 25:4633–4646.
27. Bunyaviroch T, Coleman RE. PET evaluation of lung cancer. J Nucl Med. 2006; 47:451–469.
28. Zheng B, Jeong JH, Asara JM, Yuan YY, Granter SR, Chin L, Cantley LC. Oncogenic B-RAF negatively regulates the tumor suppressor LKB1 to promote melanoma cell proliferation. Mol Cell. 2009; 33:237–247.
29. Ma XM, Blenis J. Molecular mechanisms of mTOR-mediated translational control. Nat Rev Mol Cell Bio. 2009; 10:307–318.
30. Liu Y, Marks K, Cowley GS, Carretero J, Liu Q, Nieland TJ, Xu C, Cohoon TJ, Gao P, Zhang Y, Chen Z, Altabef AB, Tchaicha JH, et al. Metabolic and functional genomic studies identify deoxythymidylate kinase as a target in LKB1-mutant lung cancer. Cancer Discov. 2013; 3:870–879.
31. Karczmarek-Borowska B, Filip A, Wojcierowski J, Smoleń A, Korobowicz E, Korszen-Pilecka I, Zdunek M. Estimation of prognostic value of Bcl-xL gene expression in non-small cell lung cancer. Lung Cancer. 2006; 51:61–69.
32. Laudanski J, Chyczewski L, Niklińska WE, Kretowska M, Furman M, Sawicki B, Nikliński J. Expression of bcl-2 protein in non-small cell lung cancer: correlation with clinicopathology and patient survival. Neoplasma. 1999; 46:25–30.
33. Kaufman JM, Amann JM, Park K, Arasada RR, Li H, Shyr Y, Carbone DP. LKB1 Loss induces characteristic patterns of gene expression in human tumors associated with NRF2 activation and attenuation of PI3K-AKT. J Thorac Oncol. 2014; 9:794–804.
34. Vaahtomeri K, Mäkelä TP. Molecular mechanisms of tumor suppression by LKB1. FEBS Lett. 2011; 585:944–951.
35. Zhong D, Liu X, Khuri FR, Sun SY, Vertino PM, Zhou W. LKB1 is necessary for Akt-mediated phosphorylation of proapoptotic proteins. Cancer Res. 2008; 68:7270–7277.
36. Graves EE, Vilalta M, Cecic IK, Erler JT, Tran PT, Felsher D, Sayles L, Sweet-Cordero A, Le QT, Giaccia AJ. Hypoxia in models of lung cancer: implications for targeted therapeutics. Clin Cancer Res. 2010; 16:4843–4852.
37. Della Corte CM, Ciaramella V, Di Mauro C, Castellone MD, Papaccio F, Fasano M, Sasso FC, Martinelli E, Troiani T, De Vita F, Orditura M, Bianco R, Ciardiello F, et al. Metformin increases antitumor activity of MEK inhibitors through GLI1 downregulation in LKB1 positive human NSCLC cancer cells. Oncotarget. 2016; 7:4265–4278. http://doi.org/10.18632/oncotarget.6559.
38. Kalender A, Selvaraj A, Kim SY, Gulati P, Brûlé S, Viollet B, Kemp BE, Bardeesy N, Dennis P, Schlager JJ, Marette A, Kozma SC, Thomas G. Metformin, independent of AMPK, inhibits mTORC1 in a rag GTPase-dependent manner. Cell Metab. 2010; 11:390–401.
39. Grad JM, Zeng XR, Boise LH. Regulation of Bcl-xL: a little bit of this and a little bit of STAT. Curr Opin Oncol. 2000; 12:543–549.
40. Tranquada RE, Bernstein S, Martin HE. Irreversible lactic acidosis associated with phenformine therapy. Report of three cases. JAMA. 1963; 184:37–42.
41. Misbin RI. Phenformin-associated lactic acidosis: pathogenesis and treatment. Ann Intern Med. 1977; 87:591–595.
42. Dykens JA, Jamieson J, Marroquin L, Nadanaciva S, Billis PA, Will Y. Biguanide-induced mitochondrial dysfunction yields increased lactate production and cytotoxicity of aerobically-poised HepG2 cells and human hepatocytes in vitro. Toxicol Appl Pharmacol. 2008; 233:203–210.
43. Shu Y, Sheardown SA, Brown C, Owen RP, Zhang S, Castro RA, Ianculescu AG, Yue L, Lo JC, Burchard EG, Brett CM, Giacomini KM. Effect of genetic variation in the organic cation transporter 1 (OCT1) on metformin action. J Clin Inv. 2007; 117:1422–1431.
44. Song CW, Lee H, Dings RP, Williams B, Powers J, Santos TD, Choi BH, Park HJ. Metformin kills and radiosensitizes cancer cells and preferentially kills cancer stem cells. Sci Rep. 2012; 2:362.
45. Iglesias DA, Yates MS, van der Hoeven D, Rodkey TL, Zhang Q, Co NN, Burzawa J, Chigurupati S, Celestino J, Bowser J, Broaddus R, Hancock JF, Schmandt R, et al. Another surprise from Metformin: novel mechanism of action via K-Ras influences endometrial cancer response to therapy. Mol Cancer Ther. 2013; 12:2847–2856.
46. Vujic I, Sanlorenzo M, Posch C, Esteve-Puig R, Yen AJ, Kwong A, Tsumura A, Murphy R, Rappersberger K, Ortiz-Urda S. Metformin and trametinib have synergistic effects on cell viability and tumor growth in NRAS mutant cancer. Oncotarget. 2015; 6:969–978. http://doi.org/10.18632/oncotarget.2824.
47. Troiani T, Vecchione L, Martinelli E, Capasso A, Costantino S, Ciuffreda LP, Morgillo F, Vitagliano D, D’Aiuto E, De Palma R, Tejpar S, Van Cutsem E, De Lorenzi M, et al. Intrinsic resistance to selumetinib, a selective inhibitor of MEK1/2, by cAMP-dependent protein kinase A activation in human lung and colorectal cancer cells. Br J Cancer. 2012; 106:1648–1659.
48. Zhong D, Guo L, de Aguirre I, Liu X, Lamb N, Sun SY, Gal AA, Vertino PM, Zhou W. LKB1 mutation in large cell carcinoma of the lung. Lung Cancer. 2006; 53:285–294.
49. Liu F, Jin R, Liu X, Huang H, Wilkinson SC, Zhong D, Khuri FR, Fu H, Marcus A, He Y, Zhou W. LKB1 promotes cell survival by modulating TIF-IA-mediated pre-ribosomal RNA synthesis under uridine downregulated conditions. Oncotarget. 2016; 7:2519–2531. http://doi.org/10.18632/oncotarget.6224.
50. Vichai V, Kirtikara K. Sulforhodamine B colorimetric assay for cytotoxicity screening. Nat Protoc. 2006; 1:1112–1116.
51. Chou TC. Drug combination studies and their synergy quantification using the Chou-Talalay method. Cancer Res. 2010; 70:440–446.
52. Franken NA, Rodermond HM, Stap J, Haveman J, van Bree C. Clonogenic assay of cells in vitro. Nat Protoc. 2006; 1:2315–2319.
53. Jiang N, Wang D, Hu Z, Shin HJ, Qian G, Rahman MA, Zhang H, Amin AR, Nannapaneni S, Wang X, Chen Z, Garcia G, MacBeath G, et al. Combination of anti-HER3 antibody MM-121/SAR256212 and cetuximab inhibits tumor growth in preclinical models of head and neck squamous cell carcinoma. Mol Cancer Ther. 2014; 13:1826–1836.