
INTRODUCTION
Papillary thyroid cancer (PTC) is the most common type which accounts for 85% to 90% of all thyroid cancers [1-5]. In general, PTC is an indolent cancer with a high curability, but a subgroup of PTCs maintain aggressive feature with a poor prognosis [6, 7]. Risk stratifications would be of great value to improve the management of PTC.
Lymph node metastasis (LNM) is an indicator of PTC recurrence and is directly related to the extent of thyroid cancer surgery [8-11]. Reoperation will bring economic burden and high incidence of complication to patients. Radioiodine (RAI) therapy may be not effective in cases that do not have adequate radioiodine uptake (131I-refractory) or have 18-fluorodeoxyglucose positron emission tomography (18FDG-PET) positive metastases [11]. Preoperative 18FDG-PET scanning is not routinely recommended [12]. Ultrasound (US) is a valuable tool for thyroid cancer screening as well as LNM detection [12-16]. However, due to its low sensitivity in the central neck, the role of US in surgical planning for central compartment neck dissection in PTC is constrained [15, 17, 18]. So is computed tomography (CT) [17]. Therefore, it is pivotal to find out an effective molecular marker to assist in LNM prediction, especially in cN0 patients if such data would be expected to alter initial surgical decision making and achieve personalized treatment..
In recent years, studies of microRNAs (miRNAs) as potential biomarkers for diagnosis, prognosis, or therapeutic targets of cancer have drawn great attention [19, 20]. As one of the gene expression regulators, miRNAs are found to negatively modulate gene expression by targeting the 3’ untranslated region of mRNAs in a sequence-specific manner, and are involved in diverse biological processes [21-23]. Among them, miR-324-5p has been proven to be involved in the growth, invasion, and migration of different kinds of cancer [24-28]. However, its role in LNM of PTC remains unknown. Fine needle aspiration (FNA) is a high cost-effective method in PTC assessment [29-31]. It has been reported that detection of miRNA or BRAF mutation in FNA washout is helpful in estimating the character or invasiveness of thyroid nodules [32, 33]. Hence, the study aimed to investigate the role of miR-324-5p in PTC and the value of FNA-miR-324-5p together with ultrasonography in predicting LNM of PTC.
RESULTS
Clinicopathological characteristics of PTC subjects
The clinicopathological characteristics of 41 PTC tissues and 143 FNA samples are summarized in Tables 1 and 2. All the subjects were divided into two groups according to the pathologic findings: LNM (-) and LNM (+). None of the cases presented with distant metastasis. As shown in Table 2, in LNM (+) group, there were more patients with young age, multi-foci, extracapsular spread (ECS) and advanced TNM stage (III/IV) compared to LNM (-) group.
Table 1: Clinicopathological characteristics of PTC tissues
Total |
LNM (-) |
LNM (+) |
P value |
|
|---|---|---|---|---|
Sex (n,%) |
||||
Male |
8 (19.5%) |
3 |
5 |
0.992 |
Female |
33 (80.5%) |
15 |
18 |
|
Age (y) |
46.27±10.86 |
47.00±9.17 |
45.70±12.19 |
0.708 |
<45 y (n,%) |
18 (43.9%) |
9 |
9 |
0.486 |
≥45 y (n,%) |
23 (56.1%) |
9 |
14 |
|
Size (mm) * |
12.0 (7.5-15.0) |
9.5 (6.8-15.8) |
12.0 (8.0-15.0) |
0.342 |
Folcality (n,%) |
||||
Unifocal |
25 (61.0%) |
13 |
12 |
0.192 |
Multifocal |
16 (39.0%) |
5 |
11 |
|
ECS (n,%) |
||||
No |
29 (70.7%) |
14 |
15 |
0.380 |
Yes |
12 (29.3%) |
4 |
8 |
|
TNM stage (n,%) |
||||
I-II stage |
25 (61.0%) |
15 |
10 |
0.009 |
III-IV stage |
16 (39.0%) |
3 |
13 |
* Quartile for non-normal distribution data. ECS: extracapsular spread.
Table 2: Clinicopathological characteristics of FNA samples
Total |
LNM (-) |
LNM (+) |
P value |
|
|---|---|---|---|---|
Sex (n,%) |
||||
Male |
33 (23.1%) |
17 (20.2%) |
16 (27.1%) |
0.336 |
Female |
110 (76.9%) |
67 (79.8%) |
43 (72.9%) |
|
Age (y) * |
40 (34-51) |
43 (35-54) |
37 (30-47) |
0.003 |
<45 y (n,%) |
82 (57.3%) |
45 (53.6%) |
37 (62.7%) |
0.277 |
≥45 y (n,%) |
61 (42.7%) |
39 (46.4%) |
22 (37.3%) |
|
Folcality (n,%) |
0.010 |
|||
Unifocal |
108 (75.5%) |
70 (83.3%) |
38 (64.4%) |
|
Multifocal |
35 (24.5%) |
14 (16.7%) |
21 (35.6%) |
|
ECS (n,%) a |
0.030 |
|||
No |
120 (85.1%) |
76 (90.5%) |
44 (77.2%) |
|
Yes |
21 (14.9%) |
8 (9.5%) |
13 (22.8%) |
|
TNM stage (n,%) |
<0.001 |
|||
I-II stage |
118 (82.5%) |
81 (96.4%) |
37 (62.7%) |
|
III-IV stage |
25 (17.5%) |
3 (3.6%) |
22 (37.3%) |
* Quartile for non-normal distribution data. a Two cases of Tx. FNA: fine needle aspiration; ECS: extracapsular spread.
Sonographic characteristics of FNA samples
All the FNA nodules were markedly hypoechoic or hypoechoic with solid or mostly solid architecture. Nodules with LNM were more likely to be located throughout the internal and external of thyroid lobe than those without LNM (16.1% vs.3.6%, P=0.023). The median of greatest dimension was 7.5mm (range 2.4-44mm) and PTMC made up for 65.7%. As summaried in Table 3, nodule size in LNM (-) group was smaller compared to LNM (+) group and LNM (-) group contained more PTMC (P<0.001). A/T≥1, microcalcification, ultrasound suspected LNM (US-LNM) was significantly correlated with LNM. However, no significant associations were observed between A/L≥1, border, amount of color Doppler signals and LNM.
Table 3: Sonographic characteristics of FNA samples
Total |
LNM (-) |
LNM (+) |
P value |
|
|---|---|---|---|---|
Greatest dimension (mm) * |
7.5 (5.2-12.4) |
6.5 (4.7-8.3) |
12.1 (6.6-17.0) |
<0.001 |
L (mm) *a |
7.0 (5.0-11.8) |
6.0 (4.4-8.3) |
11.3 (6.2-17.0) |
<0.001 |
A (mm) * |
6.3 (4.6-9.4) |
5.4 (4.4-7.0) |
8.3 (5.2-12.0) |
<0.001 |
T (mm) *b |
6.4 (4.6-10.3) |
5.4 (4.1-7.4) |
9.5 (5.9-14.2) |
<0.001 |
A/L≥1 (n,%) a |
0.167 |
|||
Yes |
46 (32.4%) |
31 (36.9%) |
15 (25.9%) |
|
No |
96 (67.6%) |
53 (63.1%) |
43 (74.1%) |
|
A/T≥1 (n,%) b |
0.010 |
|||
Yes |
70 (49.3%) |
49 (58.3%) |
21 (36.2%) |
|
No |
72 (50.7%) |
35 (41.7%) |
37 (63.8%) |
|
PTMC (n,%) |
<0.001 |
|||
Yes |
94 (65.7%) |
70 (83.3%) |
24 (40.7%) |
|
No |
49 (34.3%) |
14 (16.7%) |
35 (59.3%) |
|
Microcalcification (n,%) |
0.040 |
|||
Yes |
80 (55.9%) |
41 (48.8%) |
39 (66.1%) |
|
No |
63 (44.1%) |
43 (51.2%) |
20 (33.9%) |
|
Margin (n,%) |
0.630 |
|||
Regular |
7 (4.9%) |
3 (3.6%) |
4 (6.8%) |
|
Irregular |
136 (95.1%) |
81 (96.4%) |
55 (93.2%) |
|
Color Doppler signal (n,%) |
0.209 |
|||
None/low |
98 (68.5%) |
61 (72.6%) |
37 (62.7%) |
|
Medium/high |
45 (31.5%) |
23 (27.4%) |
22 (37.3%) |
|
US-LNM (n,%) |
<0.001 |
|||
Yes |
24 (16.8%) |
6 (7.1%) |
18 (30.5%) |
|
No |
119 (83.2%) |
78 (92.9%) |
41 (69.5%) |
* Quartile for non-normal distribution data. a One nodule adjacent to the isthmus was not quoted. b One nodule in the isthmus was not quoted. A: anteroposterior diameter; L: longitudinal diameter; T: transverse diameter; US-LNM: ultrasound suspected LNM.
Clinicopathological and sonographic factors associated with LNM
Univariate analysis illuminated that increased age, A/T≥1, PTMC were protective factors of LNM. Multi-foci, ECS, advanced stage, location throughout the internal and external of thyroid lobe, increased dimension, microcalcification, US-LNM were risk factors of LNM. Multivariate logistic regression demonstrated that increased age was an independent protective factor of LNM. Multi-foci, increased transverse diameter, advanced stage and US-LNM were independent risk factors of LNM (Table 4).
Table 4: Uni- and multi-variate regression analysis of factors associated with LNM
Variate |
Univariate analysis |
Multivariate analysis |
||
|---|---|---|---|---|
OR (95% CI) |
P value |
OR (95% CI) |
P value |
|
Age (y) |
0.952 (0.921-0.984) |
0.003 |
0.850 (0.780-0.926) |
<0.001 |
Multifocality |
2.763 (1.263-6.047) |
0.011 |
6.394 (1.778-22.993) |
0.004 |
ECS |
2.807 (1.079-7.300) |
0.034 |
||
III-IV stage |
16.054 (4.520-57.019) |
<0.001 |
186.914 (23.125-1510.767) |
<0.001 |
Location* |
5.170 (1.333-20.047) |
0.017 |
||
Greatest dimension (mm) |
1.218 (1.117-1.327) |
<0.001 |
||
L (mm) |
1.213 (1.113-1.321) |
<0.001 |
||
A (mm) |
1.296 (1.154-1.457) |
<0.001 |
||
T (mm) |
1.274 (1.148-1.413) |
<0.001 |
1.245 (1.090-1.423) |
0.001 |
A/T≥1 |
0.405 (0.204-0.808) |
0.010 |
||
PTMC |
0.137 (0.063-0.297) |
<0.001 |
||
microcalcification |
2.045 (1.028-4.070) |
0.042 |
||
US-LNM |
5.707 (2.103-15.488) |
0.001 |
7.142 (1.583-32.219) |
0.011 |
* Located throughout the internal and external of thyroid lobe. ECS: extracapsular spread ; A: anteroposterior diameter; L: longitudinal diameter; T: transverse diameter; US-LNM: ultrasound suspected LNM; OR : odds ratio; CI : confidence interval.
The expression of miR-324-5p in PTC subjects and cell line
As depicted in Figure 1A, miR-324-5p was significantly overexpressed in group LNM (+) compared with group LNM (-) [1.50 (0.69-2.87) vs. 0.61 (0.34-1.72), p=0.026] in 41 PTC tissues. The expression of miR-324-5p was significantly lower in KTC1 cell line than in control (PTC without LNM) (1.000±0.027 vs. 0.027±0.001, P<0.001) (Figure 1B).
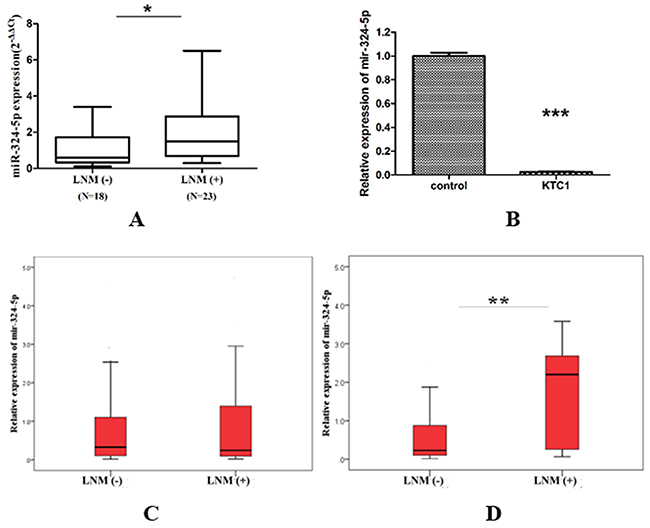
Figure 1: Relative expression of miR-324-5p in PTC subjects and cell line. (A) PTC tissues (41 cases). Data are represented as quartile. *p<0.05. (B) KTC1 cell line. Data are expressed as means ± SD. ***P<0.001. (C) Total FNA washout specimens (143 cases). Data are represented as quartile. (D) FNA washout of unifocal PTMC without ECS (66 cases). Data are represented as quartile. **p<0.01.
As denoted in Figure 1C, the expression of miR-324-5p was not significantly different between LNM (-) group and LNM (+) group in 143 FNA samples. However, among 66 unifocal PTMC without ECS, miR-324-5p was overexpressed in LNM (+) group compared with LNM (-) group [2.20 (0.23-2.81) vs. 0.23 (0.10-0.90) P=0.009] (Figure 1D).
Characteristics and LNM prediction of unifocal PTMC without ECS
In the light of the pathologic finding, unifocal PTMC without ECS were divided into LNM (-) group (n=54) and LNM (+) group (n=12) (Table 5). Advanced TNM stage and higher miR-324-5p level were correlated with LNM.
Table 5: Characteristics of unifocal PTMC without ECS
LNM (-) |
LNM (+) |
P value |
|
|---|---|---|---|
Gender (n,%) |
0.304 |
||
Male |
12 (22.2%) |
5 (41.7%) |
|
Female |
42 (77.8%) |
7 (58.3%) |
|
Age (y)* |
42 (35-54) |
36 (30-46) |
0.074 |
TNM stage (n,%) |
0.001a |
||
I-II stage |
54 (100.0%) |
8 (66.7%) |
|
III-IV stage |
0 (0.0%) |
4 (33.3%) |
|
Greatest dimension (mm) |
6.0±1.9 |
6.7±1.8 |
0.236 |
L (mm) |
5.6±1.9 |
6.6±1.8 |
0.093 |
A (mm) |
5.1±1.4 |
5.5±1.3 |
0.328 |
T (mm) |
5.0±1.6 |
5.7±1.4 |
0.163 |
A/L≥1 (n,%) |
0.492 |
||
Yes |
22 (40.7%) |
3 (25.0%) |
|
No |
32 (59.3%) |
9 (75.0%) |
|
A/T≥1 (n,%) |
0.701 |
||
Yes |
33 (61.1%) |
6 (50.0%) |
|
No |
21 (38.9%) |
6 (50.0%) |
|
Microcalcification (n,%) |
0.322 |
||
Yes |
23 (42.6%) |
7 (58.3%) |
|
No |
31 (57.4%) |
5 (41.7%) |
|
US-LNM (n,%) |
0.203 |
||
Yes |
4 (7.4%) |
3 (25.0%) |
|
No |
50 (92.6%) |
9 (75.0%) |
|
MiR324-5p expression |
<0.001 |
||
<2.01 |
51 (94.4%) |
5 (41.7%) |
|
>2.01 |
3 (5.6%) |
7 (58.3%) |
* Quartile for non-normal distribution data. a Fisher’s exact test. ECS: extracapsular spread; A: anteroposterior diameter; L: longitudinal diameter; T: transverse diameter; US-LNM: ultrasound suspected LNM.
Receiver operator characteristic (ROC) curve analysis was performed in these particular subjects, area under the curve (AUC) of miR-324-5p to distinguish LNM was 0.744 (95%CI: 0.571-0.917) (Figure 2). The optimal cut-off value was 2.01. The corresponding sensitivity, specificity, PPV and NPV was 58.33%, 94.44%, 70.00% and 91.07%, which was all higher than that of US-LNM (Table 6). Nine LNM cases missed diagnosed by ultrasound were all central LNM. Among six of them, miR-324-5p relative expression was >2.01. Subgroup ‘US-LNM or miR-324-5p>2.01’ harboured the highest sensitivity of 75.00% in predicting LNM of PTC.
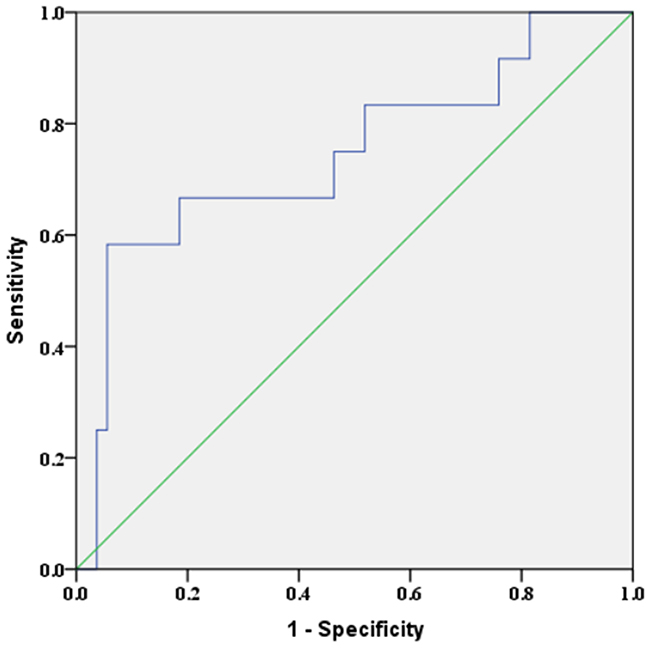
Figure 2: ROC curve of miR-324-5p for distinguishing LNM in unifocal PTMC without ECS. AUC=0.744 (95%CI: 0.571-0.917), p=0.009.
Table 6: Diagnostic value of miR-324-5p and US-LNM in LNM prediction of unifocal PTMC without ECS
Sensitivity |
Specificity |
PPV |
NPV |
Accuracy |
|
|---|---|---|---|---|---|
MiR-324-5p>2.01 |
58.33% |
94.44% |
70.00% |
91.07% |
87.88% |
US-LNM |
25.00% |
92.59% |
42.86% |
84.75% |
80.30% |
US-LNM or miR-324-5p>2.01 |
75.00% |
87.04% |
56.25% |
94.00% |
84.85% |
US-LNM: ultrasound suspected LNM; ECS: extracapsular spread; NPV: negative predictive value; PPV : positive predictive value.
MiR-324-5p promotes the proliferation and inhibits the apoptosis of KTC1 cells
KTC1 was transfected with miR-324-5p mimic, miR-324-5p mimic scramble (mimic NC), miR-324-5p inhibitor, miR-324-5p inhibitor scramble (inhibitor NC) and mock-vehicle. Then we utilized CCK8 analysis and colony formation assay to evaluate the effect of miR-324-5p on cell proliferation. As shown in Figure 3A, 3B, miR-324-5p upregulation significantly induced cell viability at 48h, 72h, and 96h, while miR-324-5p downregulation significantly inhibited cell viability at 48h, 72h, and 96h. Corresponding to that, colony formation assay indicated that there were more colonies in miR-324-5p mimic group compared with inhibitor group and control group (Figure 3C).
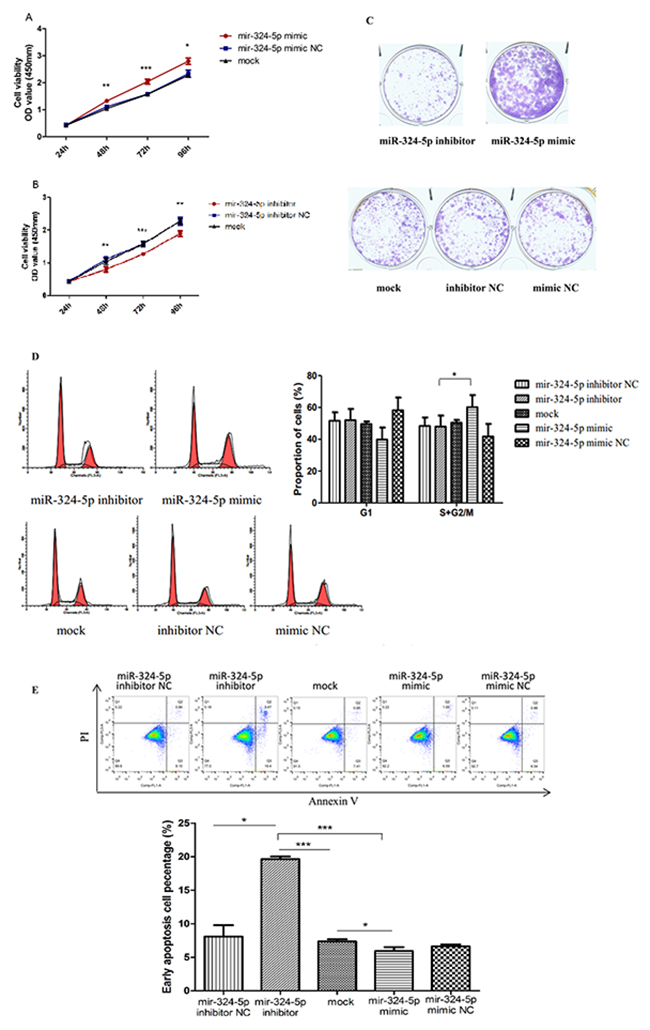
Figure 3: MiR-324-5p promoted proliferation and inhibited apoptosis of KTC1 cells. (A-B) Cell proliferation assay in KTC1 transfected with miR-324-5p mimic (A) and inhibitor (B). (C) Colony formation assay of KTC1 transfected with miR-324-5p inhibitor, mimic, mock, inhibitor NC and mimic NC(×100). (D) Cell cycle of KTC1 transfected with miR-324-5p inhibitor, mimic, mock, inhibitor NC and mimic NC. (E) Apoptosis assay of KTC1 transfected with miR-324-5p inhibitor, mimic, mock, inhibitor NC and mimic NC. Data are expressed as means ± SD of three independent experiments. *p<0.05, **p<0.01, ***P<0.001.
Cell cycle analysis revealed that the proliferation index (i.e.: the proportion of cells in the S+G2/M phase) was significantly higher in mimic group than in inhibitor group, while the proportion of cells in the G1 phase had no statistical difference among five groups (Figure 3D).
Apoptosis assay indicated that miR-324-5p upregulation inhibited apoptosis, while miR-324-5p downregulation enhanced apoptosis in KTC1. (Figure 3E).
Taken these results together, miR-324-5p was capable of promoting KTC1 cell proliferation by increasing proliferation index and suppressing apoptosis.
MiR-324-5p promotes the invasiveness and migration of KTC1 cells
Transwell invasion assay showed that the invading cells were significantly fewer in miR-324-5p inhibitor group (125.33 ± 12.42) than in miR-324-5p mimic group (372.33 ± 52.27) as well as in miR-324-5p inhibitor NC and mock-vehicle group (Figure 4A).
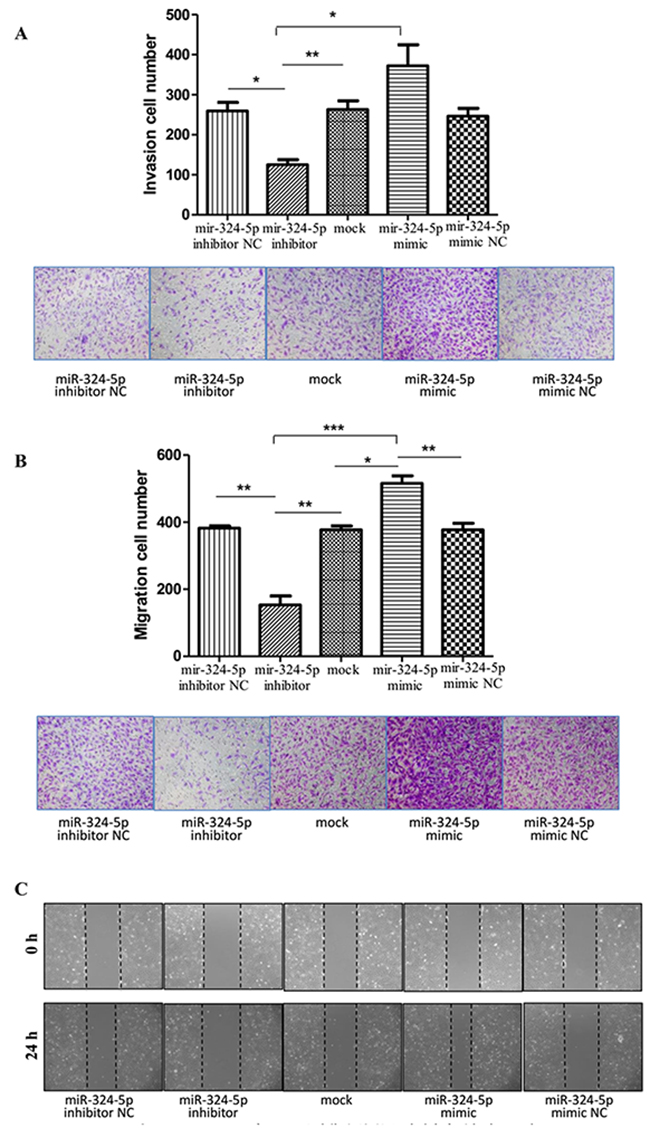
Figure 4: MiR-324-5p promoted invasiveness and migration of KTC1 cells. (A) Transwell invasion assay of KTC1 transfected with miR-324-5p inhibitor, mimic, mock, inhibitor NC and mimic NC (×100). (B) Transwell migration assay of KTC1 transfected with miR-324-5p inhibitor, mimic, mock, inhibitor NC and mimic NC (×100). (C) Wound healing assay of KTC1 transfected with miR-324-5p inhibitor, mimic, mock, inhibitor NC and mimic NC (×100). Data are expressed as means ± SD of three independent experiments. *p<0.05, **p<0.01, ***P<0.001.
According to the transwell migration assay, the number of cells that migrated through the chamber was significantly higher in miR-324-5p mimic group (515.67 ± 22.81) than in miR-324-5p inhibitor group (153.33 ± 26.31) as well as in miR-324-5p mimic NC and mock-vehicle group (Figure 4B). The similar trend was observed in the scratch assay (Figure 4C).
Data above indicated that miR-324-5p promoted invasiveness and migration of KTC1 cells.
DISCUSSION
US-LNM was an independent risk factor of LNM. However, the sensitivity of US detected LNM in unifocal PTMC without ECS was only 25.00%. The results emphasize the necessity of a specific marker complementary to US. Among these particular subjects, miR-324-5p was overexpressed in LNM (+) group and the diagnostic value of miR-324-5p>2.01 was all higher than that of US-LNM. The sensitivity reached the highest of 75.00% when miR-324-5p>2.01 and ultrasonography were combined for LNM prediction. Moreover, LNM cases missed diagnosed by US were all in central compartment. MiR-324-5p levels in two thirds of those cases were higher than the critical value 2.01. Furthermore, factors which can be obtained preoperatively were not correlated with LNM of unifocal PTMC without ECS, except for miR-324-5p. In vitro functional assay also elucidates that miR-324-5p promotes proliferation, migration and invasiveness of PTC cells and inhibits apoptosis as well. Thus, we regard miR-324-5p as a potential biomarker that assists ultrasonography in LNM, especially central LNM prediction in unifocal PTMC without ECS.
Features such as age, sex multifocality, size and location have been reported to be highly associated with LNM in cN0 patients [34]. In our study, these clinical features were significantly associated with LNM by univariate analysis except for sex. Age was an independent protective factor of LNM, indicating that younger patients are prone to LNM, which is in line with the other studies [18, 35-39]. Increased transverse diameter was an independent risk factor of LNM. The proportion of nodules of A/T<1 was significantly higher in LNM (+) group. So was the proportion of nodules located throughout the internal and external of thyroid lobe. These results hint that LNM is more common in nodules with lateral growth, which is consistent with Xu’s results [35, 40]. Current study didn’t show any correlation between amount of color Doppler signals and LNM. This might be because it is hard to detect color Doppler signals in PTMC, which accounted for 65.7% of the total PTC in this study.
ECS was a risk factor of LNM. Multifocality and advanced stage were independent risk factors of LNM. These demonstrate that PTC with LNM is more aggressive. Even in unifocal PTMC without ECS, there were still four advanced stage patients. Therefore, LNM assessment is still necessary for them. Ultrasound-guided percutaneous laser or radiofrequency ablation has come up to the clinical arena in low risk PTC treatment [41, 42]. LNM prediction guarantees the indication of such minimally invasive strategy. According to our finding, we propose that PTC patients with larger multifocal nodules or US-LNM should consider surgery. Unifocal intrathyroidal PTMC should test miR-324–5p expression in FNA washout for LNM assessment. If the expression level is higher than 2.01, surgery is recommended. Otherwise, percutaneous laser or radiofrequency ablation or following up could be considered (Figure 5).
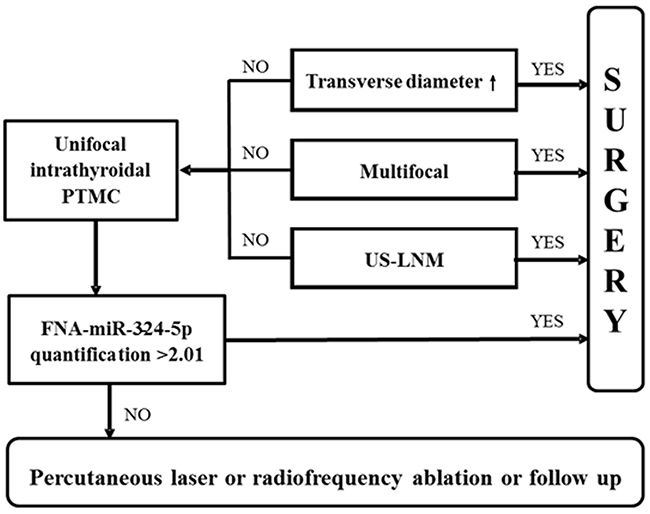
Figure 5: LNM assessment flow chart in PTC.
There are some limitations to this study. This study was based on a retrospective design, and selection bias may have existed, although the US images and samples were recorded and collected prospectively. Also, the central compartment was routinely dissected, but the lateral compartment was dissected only when a LN suspicious for metastasis was detected on preoperative US. LNs that were not dissected and did not show suspicious features on US were assumed to be nonmetastatic. Moreover, this study did not include long-term follow-up. A large scale study with a prospective design and long-term follow-up is needed. The mechanism of how miR-324-5p regulates growth and metastasis in PTC also needs to be elucidated
To sum up, miR-324-5p, which is associated with LNM in PTC, promotes proliferation, migration and invasion of PTC cell. The sensitivity is highly increased when miR-324-5p is complemented with US in LNM prediction of unifocal PTMC without ECS. FNA-miR-324-5p could serve as a valuable auxiliary predictor in LNM, especially central LNM assessment of unifocal intrathyroidal PTMC.
MATERIALS AND METHODS
Patient selection and study design
This study was approved by the Medical Ethics Committee of Rui Jin Hospital, Shanghai, China, and all the work was conducted in accordance with the Declaration of Helsinki. All subjects provided written informed consent before surgery or FNA.
Adult patients undergoing thyroidectomy and node dissection and proven to be PTC pathologically were included in the study. Exclusion criteria were: 1. failing in miR-324-5p detection; 2. history of other malignancy; 3. history of head or neck radiation exposure in childhood; 4. history of thyroidectomy or I131 treatment; 5. pregnancy; 6. incomplete clinical-pathological and sonographic data.
A tentative study of 41 PTC tissues was conducted to explore the expression level of miR-324-5p between LNM (-) and LNM (+) group. Intraoperative PTC tissues were collected from inpatients at the Department of Surgery from July 2015 to July 2016. After that, miR-324-5p was further detected in 143 FNA washout specimens to assess its preoperative clinical utility. FNA washout specimens were collected from outpatients undergoing ultrasound-guided FNA (US-FNA) at the Department of Ultrasound from December 2016 to January 2017.
Pathological diagnosis was adopted as the reference standard for the verification of PTC and LNM. Disease staging was performed according to the seventh edition of American Joint Committee on Cancer (AJCC) TNM system [12]. ECS was defined as capsular invasion or extrathyroidal extension. Multifocality was defined as pathological finding of two or more PTC nodules.
Total RNA extraction and RT-qPCR
Total RNA was extracted using TRIZOL Reagent (#15596-026, Invitrogen) according to the manufacture’s protocol. For the detection of mature miRNA, miRNA was tailed and reverse transcribed using miRcute miRNA First-Strand cDNA Synthesis Kit (# KR201, TIANGEN), followed by qRT-PCR with SYBR Green chemistry using miRcute miRNA qPCR detection kit (#FP401, TIANGEN). Real-time PCR was performed in triplicate in a 384-well optical plate on the ABI ViiA™7 Sequence Detection System. The reactions were incubated at 94°C for 2 min, followed by 40 cycles of 94°C for 20 sec and 60°C for 34 sec. Analysis of relative miRNA expression data was performed using the 2-ΔΔCt method [43] with the U6 small nuclear RNA as an endogenous control. Results were expressed as the amount of miR-324-5p normalized to U6 and relative to a calibrator (one LNM (-) PTC sample). The universal reversal primer was contained in the qPCR detection kit (#FP401, TIANGEN). The specific forward primers of miR-324-5p and U6 were purchased from Guangzhou RiboBio Co., Ltd. (Table 7).
Table 7: The sequences of miR-324-5p and U6 primer, and miR-324-5p mimics or inhibitors and their control oligonucleotides
Sequence |
|
|---|---|
hsa-miR-324-5p (forward) |
5’-CGCATCCCCTAGGGCATTG-3’ |
U6 (forward) |
5’-GCGCGTCGTGAAGCGTTC-3’ |
hsa-miR-324-5p mimic |
Sense: 5’-CGCAUCCCCUAGGGCAUUGGUGU-3’ |
Antisense: 5’-ACCAAUGCCCUAGGGGAUGCGUU-3’ |
|
hsa-miR-324-5p mimic NC |
Sense: 5’-UUCUCCGAACGUGUCACGUTT-3’ |
Antisense: 5’-ACGUGACACGUUCGGAGAATT-3’ |
|
hsa-miR-324-5p inhibitor |
5’-ACACCAAUGCCCUAGGGGAUGCG-3’ |
hsa-miR-324-5p inhibitor NC |
5’-CAGUACUUUUGUGUAGUACAA-3’ |
Ultrasound examination and US-FNA
All grayscale and Doppler sonographic examinations were performed with 5–13MHz linear probes (ESAOTE Mylab90 and Mindray Resona 7) by experienced radiologists. US scanning involved the evaluation of the neck anatomy, including the thyroid gland, surrounding vasculature, and cervical lymph nodes. Images of each suspicious nodule or lymph node were obtained in both transverse and longitudinal orientations. All images were recorded and uploaded to a picture archiving and communication system for later retrospective analysis. The sonographic parameters of the target nodule included echogenicity, internal architecture, location (upper-, mid-, low-third, anterior, middle, posterior and throughout the anterior and posterior of thyroid lobe in longitudinal section; internal, middle, external and throughout the internal and external of thyroid lobe in transverse section), size (anteroposterior diameter (A), longitudinal diameter (L), transverse diameter (T) and the greatest dimension), shape (A/T≥1 and A/L≥1), margin (regular and irregular, the latter was specifically defined as infiltrative, microlobulated or spiculated), presence of microcalcification or not and color Doppler signal (none/low and medium/high) (Figure 6). PTMC was defined as a tumor that is 10 mm or less along its greatest dimension. Features suggesting abnormal metastatic lymph nodes included enlargement in short axis, loss of the fatty hilum, a rounded rather than oval shape, hyperechogenicity, cystic change, calcification, and peripheral vascularity [12]. For patients with multiple nodules, only the most suspicious nodule corresponding to the pathological outcome was included. The time interval between US and operation for PTC tissue was within one month with the median time of 8 days. All the sonographic features were assessed by one researcher on the premise of not knowing the pathological results.
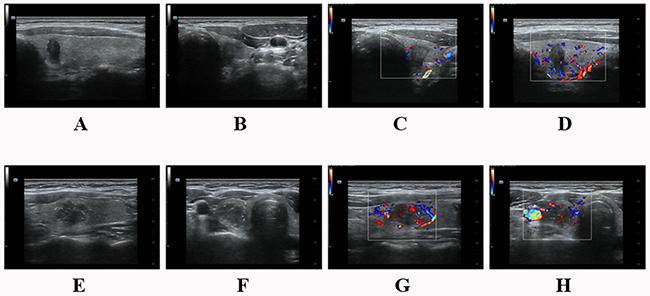
Figure 6: (A-D) A 37 year-old male PTC patient without LNM. There was a hypoechoic solid nodule on the right lobe with an irregular margin and taller than wide shape. The size was 6.9mm×10.0mm×5.8mm. No calcification was detected in the nodule. Color-Doppler showed low blood flow. (E-H) A 34 year-old female PTC patient with LNM. There was a hypoechoic solid nodule on the left lobe with an irregular margin and microcalcification. It located throughout the internal and external of the thyroid lobe with A/L<1 and A/T<1. The size was 14.1mm×13.2mm×18.4mm. Color-Doppler showed low blood flow. (A&E) Nodule throughout the anterior and posterior of thyroid lobe in longitudinal section. (F) Nodule throughout the internal and external of thyroid lobe in transverse section.
US-FNA was performed by interventional radiologists, using US-guided technology with 25G or 22G needle and 5ml syringe. All interventional radiologists had undergone standard training. Patients were placed in a supine position with the neck hyperextended. Each nodule was punctured at least twice and aspired for five to eight times for each smear.
Cell culture and transfectoin
The human KTC1 cell line was purchased from Chinese Academy of Science. KTC1 cells were cultured in RPMI 1640, MEM NEAA, GlutaMAX™ and Sodium Pyruvate 100 mM Solution (Gibco, 87:1:1:1) medium supplemented with 10% of FBS (Gibco), 100 U/mL penicillin, and 100 μg/mL streptomycin. Cells were incubated at 37°C in a humidified atmosphere of 5% CO2.
MiR-324-5p mimics or miR-324-5p inhibitors and their control oligonucleotides were synthesized by Shanghai Genepharma Co., Ltd. The sequences are listed in Table 7. A day before transfection, cells were plated at a density of 1.5×10⁵ cells/well into 6-well plates. After culturing for 24h when the cell confluence was about 70%, transfection was conducted with Lipofectamine 2000 (Invitrogen, USA) following the manufacturer’s protocol. Transfection effect of miR-324-5p mimic and inhibitor in KTC1 cell line was illuminated in Supplementary Figure 1. Functional assays were conducted 24h-96h after transfection. Transfection efficiencies were evaluated by qRT-PCR.
Cell proliferation assay
Cells were seeded in 96-well plates at approximately 2000 cells/well and cultured in the appropriate medium. Numbers of viable cells were quantified using cell counting kit 8 (Dojindo Molecular Technologies, Japan) at 24 h, 48 h, 72 h, 96 h by measuring OD450 with TECAN infinite M200 plate reader.
Colony formation assay
Cells were seeded into six-well plates with 1000 cells/well in 2ml culture medium and incubated at 37°C in a humidified atmosphere of 5% CO2. The cultured medium was replaced every the other day. After 10 days in culture, the medium was removed and the cells were washed twice with PBS. Finally, the cells were stained with crystal violet for 30 minutes at room temperature, washed again and photographed. Three independent experiments were performed.
Flow cytometry
The apoptosis assay was performed with an Alexa Fluor® 488 Annexin V/Dead Cell Apoptosis Kit (Life Technologies, USA). The cells were suspended in 100 μL binding buffer with 5 μL Annexin V and 1 μL propidium iodide and were incubated for 15 minutes in the dark. Then, binding buffer was added to 400 μL and the cells were resuspended. For the cell cycle analysis, the cells were fixed in 75% ethanol overnight at 4°C. They were then stained using a Cell Cycle and Apoptosis Analysis Kit (Beyotime Biotechnology, China) according to the manufacturer’s instructions. Cell apoptosis and cell cycle were tested and analyzed by a Gallios Flow Cytometer (Beckman Coulter, USA). All experiments were performed independently three times.
Transwell assay
Transwell chambers (Millipore, USA) were used in the migration and invasion assays. Matrigel (BD Biosciences, USA) was used to coat the top side of the membrane used in the invasion assay. Then, 100 μL serum-free medium and 1×10⁵ cells were added to the upper chamber, while 500 μL medium with 5% FBS was added to the lower chamber. The chambers were maintained at 37°C and 5% CO2 for 24 h, followed by removal of cells inside the upper chamber with cotton swabs. Migrated or invaded cells on the membrane bottom-surface were fixed in methanal for 15 minutes and stained with crystal violet for 30 minutes. Cells adhering to the under surface were calculated and photographed using an inverted phase contrast microscope. All experiments were performed in triplicate.
Scratch assay
Cells were seeded on six well plates with RPMI 1640 containing 10% FBS and grown to monolayer confluency. Each monolayer was scratched with a sterile pipette tip. The wound healing procedure was observed for 24 h, and images were photographed at 0 h and 24 h.
Statistical analysis
The statistical analysis was performed with IBM SPSS Statistics (version 23.0). Descriptive statistics were presented as mean ± SD for normal distribution data or quartile for non-normal distribution data; categorical variables were presented as proportions and frequencies. K-S test was used to determine the normality of variable. Chi-square test or fisher’s exact test was used to analyze the categorical data. Two-tailed Student’s t test or Mann Whitney U test was performed to compare the descriptive statistics as appropriate. ROC analysis was performed for the capacity of different variables to discriminate LNM and AUC value was calculated. Data yielding the maximal sum of sensitivity and specificity was set as the optimal cut-off value from ROC. Multivariate logistic regression analyses were performed to determine the independent factors of LNM (selectin method was Forward LR). Odds ratios (ORs) with 95% confidence intervals (CIs) were calculated. P<0.05 was considered statistically different in all tests.
Author contributions
XfN, LY, WwZ conceived and designed the experiments. YhY and SjX implemented the experiments. YhY, ZxN, WhW, YjK, YW collected samples and clinical information. YhY analyzed the data. LZ assessed the sonographic images. YhY and SjX wrote the manuscript.
ACKNOWLEDGMENTS
All authors are grateful for the help from staff in Department of Infectious Disease, Ruijin Hospital and friends from Chinese Academy of Sciences. They offered their experience and laboratory generously. We also appreciate the assistance from Pathological Department, Ruijin Hospital. We thank Dr. Jianqiao Zhou at Ruijin Hospital for his technical assistance in image acquisition in this project.
CONFLICTS OF INTEREST
All authors declare no competing financial interests with respect to the preparation of this work.
FUNDING
This study was sponsored by National Natural Science Foundation of China (81471668).
REFERENCES
1. Davies L, Welch HG. Increasing incidence of thyroid cancer in the United States, 1973-2002. JAMA. 2006; 295:2164-2167.
2. Pellegriti G, Frasca F, Regalbuto C, Squatrito S, Vigneri R. Worldwide increasing incidence of thyroid cancer: update on epidemiology and risk factors. J Cancer Epidemiol. 2013; 2013:965212.
3. Hanley JP, Jackson E, Morrissey LA, Rizzo DM, Sprague BL, Sarkar IN, Carr FE. Geospatial and temporal analysis of thyroid cancer incidence in a rural population. Thyroid. 2015; 25:812-822.
4. Wang Y, Wang W. Increasing incidence of thyroid cancer in Shanghai, China, 1983-2007. Asia Pac J Public Health. 2015; 27:NP223-229.
5. Kitahara CM, Sosa JA. The changing incidence of thyroid cancer. Nat Rev Endocrinol. 2016; 12:646-653.
6. Lecumberri B, Alvarez-Escola C, Martin-Vaquero P, Nistal M, Martin V, Riesco-Eizaguirre G, Sosa G, Pallardo LF. Solitary hemorrhagic cerebellar metastasis from occult papillary thyroid microcarcinoma. Thyroid. 2010; 20:563-567.
7. Simmons JD, Pinson TW, Donnellan KA, Harbarger CF, Pitman KT, Griswold R. A rare case of a 1.5 mm papillary microcarcinoma of the thyroid presenting with pituitary metastasis. Am Surg. 2010; 76:336-338.
8. Leboulleux S, Rubino C, Baudin E, Caillou B, Hartl DM, Bidart JM, Travagli JP, Schlumberger M. Prognostic factors for persistent or recurrent disease of papillary thyroid carcinoma with neck lymph node metastases and/or tumor extension beyond the thyroid capsule at initial diagnosis. J Clin Endocrinol Metab. 2005; 90:5723-5729.
9. Ricarte-Filho J, Ganly I, Rivera M, Katabi N, Fu W, Shaha A, Tuttle RM, Fagin JA, Ghossein R. Papillary thyroid carcinomas with cervical lymph node metastases can be stratified into clinically relevant prognostic categories using oncogenic BRAF, the number of nodal metastases, and extra-nodal extension. Thyroid. 2012; 22:575-584.
10. Noguchi M, Kumaki T, Taniya T, Miyazaki I. Bilateral cervical lymph node metastases in well-differentiated thyroid cancer. Arch Surg. 1990; 125:804-806.
11. Wang W, Larson SM, Tuttle RM, Kalaigian H, Kolbert K, Sonenberg M, Robbins RJ. Resistance of [18f]-fluorodeoxyglucose-avid metastatic thyroid cancer lesions to treatment with high-dose radioactive iodine. Thyroid. 2001; 11:1169-1175.
12. Haugen BR, Alexander EK, Bible KC, Doherty GM, Mandel SJ, Nikiforov YE, Pacini F, Randolph GW, Sawka AM, Schlumberger M, Schuff KG, Sherman SI, Sosa JA, et al. 2015 American Thyroid Association Management Guidelines for adult patients with thyroid nodules and differentiated thyroid cancer: the American Thyroid Association Guidelines task force on thyroid nodules and differentiated thyroid cancer. Thyroid. 2016; 26:1-133.
13. Xu SY, Zhan WW, Wang WH. Evaluation of thyroid nodules by a scoring and categorizing method based on sonographic features. J Ultrasound Med. 2015; 34:2179-2185.
14. Zhan WW, Zhou P, Zhou JQ, Xu SY, Chen KM. Differences in sonographic features of papillary thyroid carcinoma between neck lymph node metastatic and nonmetastatic groups. J Ultrasound Med. 2012; 31:915-920.
15. Hwang HS, Orloff LA. Efficacy of preoperative neck ultrasound in the detection of cervical lymph node metastasis from thyroid cancer. Laryngoscope. 2011; 121:487-491.
16. Choi JS, Chung WY, Kwak JY, Moon HJ, Kim MJ, Kim EK. Staging of papillary thyroid carcinoma with ultrasonography: performance in a large series. Ann Surg Oncol. 2011; 18:3572-3578.
17. Lee DW, Ji YB, Sung ES, Park JS, Lee YJ, Park DW, Tae K. Roles of ultrasonography and computed tomography in the surgical management of cervical lymph node metastases in papillary thyroid carcinoma. Eur J Surg Oncol. 2013; 39:191-196.
18. Yang Y, Chen C, Chen Z, Jiang J, Chen Y, Jin L, Guo G, Zhang X, Ye T. Prediction of central compartment lymph node metastasis in papillary thyroid microcarcinoma. Clin Endocrinol (Oxf). 2014; 81:282-288.
19. Sita-Lumsden A, Fletcher CE, Dart DA, Brooke GN, Waxman J, Bevan CL. Circulating nucleic acids as biomarkers of prostate cancer. Biomark Med. 2013; 7:867-877.
20. Sita-Lumsden A, Dart DA, Waxman J, Bevan CL. Circulating microRNAs as potential new biomarkers for prostate cancer. Br J Cancer. 2013; 108:1925-1930.
21. Bartel DP. MicroRNAs: target recognition and regulatory functions. Cell. 2009; 136:215-233.
22. Shukla GC, Singh J, Barik S. MicroRNAs: processing, maturation, target recognition and regulatory functions. Mol Cell Pharmacol. 2011; 3:83-92.
23. Ambros V. The functions of animal microRNAs. Nature. 2004; 431:350-355.
24. Hui AB, Lin A, Xu W, Waldron L, Perez-Ordonez B, Weinreb I, Shi W, Bruce J, Huang SH, O’Sullivan B, Waldron J, Gullane P, Irish JC, et al. Potentially prognostic miRNAs in HPV-associated oropharyngeal carcinoma. Clin Cancer Res. 2013; 19:2154-2162.
25. Chen Y, Wang SX, Mu R, Luo X, Liu ZS, Liang B, Zhuo HL, Hao XP, Wang Q, Fang DF, Bai ZF, Wang QY, Wang HM, et al. Dysregulation of the miR-324-5p-CUEDC2 axis leads to macrophage dysfunction and is associated with colon cancer. Cell Rep. 2014; 7:1982-1993.
26. Song L, Liu D, Zhao Y, He J, Kang H, Dai Z, Wang X, Zhang S, Zan Y. Sinomenine inhibits breast cancer cell invasion and migration by suppressing NF-kappaB activation mediated by IL-4/miR-324-5p/CUEDC2 axis. Biochem Biophys Res Commun. 2015; 464:705-710.
27. Cao L, Xie B, Yang X, Liang H, Jiang X, Zhang D, Xue P, Chen D, Shao Z. MiR-324-5p suppresses hepatocellular carcinoma cell invasion by counteracting ECM degradation through post-transcriptionally downregulating ETS1 and SP1. PLoS One. 2015; 10:e0133074.
28. Kuo WT, Yu SY, Li SC, Lam HC, Chang HT, Chen WS, Yeh CY, Hung SF, Liu TC, Wu T, Yu CC, Tsai KW. MicroRNA-324 in human cancer: miR-324-5p and miR-324-3p have distinct biological functions in human cancer. Anticancer Res. 2016; 36:5189-5196.
29. Witt BL, Schmidt RL. Rapid onsite evaluation improves the adequacy of fine-needle aspiration for thyroid lesions: a systematic review and meta-analysis. Thyroid. 2013; 23:428-435.
30. Suh CH, Baek JH, Lee JH, Choi YJ, Kim KW, Lee J, Chung KW, Shong YK. The role of core-needle biopsy in the diagnosis of thyroid malignancy in 4580 patients with 4746 thyroid nodules: a systematic review and meta-analysis. Endocrine. 2016; 54:315-328.
31. Krauss EA, Mahon M, Fede JM, Zhang L. Application of the Bethesda classification for thyroid fine-needle aspiration: institutional experience and meta-analysis. Arch Pathol Lab Med. 2016; 140:1121-1131.
32. Zhang Y, Zhong Q, Chen X, Fang J, Huang Z. Diagnostic value of microRNAs in discriminating malignant thyroid nodules from benign ones on fine-needle aspiration samples. Tumour Biol. 2014; 35:9343-9353.
33. Fnais N, Soobiah C, Al-Qahtani K, Hamid JS, Perrier L, Straus SE, Tricco AC. Diagnostic value of fine needle aspiration BRAF(V600E) mutation analysis in papillary thyroid cancer: a systematic review and meta-analysis. Hum Pathol. 2015; 46:1443-1454.
34. Sun W, Lan X, Zhang H, Dong W, Wang Z, He L, Zhang T, Liu S. Risk factors for central lymph node metastasis in CN0 papillary thyroid carcinoma: a systematic review and meta-analysis. PLoS One. 2015; 10:e0139021.
35. Xu JM, Xu HX, Li XL, Bo XW, Xu XH, Zhang YF, Guo LH, Liu LN, Qu S. A risk model for predicting central lymph node metastasis of papillary thyroid microcarcinoma including conventional ultrasound and acoustic radiation force impulse elastography. Medicine (Baltimore). 2016; 95:e2558.
36. Lin DZ, Qu N, Shi RL, Lu ZW, Ji QH, Wu WL. Risk prediction and clinical model building for lymph node metastasis in papillary thyroid microcarcinoma. Onco Targets Ther. 2016; 9:5307-5316.
37. Kim KE, Kim EK, Yoon JH, Han KH, Moon HJ, Kwak JY. Preoperative prediction of central lymph node metastasis in thyroid papillary microcarcinoma using clinicopathologic and sonographic features. World J Surg. 2013; 37:385-391.
38. Ma B, Wang Y, Yang S, Ji Q. Predictive factors for central lymph node metastasis in patients with cN0 papillary thyroid carcinoma: a systematic review and meta-analysis. Int J Surg. 2016; 28:153-161.
39. Ito Y, Miyauchi A, Kihara M, Higashiyama T, Kobayashi K, Miya A. Patient age is significantly related to the progression of papillary microcarcinoma of the thyroid under observation. Thyroid. 2014; 24:27-34.
40. Xu JM, Xu XH, Xu HX, Zhang YF, Guo LH, Liu LN, Liu C, Bo XW, Qu S, Xing M, Li XL. Prediction of cervical lymph node metastasis in patients with papillary thyroid cancer using combined conventional ultrasound, strain elastography, and acoustic radiation force impulse (ARFI) elastography. Eur Radiol. 2016; 26:2611-2622.
41. Zhou W, Jiang S, Zhan W, Zhou J, Xu S, Zhang L. Ultrasound-guided percutaneous laser ablation of unifocal T1N0M0 papillary thyroid microcarcinoma: preliminary results. Eur Radiol. 2017; 27:2934-2940.
42. Kim JH, Baek JH, Sung JY, Min HS, Kim KW, Hah JH, Park DJ, Kim KH, Cho BY, Na DG. Radiofrequency ablation of low-risk small papillary thyroidcarcinoma: preliminary results for patients ineligible for surgery. Int J Hyperthermia. 2017; 33:1-11.
43. Livak KJ, Schmittgen TD. Analysis of relative gene expression data using real-time quantitative PCR and the 2(-Delta Delta C(T)) Method. Methods. 2001; 25:402-408.