
INTRODUCTION
Pathologists use the differentiation status of cancer cells as a prognostic indicator to predict the aggressiveness and stage of a given tumor. In general, a low level of differentiation, in which the tumor cells lose structural organization, grow more rapidly, and are morphologically dissimilar from the surrounding normal tissue, correlates to a higher level of aggressiveness and a poor prognosis. There are two basic mechanisms by which tumor cells can acquire an undifferentiated state. First, as shown with neuroblastoma and glioblastoma [1-3], the hypoxic state of a solid tumor can dedifferentiate cancerous cells into a less mature state. Second, the presence of an oncogene can actively block the differentiation process [4-6]. However, how the oncogene produces large-scale changes in gene and/or miRNA expression to achieve this state is not yet fully understood. Regardless of the mechanism by which tumor cells achieve the undifferentiated state, researchers have capitalized on this knowledge to develop differentiation therapy, in which undifferentiated tumor cells are induced to reactivate the differentiation program [7].
Like many other cancers, Rhabdomyosarcoma (RMS), one of the most common soft tissue sarcomas in children, is characterized by poorly differentiated muscle cells. RMS is comprised of two main subtypes: embryonal (ERMS) and alveolar (ARMS), each defined by its unique histology, clinical presentation, therapy, and prognosis [8]. ARMS, the more aggressive subtype, is primarily characterized by the t(2;13)(q35;q14) translocation, which creates the oncogenic fusion protein PAX3-FOXO1 [9, 10]. Among the mechanisms describing the impaired differentiation seen in ARMS [11-16], suppression of microRNAs (miRNA) miR-206 and miR-29 has been noted. MiR-206, one of the central miRNA that regulate myogenic differentiation, promotes myogenic differentiation, is downregulated in ARMS [17] and low miR-206 expression correlates to poor overall survival [18]. In contrast, silencing of miR-29 inhibits myogenesis [14]. Despite this knowledge, very little is known about how global miRNA expression levels change through the normal course of early myogenic differentiation and how the expression of PAX3-FOXO1 alters the landscape of changes during this same time period.
In this study we are one of the first to provide a picture of the global changes in miRNA expression that occur in the earliest stages of myogenic differentiation and to determine how the expression of PAX3-FOXO1 alters these changes, either directly or indirectly. We report that the oncogenic fusion protein mediates these changes in three distinct ways: 1) by inhibiting the expression of miRNA essential for promoting myogenesis, 2) by promoting the aberrant expression of miRNA not normally expressed during myogenesis, and 3) by altering the normal expression of miRNA. The ultimate result of these changes is predicted to be the inhibition of myogenic differentiation. Our results allow us to propose a model by which miRNAs contribute to the process of normal myogenic differentiation and to describe how the changes mediated by the oncogenic fusion protein would block normal myogenesis. Taken together, these results allow us to propose the use of miRNA-mediated differentiation therapy as a component of a multi-faceted treatment regimen for ARMS. Finally, the results presented here have implications that may be applied to other tumor models, since determining global changes in miRNA expression relative to the surrounding normal tissue may be used to identify key miRNAs that can be targeted for novel therapies for individual tumor models.
RESULTS
Effect of PAX3-FOXO1 on miRNA expression during early myogenesis
To determine how miRNA expression changes during early myogenic differentiation and to examine how PAX3-FOXO1 alters these changes, we utilized mouse primary myoblasts stably transduced with the MSCV-IRES-puromycin retroviral vector (negative control), or the same retroviral vector expressing FLAG-epitope tagged PAX3-FOXO1. The transduced cells were selected with puromycin; selected cells were harvested from three independent transductions and pooled, resulting in a single mixed population for each individual construct, which removes the potential for variability that may occur from clonal effects. The observed level of PAX3-FOXO1 expression is equivalent to that of the fusion protein in ARMS tumor cell lines [19, 20] and is therefore directly relevant to the role of the oncogenic fusion protein in ARMS.
In this model proliferating cells were induced to differentiate, as described in the Materials and Methods, and allowed to differentiate for 24 hours. We found that the negative control cells effectively entered the myogenic program exhibiting flattened and elongated cells that have begun to organize, align and fuse into multinucleated myotubes (Figure 1A, top two panels). Proliferating cells stably expressing PAX3-FOXO1 were visually indistinguishable from the negative control cells. However, after 24 hours of differentiation, despite having a flattened and elongated appearance, these cells appeared disorganized and were unable to fuse into multinucleated myotubes (Figure 1A, bottom two panels). A Western blot analysis of markers of early (MyoD), mid (myogenin) and late (MyHC) myogenesis demonstrated that the expression of PAX3-FOXO1 had minimal effects on the expression of MyoD and myogenin but qualitatively decreased the expression of MyHC in both the proliferative state and after 24 hours of differentiation (Figure 1B). Taken together, these results demonstrate the effective differentiation of control cells in this model and that the expression of PAX3-FOXO1 allows the initiation of differentiation but inhibits the ability of the cells to fuse and achieve terminal differentiation.
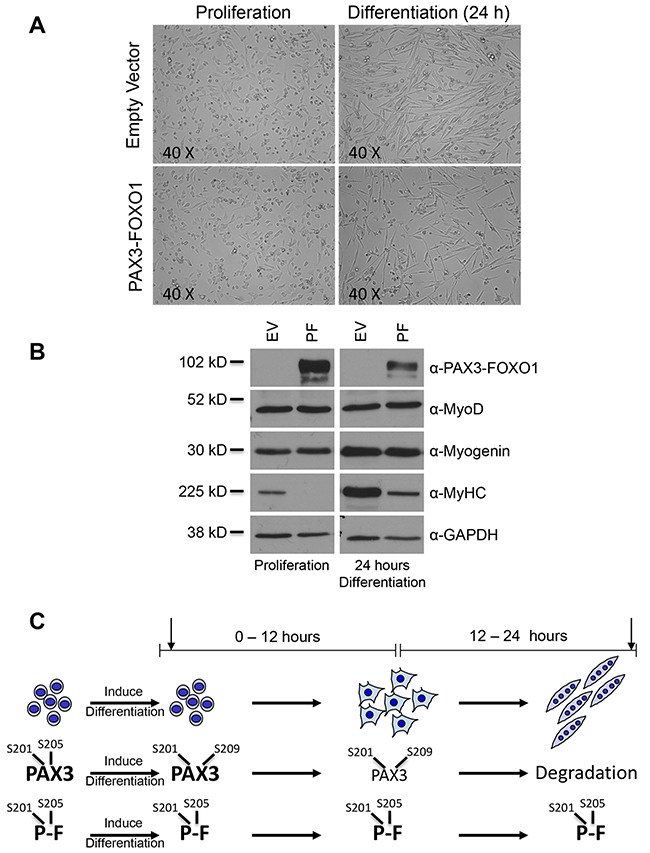
Figure 1: The stable expression of PAX3-FOXO1 inhibits terminal myogenic differentiation. (A) Representative pictures of proliferating primary myoblasts (left panels) and myoblasts differentiated for 24 hours (right panels), either stably transduced with the empty vector negative control (top panels) or with the same vector containing PAX3-FOXO1 (bottom panels). (B) Total extracts were made from proliferating cells (left panel) or cells differentiated for 24 hours (right panel). In each panel the cells were stably transduced with empty vector (EV, left lanes) or the same vector containing PAX3-FOXO1 (PF, right lanes). Protein levels were determined by Western blot analysis using antibodies for PAX3-FOXO1, MyoD (early myogenic marker), Myogenin (mid-myogenic marker), Myosin Heavy Chain (MyHC, late myogenic marker), and GAPDH. (C) Schematic of normal myogenesis and the phosphorylation status of PAX3 and PAX3-FOXO1 in proliferating myoblasts and throughout the first 24 hours of differentiation. Phosphorylation sites are Serine 201 (S201), Serine 205 (S205), or Serine 209 (S209). The arrows indicate the time points at which miRNA expression was determined (30 minutes and 24 hours).
Using this model, we performed miRNA deep sequencing analyses on total RNA isolated from three independent growths of stably transduced primary myoblasts. We selected time points based on the known phosphorylation status and protein expression levels of PAX3 and PAX3-FOXO1 during differentiation (Figure 1C). In the proliferative state, PAX3 is phosphorylated at Serines 201 and 205. Upon the induction of differentiation PAX3 undergoes a rapid (<15 minutes) loss of phosphorylation at Serine 205 with a gain in phosphorylation at Serine 209, changes in phosphorylation that do not occur on PAX3-FOXO1 [21-23]. Further, PAX3 protein levels begin to decrease after approximately 12 hours of differentiation and by 24 hours of differentiation are gone. In contrast, PAX3-FOXO1 is stable and does not undergo a similar loss in protein expression at 24 hours [24]. Therefore, we used cells from the proliferative state, the initial stages of differentiation (30 minutes; a time when changes in phosphorylation status are observed) and a point at which differentiation has progressed but terminal myotube formation has yet to occur (24 hours; a time when PAX3 expression is gone but PAX3-FOXO1 is stable). The resulting sequencing data was analyzed in large-scale comparative miRNA analyses using the miRNAKey program (see Materials and Methods). The data used for subsequent analysis were limited to miRNA displaying statistically significant differences (p < 0.05), as determined by the miRNAKey program, and miRNA present in all time points being analyzed. Further, we used changes in miRNA expression of ≥1.3-fold, either up- or downregulated, as the arbitrary cutoff for changes in miRNA expression.
We found that in the negative control cells 90 miRNA had changes in expression over the time course of differentiation while cells expressing PAX3-FOXO1 had 82 miRNA whose expression changed. Of these miRNA, 39 of the miRNA were found to have expression changes in both the control cells and in cells expressing PAX3-FOXO1 (Figure 2). Therefore, we are able to classify the miRNA into three categories: 1) miRNA whose expression is changed only in the vector only control cells (51 miRNA); 2) miRNA whose expression is changed only in the presence of PAX3-FOXO1 (43 miRNA); and 3) miRNA whose expression changes in both cell types (39 miRNA). Further, although 30 minutes may seem like a short period of time for changes in miRNA expression to occur, we found that 21/90 miRNA (23%) in the vector only control cells exhibited ≥1.3-fold increase or decrease in expression relative to the proliferative state at this time point (Figure 2). Interestingly the presence of PAX3-FOXO1 promoted more robust changes in miRNA expression at 30 minutes with 72/82 miRNA (89%) having ≥1.3-fold increases or decreases in expression, with nearly half of these miRNA changing over 2.5-fold (Figure 2). The results described here are part of a larger genomics study and as such the observed changes in miRNA expression were previously validated by qRT-PCR and published by us [19, 20].
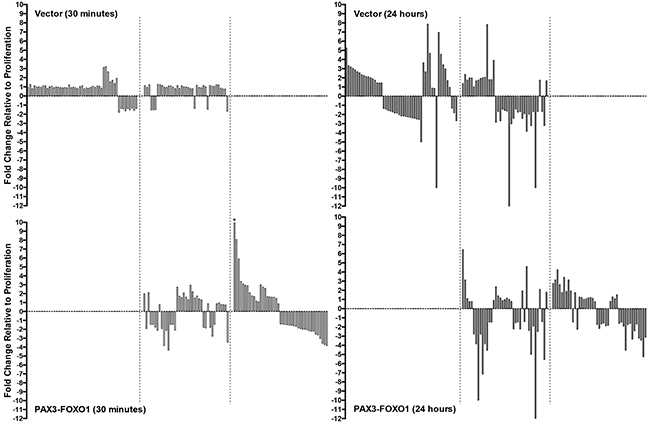
Figure 2: Waterfall plots illustrating the expression levels of miRNA in the negative control cells (Vector, top panels) and in cells stably expressing PAX3-FOXO1 (PAX3-FOXO1, bottom panels) at 30 minutes (left panels) and 24 hours (right panels) of differentiation. The bars from left to right in each graph correspond to the miRNAs listed in order in Tables 1 – 3, respectively. All graphs are plotted on the same scale to facilitate the visual comparison of the magnitude of expression differences in individual miRNA. The asterisk indicates the one miRNA whose expression level (20.88 fold) falls outside the scale of the axis. The dotted lines delineate the three classifications of miRNA changes, as described in the Results.
A closer examination of the 51 miRNA whose expression changed only in the empty vector control cells revealed that they could be further categorized based on how their expression changed over the course of early differentiation (Table 1): 1) minimal change at 30 minutes relative to proliferation with increased expression at 24 hours; 2) minimal change at 30 minutes relative to proliferation with decreased expression at 24 hours; 3) increased expression at 30 minutes relative to proliferation with additional changes at 24 hours; and 4) decreased expression at 30 minutes relative to proliferation with additional changes at 24 hours. We identified validated gene targets for each of the miRNA using miRTarBase [25], using genes validated by two independent experimental methods. We performed a PubMed search on each of the validated target genes, using the gene name and the search terms “muscle” or “myogenesis” to determine if they were experimentally proven to be expressed in muscle and/or contribute to muscle differentiation. The miRNA and muscle target genes were analyzed through the use of QIAGEN’s Ingenuity® Pathway Analysis (IPA®, QIAGEN, Redwood City, www.qiagen.com/ingenuity) to identify biological networks through which the targeted genes may functionally interact with one another. Finally, we performed a PubMed search to provide literature confirmation for the direct action of miRNA on target genes and/or the interaction of target genes with each other.
Table 1: miRNA with expression changes after 30 minutes and 24 hours of differentiation: changes seen only in cells stably transduced with the empty vector
miR |
Target |
Gene function |
30 minutes |
24 hours |
|---|---|---|---|---|
Minimal change at 30 minutes# – increased expression at 24 hours |
||||
210-5p |
E2F3 |
Proliferative transcription factor |
-1.06 |
5.26 |
136-3p |
1.26 |
3.34 |
||
33-5p |
ABCA1 |
Influences intracellular cholesterol transport |
-1.26 |
3.18 |
34c-3p |
NCL |
Maturation of ribosomes – inhibits Rb |
1.14 |
3.04 |
133a-3p |
NFATc4 |
Synergizes with MyoD to express myogenin |
-1.02 |
2.87 |
149-5p |
E2F1 |
Proliferative transcription factor |
1.02 |
2.68 |
450a-5p |
HNRNPK |
RNA processing – suppresses myogenesis |
-1.06 |
2.56 |
434-5p |
RTL1 |
Promotes muscle hypertrophy |
1.12 |
2.36 |
*322-3p |
1.12 |
2.25 |
||
542-3p |
COX2 |
Prostaglandin synthase – inhibits myogenesis |
-1.21 |
2.14 |
341-3p |
1.02 |
2.12 |
||
483-5p |
NCL |
Maturation of ribosomes – inhibits Rb |
1.07 |
2.02 |
666-5p |
ZEB2 |
Represses expression of E-cadherin |
-1.09 |
1.90 |
409-3p |
1.00 |
1.75 |
||
380-3p |
-1.04 |
1.75 |
||
23b-3p |
FBXO32 |
Expression promotes muscle atrophy |
-1.07 |
1.46 |
6944-3p |
-1.11 |
1.38 |
||
Minimal change at 30 minutes# – decreased expression at 24 hours |
||||
151-3p |
-1.08 |
-1.36 |
||
181d-5p |
RUNX1 |
Activated by MyoD – promotes myogenesis |
-1.12 |
-1.42 |
Let-7b-5p |
MTPN |
Growth factor that promotes muscle growth |
1.21 |
-1.56 |
21a-5p |
Pdcd4 |
Overexpression promotes myogenesis |
-1.09 |
-1.63 |
93-5p |
STAT3 |
Promotes later differentiation |
-1.02 |
-1.72 |
28a-3p |
-1.12 |
-1.85 |
||
183-5p |
-1.26 |
-1.85 |
||
Let-7a-5p |
IL13 |
Secreted by myotubes to recruit cells |
1.03 |
-2.04 |
Let-7d-5p |
BDNF |
Neurotropic factor that promotes myogenesis |
1.11 |
-2.08 |
Let-7i-5p |
-1.29 |
-2.17 |
||
106b-3p |
-1.12 |
-2.22 |
||
Let-7g-5p |
-1.17 |
-2.27 |
||
17-5p |
ESR1 |
Estrogen receptor – required for fusion |
-1.05 |
-2.32 |
92b-3p |
1.08 |
-2.38 |
||
20a-5p |
STAT3 |
Promotes later differentiation |
-1.06 |
-2.43 |
196b-5p |
1.10 |
-2.5 |
||
Let-7c-5p |
Myc |
Inhibits MyoD activity and myogenesis |
1.08 |
-2.56 |
149-3p |
-1.16 |
-5.00 |
||
Increased expression at 30 minutes – changed expression at 24 hours |
||||
2137 |
3.13 |
3.65 |
||
466i-3p |
CDC14A |
Regulates exit from mitosis |
3.22 |
2.66 |
667-3p |
2.65 |
7.87 |
||
*503-5p |
FGFR1 |
Growth factor receptor, inhibits myogenesis |
1.55 |
4.68 |
6356 |
1.73 |
-1.12 |
||
Let-7d-3p |
CCND1 |
Cyclin D1 – regulates G1/S |
1.36 |
-1.16 |
25-5p |
CDKN1A |
Inhibits G1/S progression |
1.94 |
-10.00 |
Decreased expression at 30 minutes – changed expression at 24 hours |
||||
139-5p |
Kit |
Receptor – promotes myogenesis from skin |
-1.78 |
6.97 |
210-3p |
NFkB1 |
Subunit of NFkB – inhibits myogenesis |
-1.36 |
4.58 |
*133a-5p |
RhoA |
GTPase detrimental to myogenesis |
-1.40 |
3.43 |
351-3p |
-1.63 |
2.98 |
||
501-3p |
AR |
Upregulates expression of MyoD/myogenin |
-1.35 |
1.70 |
*181a-1-3p |
AR |
Upregulates expression of MyoD/myogenin |
-1.52 |
-1.02 |
10a-5p |
BCL2l11 |
Proapoptotic protein |
-1.32 |
-1.32 |
*181c-3p |
-1.58 |
-1.82 |
||
27a-5p |
RUNX1 |
Activated by MyoD – promotes myogenesis |
-1.37 |
-2.70 |
Fold expression changes indicate the miRNA gene expression at 30 minutes or 24 hours relative to levels seen in proliferating cells. The asterisk indicates microRNAs known to be myomiRs. #Minimal change is considered to be miRNA expression between -1.30 and +1.30 fold change relative to proliferation levels.
Consistent with the inverse relationship between miRNA and gene expression, we found that miRNA with minimal changes in expression at 30 minutes but increased expression at 24 hours of differentiation primarily target genes whose expression must decrease in order to allow myogenesis to progress (Table 1). These include genes whose expression inhibits myogenesis (e.g., RTL1, SMAD3, COX1 and 2, and Zeb2) and genes that regulate the expression of early myogenic markers (e.g., HES1 and NFATc4). Further, targeted genes also include those important for promoting cellular proliferation (e.g., E2F1, Notch1, and Cyclin D2), which must decrease to establish the post-mitotic state, and genes that regulate other biochemical functions required for myogenesis (ABCA1 and Prdm16). Network analysis highlighted biological interplay between many of the targeted genes (Figure 3A), which adds further downstream complexity to how miRNA inhibit the expression or activity of genes in order to promote myogenesis.
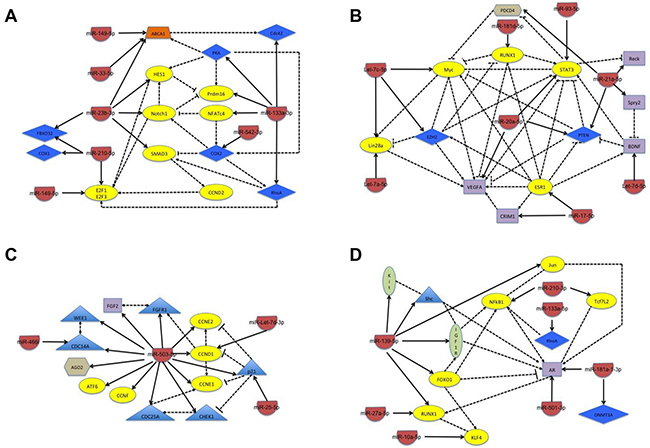
Figure 3: Schematic of the network of biological interactions between miRNA and their target genes whose change in expression is seen in the negative control cells only. Schematics are separated into groups according to how changes occur during the first 24 hours of differentiation. (A) Minimal changes observed at 30 minutes with subsequent increase in expression at 24 hours of differentiation; (B) minimal changes observed at 30 minutes with subsequent decrease in expression at 24 hours of differentiation; (C) increased expression at 30 minutes with subsequent increase or decrease at 24 hours of differentiation; and (D) decreased expression at 30 minutes with subsequent increase or decrease at 24 hours of differentiation. The target genes are classified by color and shape according to their known biological function: yellow oval – transcription factor; blue diamond – enzyme; purple rectangle – ligand; green oval – receptor; orange tetrahedron – transporter; blue triangle – proliferative regulator; and brown hexagon – miscellaneous function. The solid line indicates the direct regulation of the expression of a target gene by the miRNA and the dotted line indicates a physical interaction between target genes, with both types of interactions being supported through literature evidence.
In contrast, the miRNA that exhibited minimal changes at 30 minutes but decreased expression at 24 hours of differentiation primarily target genes whose expression must increase for effective differentiation to occur (Table 1). These include genes whose expression promotes myogenesis and muscle regeneration (e.g., ESR1, RUNX1, STAT3, and VEGFA) or that inhibit the expression or activity of early myogenic markers (Myc and EZH2). Further consistent with the need of the post-mitotic state, TUSC2, which promotes G1 arrest, along with several other genes whose biological functions are necessary for the efficient progression of myogenic differentiation are targets (Table 1). Network analysis demonstrated that many of the target genes have biological effects and/or interactions on each other within this subcategory, highlighting an even more complex interplay to promote myogenesis (Figure 3B).
Interestingly, the miRNA whose expression increases at 30 minutes of differentiation primarily target cell cycle regulatory genes, many of which have pro-proliferative effects (Table 1 and Figure 3C). In particular, miR-503-5p, targets at least 14 known genes, most of which are essential for promoting cell cycle progression, including Cyclin D1, Cyclin E1, and CDC25A. Further, the miRNA in this subcategory have subsequent changes in expression at 24 hours that would further inhibit proliferation, including an additional increase in the expression of miR-503-5p, and a significant decrease in the expression of miR-25-5p, which targets the cell cycle inhibitory protein p21. Finally, as in other subcategories, there is additional biological interplay between target genes that would be expected to further promote the establishment of the post-mitotic state (Figure 3C).
Finally, miRNA with an initial decrease in expression at 30 minutes have changes that are consistent with the role the target genes play in early myogenesis (Table 1). For example, KLF4, IGF1R, and DNMT3A are all required for the initiation of myogenesis. However, their expression must decrease in the later stages of muscle differentiation, since they have been shown to inhibit myogenesis. Consistent with this fact, the miRNA that target these genes (miR-10a-5p, miR-139-5p, and miR181a-3p, respectively) have initial decreases in expression at 30 minutes with a concomitant increase in expression at 24 hours. Further, several miRNA in this subcategory maintain a decreased level of expression throughout the first 24 hours of differentiation, in particular miR-27a-5p, which targets genes important for mitochondrial biogenesis, a biological process essential for myogenic differentiation. IPA analysis further illustrates how biological interactions are predicted to occur such that increases in target genes at 30 minutes (e.g., IGF1R) would positively effect the expression or activity of additional factors essential for perpetuating myogenesis (e.g., AR) (Figure 3D).
A similar analysis of the miRNA whose expression changes occur only in the presence of PAX3-FOXO1 revealed that only two subclasses of changes were observed: 1) miRNA with increased expression at 30 minutes relative to proliferation with additional changes at 24 hours; and 2) miRNA with decreased expression at 30 minutes relative to proliferation with additional changes at 24 hours (Table 2). We found that the miRNA in the first subcategory target genes with apparently conflicting roles in myogenic differentiation, with miR-1a-5p effecting 11 of these target genes (Table 2 and Figure 4A). Consistent with the increase in miRNA expression at 30 minutes, several of the miRNA within this category target genes whose expression must decrease to allow the initiation of differentiation (e.g., miR-1a-5p targeting EGFR and miR-19a-3p targeting PTEN and TNF). However, in contrast, the maintained increase in several of the miRNA in this category target genes required to promote the fusion or terminal differentiation of muscle cells (e.g. TCF4, VEGFA, and TNS4). Taken together, and consistent with the pathological phenotype of ARMS tumor cells, alterations in the regulating miRNA would result in changes in target gene expression that would allow the initiation of myogenesis with a subsequent inhibition of myoblast fusion and terminal differentiation.
Table 2: miRNA with expression changes after 30 minutes and 24 hours of differentiation: changes seen only in cells stably expressing PAX3-FOXO1
miR |
Target |
Gene function |
30 minutes |
24 hours |
|---|---|---|---|---|
Increased expression at 30 minutes – changed expression at 24 hours |
||||
*1a-3p |
CDCP1 |
Receptor expressed a high levels in muscle |
20.88 |
2.76 |
7a-5p |
AGO2 |
Involved in miRNA maturation |
8.08 |
3.15 |
148b-3p |
DNMT1 |
DNA methyltransferase; promotes myogenesis |
5.89 |
4.26 |
328-3p |
AGO2 |
Involved in miRNA maturation |
3.38 |
2.63 |
148a-3p |
ROCK1 |
Rho kinase that inhibits myogenesis |
3.08 |
1.77 |
19a-3p |
TNF |
Inhibits myogenesis and MyoD expression |
2.95 |
3.43 |
532-5p |
2.90 |
1.89 |
||
574-3p |
EGFR |
TKR – down regulation promotes myogenesis |
2.11 |
3.15 |
296-3p |
TNF |
Inhibits myogenesis and MyoD expression |
1.75 |
1.94 |
423-3p |
1.68 |
-1.45 |
||
103-3p |
GPD1 |
Carbohydrate and lipid metabolism |
1.17 |
1.75 |
*125b-5p |
PPP1CA |
Phosphatase – energy production in muscle |
1.09 |
-2.27 |
Increased expression at 30 minutes – minimal change at 24 hours# |
||||
676-3p |
3.00 |
1.27 |
||
674-3p |
2.74 |
1.24 |
||
504-5p |
TCF4 |
Transcription factor –MyHC expression |
2.60 |
1.02 |
34b-5p |
1.68 |
1.08 |
||
484 |
1.66 |
1.19 |
||
130b-5p |
1.61 |
1.24 |
||
1983 |
1.61 |
1.14 |
||
*222-3p |
KIT |
TKR that promotes myogenesis from stem cells |
1.48 |
0.77 |
Decreased expression at 30 minutes – changed expression at 24 hours |
||||
27a-3p |
RUNX1 |
Promotes myofibrillar disorganization |
0.86 |
-1.72 |
130a-3p |
MEOX2 |
Transcription factor, activates Myf5 expression |
-1.41 |
-2.17 |
425-5p |
MEF2C |
Myogenic transcription factor |
-1.42 |
-1.67 |
30a-5p |
TNRC6A |
Downregulation required for myotube fusion |
-1.45 |
-1.56 |
30b-5p |
CTGF |
Inhibits myogenesis by promoting fibrosis |
-1.49 |
-1.88 |
872-3p |
-1.54 |
-1.82 |
||
301a-3p |
PIAS3 |
Inhibits JAK/STAT – promote myogenesis |
-1.56 |
0.81 |
*181b-5p |
TIMP3 |
Inhibits MMP and blocks myoblast fusion |
-1.61 |
1.30 |
872-5p |
-1.67 |
1.09 |
||
191-5p |
MXI1 |
Inhibits Myc activity to promote myogenesis |
-1.85 |
1.52 |
148b-5p |
-1.92 |
-1.61 |
||
708-3p |
-2.00 |
-1.47 |
||
*181a-5p |
MSX2 |
Inhibits myogenic differentiation |
-2.00 |
-1.92 |
22-3p |
Cdc25c |
Phosphatase controls entry into mitosis |
-2.04 |
-4.54 |
*181c-5p |
-2.17 |
-1.75 |
||
*27b-3p |
RUNX1 |
Prevents myofibrillar disorganization |
-2.22 |
-1.61 |
*24-2-5p |
PRKCA |
Inhibits cell spreading |
-2.22 |
-3.33 |
541-5p |
-2.56 |
-2.43 |
||
1957a |
-2.63 |
-1.67 |
||
*208b-3p |
-3.03 |
-3.22 |
||
148a-5p |
-3.57 |
-3.44 |
||
30d-3p |
-3.70 |
-5.26 |
||
136-5p |
NR2F2 |
Orphan receptor – activates Myf5 expression |
-3.84 |
-3.13 |
Fold expression changes indicate the miRNA gene expression at 30 minutes or 24 hours relative to levels seen in proliferating cells. The asterisk indicates microRNAs known to be myomiRs. #Minimal change is considered to be miRNA expression between -1.30 and +1.30 fold change relative to proliferation levels.
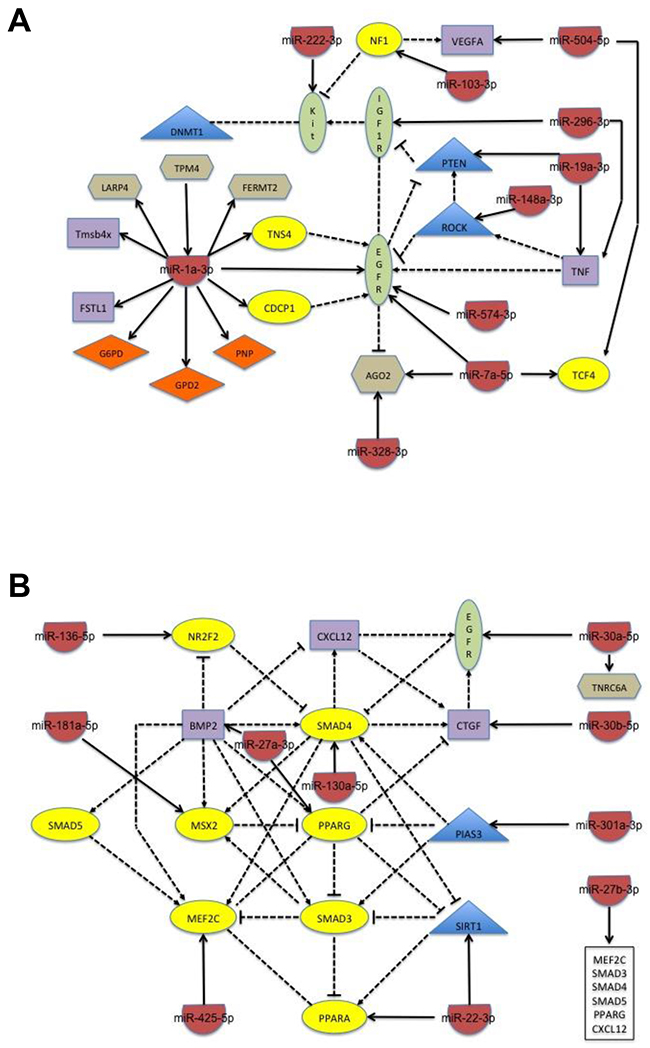
Figure 4: Schematic of the network of biological interactions between miRNA and their target genes whose change in expression is seen only in cells stably expressing PAX3-FOXO1. Schematics are separated into groups according to how changes occur during the first 24 hours of differentiation. (A) Increased expression at 30 minutes with subsequent increase or decrease at 24 hours of differentiation; and (B) decreased expression at 30 minutes with subsequent increase or decrease at 24 hours of differentiation. The target genes are classified by color and shape according to their known biological function: yellow oval – transcription factor; blue diamond – enzyme; purple rectangle – ligand; green oval – receptor; orange tetrahedron – transporter; blue triangle – proliferative regulator; and brown hexagon – miscellaneous function. The solid line indicates the direct regulation of the expression of a target gene by the miRNA and the dotted line indicates a physical interaction between target genes, with both types of interactions being supported through literature evidence.
The miRNA in the second subcategory, in which miRNA expression decreases at 30 minutes and remains decreased at 24 hours, for the most part exhibited small changes with a majority of them having between 1.5 – 2.0 fold decrease in expression (Table 2). The observed decrease in miRNA would subsequently result in an increase in the expression of target genes that are required to promote early myogenesis (e.g., MEF2C, SIRT1, and MEOX2). Further, these observed changes in miRNA expression would also promote the expression of genes that either inhibit myoblast fusion (e.g., RUNX1 and TIMP3) or inhibit terminal differentiation through the promotion of osteogenesis or fibrosis (e.g., BMP2, MSX2, and CTGF). Despite the smaller changes in miRNA expression, the effected target genes exhibit a complex interplay of biological interactions that would be expected to further allow the initiation of myogenesis with an inhibition of terminal differentiation (Figure 4B).
Although 39 of the identified miRNA demonstrated changes in expression in both the control cells and cells expressing PAX3-FOXO1, only 6 of these miRNA exhibited similar changes in expression between the two samples (Table 3). The remaining 33 miRNA had different patterns of expression in cells stably transduced with PAX3-FOXO1 relative to the empty vector control and could be categorized as follows (Table 3): 1) Increased expression from 30 minutes to 24 hours in both cell types with greater increases in cells expressing PAX3-FOXO1; 2) Increased expression from 30 minutes to 24 hours in control cells with decreased expression in cells expressing PAX3-FOXO1; 3) Decreased expression from 30 minutes to 24 hours in both cell types with higher levels of expression in PAX3-FOXO1 cells relative to control; and 4) decreased expression from 30 minutes to 24 hours in both cell types with lower levels of expression in PAX3-FOXO1 cells relative to control.
Table 3: MicroRNA changes that occur in cells stably transduced with empty vector (Vector) or PAX3-FOXO1 (PF)
miRNA |
Vector |
Vector |
PF |
PF |
Target |
Function |
|---|---|---|---|---|---|---|
Vector increased 30 minutes to 24 hours – PF appreciably increased relative to vector control |
||||||
335-5p |
1.13 |
1.39 |
1.98 |
6.45 |
RB1 |
Regulation of growth; decrease required for differentiation |
*322-5p |
-1.06 |
2.38 |
-1.92 |
3.14 |
||
Vector increased 30 minutes to 24 hours – PF decreased 30 minutes to 24 hours |
||||||
PF – 30 minutes increase relative to EV – 24 hours decrease |
||||||
128-3p |
1.24 |
1.76 |
2.13 |
1.11 |
Ppara |
Promotes mitochondrial biogenesis |
PF – 30 minutes similar to EV – no increase at 24 hours |
||||||
3107-5p |
-1.52 |
2.01 |
-1.47 |
0.79 |
||
*486-5p |
-1.52 |
1.99 |
-1.47 |
0.79 |
||
PF – 30 minutes similar to EV –decrease at 24 hours |
||||||
10b-5p |
-1.49 |
1.02 |
-1.75 |
-2.77 |
||
PF – 30 minutes lower than EV – 24 hours further decrease |
||||||
434-3p |
1.28 |
1.68 |
-2.13 |
-3,85 |
Vcan |
Versican – clearance facilitates myoblast fusion |
*499-5p |
1.23 |
1.76 |
-1.28 |
-10.00 |
Sox6 |
Required for the initial steps of differentiation |
411-5p |
1.15 |
1.94 |
-1.92 |
-2.78 |
||
381-3p |
-1.03 |
2.02 |
-3.84 |
-7.14 |
||
410-3p |
-1.06 |
2.07 |
-2.13 |
-3.85 |
||
PF – 30 lower than EV – 24 hours stays constant |
||||||
*206-3p |
1.10 |
7.82 |
-4.35 |
-4.54 |
Pola1 |
Initiation of DNA replication |
127-3p |
1.10 |
1.81 |
-1.47 |
-1.47 |
||
298-5p |
-1.04 |
1.81 |
-1.47 |
-1.47 |
||
PF – increase between 30 minutes to 24 hours – both appreciably lower than EV |
||||||
*133b-3p |
-1.23 |
3.92 |
-2.08 |
-1.09 |
Pitx3 |
Controls ROS on shift to differentiation |
Vector decreased 30 minutes to 24 hours – PF appreciably increased relative to vector |
||||||
PF – 30 minutes increase relative to EV – 24 remains constant |
||||||
320-3p |
1.15 |
-2.86 |
2.74 |
2.40 |
Hspb6 |
Heat shock protein involved in muscle function |
25-3p |
-1.20 |
-1.67 |
1.71 |
1.41 |
||
PF – 30 minutes increase relative to EV – 24 hours decrease to proliferation levels |
||||||
Let-7e-5p |
1.13 |
-2.70 |
1.57 |
1.17 |
Trim71 |
Associates with AGO2 to bind miRNA |
29a-3p |
1.00 |
-1.43 |
2.08 |
-1.12 |
Dnmt3B |
Establishes methylation patters to promote myogenesis |
34a-5p |
-1.01 |
-1.56 |
1.62 |
-1.01 |
Bcl2 |
Anti-apoptotic protein |
Let-7f-5p |
-1.07 |
-1.64 |
1.32 |
1.15 |
||
672-5p |
-1.23 |
-12.50 |
2.96 |
1.03 |
||
*221-3p |
-1.25 |
-3.03 |
2.23 |
-1.25 |
Psmd9 |
Assembles 26S proteasome – required for fusion |
3968 |
-1.37 |
-2.43 |
1.52 |
-1.35 |
||
PF – 30 minutes increase relative to EV – 24 hours decrease to EV levels at 24 hours |
||||||
423-5p |
1.17 |
-1.41 |
1.74 |
-1.54 |
||
31-5p |
-1.07 |
-1.75 |
1.41 |
-1.45 |
Hif1a |
Represses myogenesis by inhibiting Wnt |
92a-3p |
-1.11 |
-1.69 |
1.30 |
-2.22 |
Trp63 |
Required for later stages of myogenesis |
PF – decrease 30 minutes relative to EV – 24 hours increase |
||||||
196a-5p |
1.16 |
-2.43 |
-1.78 |
1.94 |
Hmga2 |
Required for late myogenic progression |
16-5p |
1.01 |
-1.92 |
-1.85 |
-1.42 |
Wnt3a |
Promotes myogenic differentiation |
335-3p |
-1.45 |
-3.84 |
-1/14 |
4.61 |
Ank3 |
Expressed after differentiation; required muscle function |
Vector decreased 30 minutes to 24 hours – PF appreciably decreased relative to vector control |
||||||
155-5p |
1.16 |
-1.96 |
-1.78 |
-2.38 |
Cebpb |
Inhibits myogenic differentiation |
21a-3p |
1.06 |
-3.22 |
-2.78 |
-50.00 |
||
28a-5p |
1.06 |
-1.67 |
-1.45 |
-1.89 |
Srsf1 |
RNA splicing factor |
Similar changes (increased or decreased) between vector and PF from 30 minutes to 24 hours |
||||||
92a-1-5p |
1.24 |
-10.00 |
-1.13 |
-12.50 |
||
344d-3p |
1.21 |
-1.67 |
-1.02 |
-2.50 |
||
351-5p |
-1.16 |
1.75 |
-1.28 |
2.12 |
TNF |
Inhibits expression of mid to late myogenic markers |
98-5p |
-1.29 |
-1.69 |
-1.28 |
-1.42 |
||
*125b-1-3p |
-1.31 |
-3.22 |
-1.35 |
-5.56 |
||
*133b-5p |
-1.67 |
1.69 |
-3.44 |
1.80 |
||
Fold expression changes indicate the miRNA gene expression at 30 minutes or 24 hours relative to levels seen in proliferating cells in cells stably transduced with the empty vector (Vector) or with vector containing PAX3-FOXO1 (PF). The miRNA are separated into individual patterns based on their changes in expression during this time period. The asterisk indicates microRNAs known to be myomiRs. #Minimal change is considered to be miRNA expression between -1.30 and +1.30 fold change relative to proliferation levels.
Examination of the miRNA whose expression changes in both cell types demonstrate that the alterations seen in the presence of PAX3-FOXO1 would effect target gene expression in such a way as to inhibit myogenic differentiation (Table 3). For example, miR-206-3p targets genes that are necessary for maintaining cells in the early myogenic state (Pax7, Fzd7, and Meox2) while also targeting genes necessary for initiating myogenesis (Rarb) or genes whose expression must decrease for myogenesis to progress (Notch3). The changes in miR-206-3p in the negative control (a large increase at 24 hours of expression) would result in target gene expression favorable for promoting myogenesis. In contrast, the presence of PAX3-FOXO1 promotes a large decrease in this miRNA, subsequently increasing the expression of these target genes thereby inhibiting myogenic differentiation. Similar alterations are predicted to negatively effect many biological processes essential for proper myogenesis, including organization of myofibers (miR-128-3p/Runx1 and miR-29a-3p/Dcx), myoblast fusion (miR-434-3p/Vcan, miR-133b-3p/FOXL2, and miR-221-3p/Psmd9), expression of myogenic structural proteins (miR-29a-3p/multiple collagens, miR-34a-5p/Vcl, and miR-335-3p/Ank3), and the initiation of myogenesis (miR-499-5p/Sox6, miR-29a-3p/DNMT3B and 3A, miR-34a-5p/Sirt1, and miR-221-3p/Kit).
DISCUSSION
The extent of differentiation exhibited by cells within a solid tumor is indicative of the behavior of that tumor, in which more undifferentiated cell types usually elicit a more aggressive tumor with a poorer patient prognosis [26]. In this report we demonstrate for the first time that the presence of an oncogenic fusion protein, PAX3-FOXO1, is sufficient to globally alter the expression of miRNA during early muscle differentiation relative to the normal control. The nature of these changes is such that their effects on target genes would be predicted to allow the initiation of cells into the myogenic program while inhibiting fusion and terminal differentiation into myotubes (Tables 1 – 3), which is consistent with our experimental model (Figure 1A and 1B). Since the only difference that exists relative to the normal control cells is the stable expression of PAX3-FOXO1, we conclude that the presence of the oncogenic fusion protein is one of the major contributors driving the undifferentiated tumor phenotype in ARMS.
The results presented here allow us to develop a model by which miRNA changes promote normal myogenesis and by which PAX3-FOXO1 promotes the undifferentiated state characterizing ARMS tumor cells. In normal primary myoblasts we observed 90 individual miRNA with altered expression, each having differing temporal changes in expression over the first 24 hours of differentiation (Tables 1 and 2). A correlation of these miRNA to their validated target genes suggested that these temporal changes would promote the proper progression through myogenesis. For example, miR-133-3p targets several genes (NFATc4, Cdc42, Rhoa, CCND2, SRF, and Prkacb [Table 1]) whose expression must decrease in order for myogenesis to progress. Consistent with this fact, miR-133-3p shows minimal changes in expression at 30 minutes with nearly 3-fold increase by 24 hours, thereby being predicted to decrease the expression of these target genes. Similarly, miR-29a-3p targets genes that either perpetuate myogenesis (Dnmt3B and 3A) or are structural genes necessary for the functioning of mature myofibers (Fbn1, Dcx, and Collagen family members) (Table 3). Therefore, the decrease in the expression of miR-29a-3p would be predicted to increase the expression of these genes important promoting later myogenesis. Taken as a whole, our work presents one of the first demonstrations of the temporal changes of miRNA expression during early myogenic differentiation.
Upon the random and somatic acquisition of the t(2;13)(q35;q14) translocation, an event mirrored in our in vitro model system through the stable transduction of primary myoblasts, the subsequent expression of PAX3-FOXO1 initiates a cascade of direct and indirect downstream events that globally alters miRNA expression, ultimately reprogramming differentiating myoblasts. These changes manifest in three ways: first, the expression of PAX3-FOXO1 prevents the normal changes in expression of 51 miRNA that target many genes essential for positively promoting myogenesis. Second, the fusion protein promotes changes in expression of 43 miRNA not normally changed during differentiation, targeting many genes that would either maintain cells in the early stages of myogenesis or would inhibit the myogenic process. Finally, the presence of PAX3-FOXO1 alters the expression of 39 miRNA relative to normal cells in such a way that these changes would be predicted to negatively affect the myogenic process. Taken together, the overall result of the global PAX3-FOXO1-induced changes in miRNA expression would be to inhibit terminal differentiation and maintain cells in the earlier stages of myogenesis, a prediction that is consistent with our experimental model (Figure 1).
In addition to providing a better understanding of the molecular aspects of how PAX3-FOXO1 contributes to the undifferentiated phenotype of ARMS tumor cells, our results also have clinical implications. A closer examination of our results provides an explanation why present targeted therapies are proving ineffective in clinical trials. Two of these drugs, Cixutumumab and Bevacizumab, each target a single gene that controls important biological processes for tumor progression: cellular proliferation by inhibiting IGF1R and vascularization by inhibiting VEGFA, respectively. Although initially promising, these therapies have not proven effective in Phase I or Phase II clinical trials for ARMS [27-30]. In light of the results presented here, this is not surprising given that in addition to being involved in proliferation and vascularization, IGF1R and VEGF are also important for initiating myogenesis and promoting terminal differentiation [31-34]. We found that PAX3-FOXO1 alters the expression of miRNA in such a way that would be predicted to decrease the expression of both IGF1R and VEGFA (Tables 1 – 3), thereby inhibiting differentiation. Therefore, although being effective in targeting tumor phenotypes in proliferating cells, these two drugs would further decrease the effectiveness of already lowered levels of IGF1R and VEGF, thereby exacerbating the undifferentiated phenotype and the aggressiveness of tumor cells.
Finally, the results presented here have implications for the development of novel therapies for the treatment of ARMS. We previously proposed the use of a multi-faceted regimen that targets genetic, molecular, or biological characteristics of ARMS. This proposed regimen included LiCl to target phosphorylation of PAX3-FOXO1, chloroquine to target the aneuploid state, and Cixutumumab to target growth factor related proliferation [20]. However, the present work argues against the inclusion of Cixutumumab. Instead, we propose to replace the use of Cixutumumab with targeting of select miRNA whose expression is altered by the presence of PAX3-FOXO1. The inhibition or replacement of microRNAs are growing in interest for use as potential cancer therapies [35], in particular as potential targets for differentiation therapy in solid tumors such as ARMS [7]. When combined with LiCl and chloroquine, this multi-faceted regimen would inhibit the activity of PAX3-FOXO1 [36], promote the death of aneuploid cells, which is induced by the presence of the oncogenic fusion protein [20], and potentially reactivate the differentiation process, thereby attacking ARMS tumor cells on multiple different biological fronts. Experiments are ongoing to test this proposed multi-faceted treatment regimen.
MATERIALS AND METHODS
Cell culture conditions and stable transduction of mouse primary myoblasts
Mouse primary myoblasts were isolated from 2 – 4 day old C57/Bl6 mice and cultured in proliferation media as previously described [23]. To induce differentiation, the proliferation media was removed, the cells were washed twice with PBS, and the media was replaced with 10ml of differentiation media, as previously described [23, 24]. All cells were grown on collagen-coated dishes (Becton Dickinson Labware, Bedford, MA), were passage-matched, were not used past passage nine, and were not allowed to grow past approximately 80% confluency.
Mouse primary myoblasts were stably transduced as previously described [23, 37] with the MSCV-IRES-puromycin empty vector or vector containing FLAG epitope-tagged PAX3-FOXO1 (FLAG-PAX3-FOXO1) [21, 22]. Three days post-transduction, cells were selected using puromycin, as previously described [22]. The stably transduced cells were harvested and pooled from three independent transductions to create a single population that express each construct.
Western blot analysis
Stably transduced cells were grown to 80% confluency, harvested, and total cell extracts made, as previously described [21-23, 36]. Equal amounts of total cell lysates (12μg) were separated by 8% SDS-PAGE and analyzed by Western blot analysis using antibodies specific for Pax3, as previously described [21, 22], or MyoD (GenScript, Piscataway, NJ), Myogenein (Abcam, Cambridge, MA), Myosin heavy chain (Abcam), or GAPDH (Cell Signaling, Danvers, MA), according to manufacturers’ specifications.
RNA extraction, cDNA library construction, and cDNA deep sequencing
Primary myoblasts stably expressing empty vector or FLAG-PAX3-FOXO1 were grown to approximately 80% confluency, differentiated for 30 minutes or 24 hours, and total RNA was isolated from the three time points (proliferating and differentiating) using the miRNeasy mini kit (Qiagen), according to the manufacturer’s specifications. MicroRNA were isolated from 4μg total RNA, to generate the cDNA libraries, using the Illumina sample preparation kit according to the manufacturer’s specifications. The cDNA libraries were provided a unique index identifier, allowing the clustering of several samples into a single sequencing lane, and deep sequencing analyses were performed in triplicate from three independent cell growth, RNA isolation, and cDNA library constructions.
miRNA-seq data analysis
Raw fastq sequences were obtained from the Illumina Genome Analyzer II using the “Demultiplex” algorithm in the CASAVA 1.8.2 software (Illumina) that allows the identification of individual samples by “index sequences” contained within the adapters and introduced during the adapter ligation and amplification of the samples. miRNAKey, was used for data analysis at default settings. The pipeline clips the Illumina 3’ adaptor sequences, maps the clipped reads to miRBase and uses the Seq-EM algorithm to estimate the distribution of multiply mapped reads across the observed miRNAs. Sequences less than 16 bases after adaptor clipping were removed. The read counts obtained were then used for differential expression analysis between control and experimental samples using EBSeq from the R package with a False Discovery Rate (FDR) of 5%. We used the default ‘Median Normalization’ in EBSeq to make the counts comparable across samples. Resulting differentially expressed miRNA were analyzed using miRTarBase to identify experimentally validated target genes, with validation by at least two independent experimental methods. Finally, the differentially expressed miRNA and their target genes were analyzed using the Ingenuity Pathway Analysis (Qiagen, Valencia, CA) to identify effected pathways and biological interactions between miRNA target genes.
Author contributions
Jacob M. Loupe, Ph.D.: Dr. Loupe analyzed the deep sequencing data, determined the extent of miRNA expression changes, performed the initial analysis of miRNA target genes and the effects these genes may have on myogenic differentiation, and wrote the first draft of the manuscript.
Patrick J. Miller: Mr. Miller was responsible for all cell growth and cell maintenance, he performed the differentiation assays, isolated miRNA from cells, and created the libraries used for subsequent deep sequencing.
Judy S. Crabtree, Ph.D.: Dr. Crabtree maintained and bred the mice used for the isolation of primary myoblasts, sacrificed the mice and dissected off the hind limbs, and provided the study with the hind leg muscle tissue used to isolate primary myoblasts.
Jovanny Zabaleta, Ph.D.: Dr. Zabaleta performed the quality control analysis on the miRNA libraries and performed all of the deep sequencing described in the manuscript.
Andrew D. Hollenbach, Ph.D.: Dr. Hollenbach was the primary investigator for this project and as such, conceived and originated the project, directed the research, made the final analysis of the data, and wrote the final draft of the manuscript.
ACKNOWLEDGMENTS
All deep sequencing was performed in the LCRC Translational Genomics Core facility.
CONFLICTS OF INTEREST
The authors have no conflicts of interest in the work presented in this manuscript.
FUNDING
Funding for this project is from the National Cancer Institute grant R01CA138656, the Louisiana State University School of Medicine Research Enhancement Bridge Grant, and the Louisiana Cancer Research Consortium (LCRC) (ADH). JZ has been partially supported by grants from the National Institute of General Medicine Sciences (NIGMS) grants P20GM103501, subproject #2, P30GM114732, and U54GM104940-01, and the National Institute on Minority Health and Health Disparities (NIMHD) grants P20MD004817, and U54MD008176-01.
REFERENCES
1. Jogi A, Persson P, Grynfeld A, Pahlman S, Axelson H. Modulation of basic helix-loop-helix transcription complex formation by Id proteins during neuronal differentiation. J Biol Chem. 2002; 277:9118-9126.
2. Jogi A, Vallon-Christersson J, Holmquist L, Axelson H, Borg A, Pahlman S. Human neuroblastoma cells exposed to hypoxia: induction of genes associated with growth, survival, and aggressive behavior. Exp Cell Res. 2004; 295:469-487.
3. Pietras A, Johnsson AS, Pahlman S. The HIF-2alpha-driven pseudo-hypoxic phenotype in tumor aggressiveness, differentiation, and vascularization. Curr Top Microbiol Immunol. 2010; 345:1-20.
4. Eliazer S, Spencer J, Ye D, Olson E, Ilaria RL Jr. Alteration of mesodermal cell differentiation by EWS/FLI-1, the oncogene implicated in Ewing’s sarcoma. Mol Cell Biol. 2003; 23:482-492.
5. Regha K, Assi SA, Tsoulaki O, Gilmour J, Lacaud G, Bonifer C. Developmental-stage-dependent transcriptional response to leukaemic oncogene expression. Nat Commun. 2015; 6:7203.
6. Lai CK, Moon Y, Kuchenbauer F, Starzcynowski DT, Argiropoulos B, Yung E, Beer P, Schwarzer A, Sharma A, Park G, Leung M, Lin G, Vollett S, et al. Cell fate decisions in malignant hematopoiesis: leukemia phenotype is determined by distinct functional domains of the MN1 oncogene. PLoS One. 2014; 9:e112671.
7. Xu WP, Zhang X, Xie WF. Differentiation therapy for solid tumors. J Dig Dis. 2014; 15:159-165.
8. Horn RC Jr, Enterline HT. Rhabdomyosarcoma: a clinicopathological study and classification of 39 cases. Cancer. 1958; 11:181-199.
9. Shapiro DN, Sublett JE, Li B, Downing JR, Naeve CW. Fusion of PAX3 to a member of the forkhead family of transcription factors in human alveolar rhabdomyosarcoma. Cancer Res. 1993; 53:5108-5112.
10. Galili N, Davis RJ, Fredericks WJ, Mukhopadhyay S, Rauscher FJ 3rd, Emanuel BS, Rovera G, Barr FG. Fusion of a fork head domain gene to PAX3 in the solid tumour alveolar rhabdomyosarcoma. Nat Genet. 1993; 5:230-235.
11. Tapscott SJ, Thayer MJ, Weintraub H. Deficiency in rhabdomyosarcomas of a factor required for MyoD activity and myogenesis. Science. 1993; 259:1450-1453.
12. Hosoyama T, Aslam MI, Abraham J, Prajapati SI, Nishijo K, Michalek JE, Zarzabal LA, Nelon LD, Guttridge DC, Rubin BP, Keller C. IL-4R drives dedifferentiation, mitogenesis, and metastasis in rhabdomyosarcoma. Clin Cancer Res. 2011; 17:2757-2766.
13. Lee SJ. Regulation of muscle mass by myostatin. Annu Rev Cell Dev Biol. 2004; 20:61-86.
14. Wang H, Garzon R, Sun H, Ladner KJ, Singh R, Dahlman J, Cheng A, Hall BM, Qualman SJ, Chandler DS, Croce CM, Guttridge DC. NF-kappaB-YY1-miR-29 regulatory circuitry in skeletal myogenesis and rhabdomyosarcoma. Cancer Cell. 2008; 14:369-381.
15. Walters ZS, Villarejo-Balcells B, Olmos D, Buist TW, Missiaglia E, Allen R, Al-Lazikani B, Garrett MD, Blagg J, Shipley J. JARID2 is a direct target of the PAX3-FOXO1 fusion protein and inhibits myogenic differentiation of rhabdomyosarcoma cells. Oncogene. 2014; 33:1148-1157.
16. Lee MH, Jothi M, Gudkov AV, Mal AK. Histone methyltransferase KMT1A restrains entry of alveolar rhabdomyosarcoma cells into a myogenic differentiated state. Cancer Res. 2011; 71:3921-3931.
17. Rota R, Ciarapica R, Giordano A, Miele L, Locatelli F. MicroRNAs in rhabdomyosarcoma: pathogenetic implications and translational potentiality. Mol Cancer. 2011; 10:120.
18. Missiaglia E, Shepherd CJ, Patel S, Thway K, Pierron G, Pritchard-Jones K, Renard M, Sciot R, Rao P, Oberlin O, Delattre O, Shipley J. MicroRNA-206 expression levels correlate with clinical behaviour of rhabdomyosarcomas. Br J Cancer. 2010; 102:1769-1777.
19. Loupe JM, Miller PJ, Bonner BP, Maggi EC, Vijayaraghavan J, Crabtree JS, Taylor CM, Zabaleta J, Hollenbach AD. Comparative transcriptomic analysis reveals the oncogenic fusion protein PAX3-FOXO1 globally alters mRNA and miRNA to enhance myoblast invasion. Oncogenesis. 2016; 5:e246.
20. Loupe JM, Miller PJ, Bonner BP, Maggi EC, Vijayaraghavan J, Zabaleta J, Taylor CM, Tsien F, Crabtree JS, Hollenbach AD. Acquisition of an oncogenic fusion protein serves as an initial driving mutation by inducing aneuploidy and overriding proliferative defects. Oncotarget. 2016; 7:62814-62835. https://doi.org/10.18632/oncotarget.11716.
21. Dietz KN, Miller PJ, Hollenbach AD. Phosphorylation of serine 205 by the protein kinase CK2 persists on Pax3-FOXO1, but not Pax3, throughout early myogenic differentiation. Biochemistry. 2009; 48:11786-11795.
22. Dietz KN, Miller PJ, Iyengar AS, Loupe JM, Hollenbach AD. Identification of serines 201 and 209 as sites of Pax3 phosphorylation and the altered phosphorylation status of Pax3-FOXO1 during early myogenic differentiation. Int J Biochem Cell Biol. 2011; 43:936-945.
23. Miller PJ, Dietz KN, Hollenbach AD. Identification of serine 205 as a site of phosphorylation on Pax3 in proliferating but not differentiating primary myoblasts. Protein Sci. 2008; 17:1979-1986.
24. Miller PJ, Hollenbach AD. The oncogenic fusion protein Pax3-FKHR has a greater post-translational stability relative to Pax3 during early myogenesis. Biochim Biophys Acta. 2007; 1770:1450-1458.
25. Hsu SD, Tseng YT, Shrestha S, Lin YL, Khaleel A, Chou CH, Chu CF, Huang HY, Lin CM, Ho SY, Jian TY, Lin FM, Chang TH, et al. miRTarBase update 2014: an information resource for experimentally validated miRNA-target interactions. Nucleic Acids Res. 2014; 42:D78-D85.
26. Jogi A, Vaapil M, Johansson M, Pahlman S. Cancer cell differentiation heterogeneity and aggressive behavior in solid tumors. Ups J Med Sci. 2012; 117:217-224.
27. Li B, Tsao SW, Chan KW, Ludwig DL, Novosyadlyy R, Li YY, He QY, Cheung AL. Id1-induced IGF2 and its autocrine/endocrine promotion of esophageal cancer progression and chemoresistance - Implications for IGF2 and IGF1R-targeted therapy. Clin Cancer Res. 2014; 20:2651-2662.
28. Weigel B, Malempati S, Reid JM, Voss SD, Cho SY, Chen HX, Krailo M, Villaluna D, Adamson PC, Blaney SM. Phase 2 trial of cixutumumab in children, adolescents, and young adults with refractory solid tumors: a report from the Children’s Oncology Group. Pediatr Blood Cancer. 2014; 61:452-456.
29. D’Adamo DR, Anderson SE, Albritton K, Yamada J, Riedel E, Scheu K, Schwartz GK, Chen H, Maki RG. Phase II study of doxorubicin and bevacizumab for patients with metastatic soft-tissue sarcomas. J Clin Oncol. 2005; 23:7135-7142.
30. Dickson MA, D’Adamo DR, Keohan ML, D’Angelo SP, Carvajal RD, Gounder MM, Maki RG, Qin LX, Lefkowitz RA, McKennon OR, Hirst CM, Schwartz GK, Tap WD. Phase II trial of gemcitabine and docetaxel with bevacizumab in soft tissue sarcoma. Sarcoma. 2015; 2015:532478.
31. Florini JR, Ewton DZ, Roof SL. Insulin-like growth factor-I stimulates terminal myogenic differentiation by induction of myogenin gene expression. Mol Endocrinol. 1991; 5:718-724.
32. Silverman LA, Cheng ZQ, Hsiao D, Rosenthal SM. Skeletal muscle cell-derived insulin-like growth factor (IGF) binding proteins inhibit IGF-I-induced myogenesis in rat L6E9 cells. Endocrinology. 1995; 136:720-726.
33. Bryan BA, Walshe TE, Mitchell DC, Havumaki JS, Saint-Geniez M, Maharaj AS, Maldonado AE, D’Amore PA. Coordinated vascular endothelial growth factor expression and signaling during skeletal myogenic differentiation. Mol Biol Cell. 2008; 19:994-1006.
34. Arsic N, Zacchigna S, Zentilin L, Ramirez-Correa G, Pattarini L, Salvi A, Sinagra G, Giacca M. Vascular endothelial growth factor stimulates skeletal muscle regeneration in vivo. Mol Ther. 2004; 10:844-854.
35. Rothschild SI. microRNA therapies in cancer. Mol Cell Ther. 2014; 2:7.
36. Loupe JM, Miller PJ, Ruffin DR, Stark MW, Hollenbach AD. Inhibiting phosphorylation of the oncogenic PAX3-FOXO1 reduces alveolar rhabdomyosarcoma phenotypes identifying novel therapy options. Oncogenesis. 2015; 4:e145.
37. Hollenbach AD, Sublett JE, McPherson CJ, Grosveld G. The Pax3-FKHR oncoprotein is unresponsive to the Pax3-associated repressor hDaxx. EMBO J. 1999; 18:3702-3711.