
Introduction
Histone demethylases play critical roles in oncogenesis [1, 2]. Lysine-specific demethylase 1 (LSD1) is a nuclear histone demethylase and a member of the flavin adenine dinucleotide (FAD)-dependent amine oxidase (AO) family that functions as an epigenetic regulator. AOs include diverse regulatory enzymes such as lysine-specific demethylases as well as the extracellular matrix lysyl oxidase enzyme family, serum amine oxidases, monoamine oxidases, and vascular adhesion protein-1 [3]. Lysine (K) methylation at specific histone positions—H3K9, H3K27, H3K37 and H4K20 is linked to the formation of tightly packed chromatin and gene silencing; in contrast, methylation of H3K4, H3K36 and H3K39 are associated with actively transcribed regions and gene activation [4]. LSD1 can demethylate H3K4 during gene repression and H3K9 during gene activation, indicating a dual and context-dependent role in transcriptional regulation. For example, LSD1 has a dual role in Notch signaling [5] and is both an activator and repressor of the androgen receptor in prostate cancer [6]. Further, LSD1 is inappropriately upregulated in lung, liver, brain and esophageal cancers through diverse regulatory mechanisms, including transcriptional activation and protein stabilization [7-11]. Inactivation of LSD1 promotes G1 arrest and induces differentiation-specific genes by selectively modulating methylation of H3K4 and H3K9 [12].
In particular, LSD1 promotes cancer initiation, progression and relapse through various mechanisms: supporting cancer initiating cells by increasing expression of the pluripotency-related genes SOX2, OCT4 and NANOG [12]; regulating expression of tumor suppressors such as E-cadherin and p53; and demethylating lysine residues of several non-histone substrates, including p53 [13], Dnmt1 (DNA (cytosine-5) methyltransferase [14] and E2F1 [15]. LSD1-mediated demethylation of H3K4 promotes Myc-induced transcriptional networks [16] and EGF signaling [17]. Importantly, these signaling pathways and genes are either mutated or upregulated in a variety of oral squamous cell carcinomas (OSCCs) [18]. Lastly, LSD1 is involved in epithelial-mesenchymal transitions (EMTs) known to contribute to metastasis of various cancers [19-21]. LSD1 functions in the NuRD nuclear protein complex and via that association contributes to the larger Co-REST complex [8]. Of note, the NuRD complex is recruited by a YAP/TAZ-TEAD complex to deacetylate histones [22]. Thus, an understanding of LSD1 functions will provide a foundation for better understanding epigenetic mechanisms underlying disease progression.
Oral cancer statistics are dismal, with 5-year survival rates of approximately 50 percent [23]. In this study, we investigated LSD1 expression to understand better how it may regulate oral cancer progression. We show that the LSD1 protein, unlike other known demethylases, is specifically deregulated during OSCC metastasis. Our data implicate LSD1 as a regulator of OSCC, highlighting its potential as a therapeutic target for future clinical applications.
Results
LSD1 expression is aberrantly activated during OSCC progression
Immunohistochemistry for LSD1 performed on human clinical specimens representing normal adjacent, dysplastic, hyperplastic and OSCC tissues revealed that LSD1 expression is elevated in tumor tissues (Figure 1A). Next, we evaluated whether LSD1 expression increases during OSCC progression by using a tissue microarray containing a diverse population of 80 tumors of the larynx, tongue and submandibular gland as well as facial and other oral tumor types (Figure 1B). LSD1 staining was more intense in stage IIa- stage Iva tumors (Figure 1B and 1C). To determine if LSD1 is uniquely regulated compared to other histone demethylases, we performed mRNA expression analysis for OSCC using The Cancer Genome Atlas (TCGA) large dataset. We compared the mean expression of lysine-specific demethylase (KDM) genes to the expression of LSD1 (KDM1A mRNA) and additional selected cancer markers observed to be similarly regulated. We also assessed which of the known cancer drivers, KIT, EGFR or MYC, had the closest association with tumor progression. TCGA data analysis showed that LSD1 expression increases with tumor stage (Figure 1D) and tumor grade (Supplementary Figure 1A). TCGA data were also used to rank [using the false discovery rate (FDR)] the average expression levels (row Z-scores) of LSD1, other demethylases and selected genes of interest with respect to tumor stage (Figure 1E) and grade (Supplementary Figure 1). LSD1 gene expression was up-regulated significantly in OSCC stage II and IV tumors. However, for the samples available in the TCGA database, LSD1 expression in stage III tumors was not progressively increased. Thus, the histological and bioinformatic analyses demonstrated that LSD1 is an important regulator of OSCC.
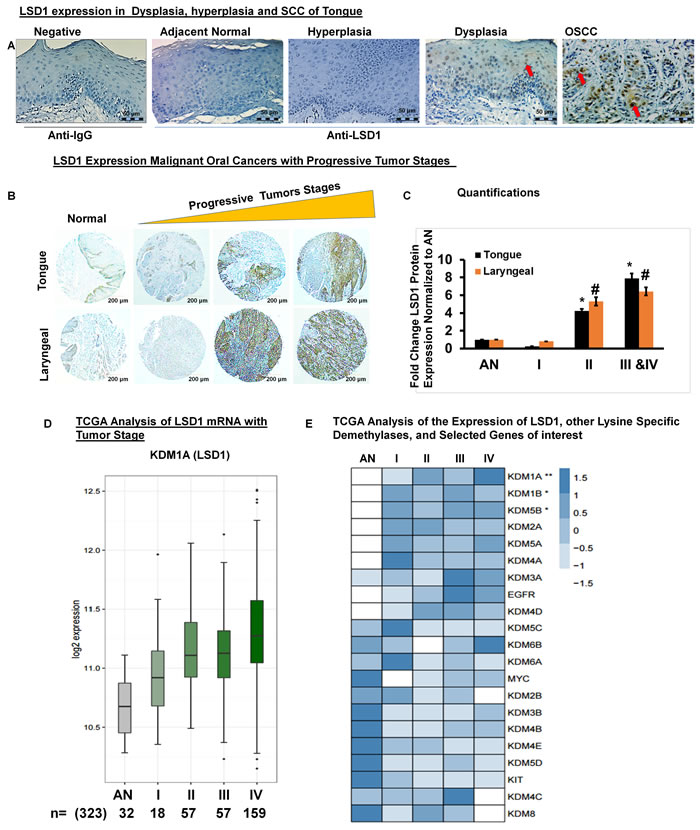
Figure 1: LSD1 is aberrantly expressed in OSCC: A. LSD1 expression in adjacent normal tongue, hyperplastic, dysplastic and OSCC tissue evaluated by immunostaining; B. LSD1 expression in a human tumor microarray containing tissue from a diverse population of 80 malignant oral cancers; C. Quantification of LSD1 staining normalized to adjacent normal (AN) tissue; D. Data from The Cancer Genome Atlas (TCGA) showing the average LSD1 mRNA expression in progressive tumor stages (I-IV) compared to AN tongue tissue and E. A heatmap of the TCGA analysis of different tumor stages showing average expression levels (row Z-scores) for the 21 genes of interest (ranked in increasing order of the false discovery rate (FDR), ***FDR<0.0001, **FDR<0.01 and *FDR<0.05) with respect to expression of LSD1.
LSD1 overexpression promotes OSCC metastasis
To evaluate the physiological effect of LSD1 overexpression on OSCC growth and metastasis, we established HSC-3 cells overexpressing LSD1 and tested them in our previously described oral cancer orthotopic nude mouse model [24-27]. HSC-3-LSD1 cells implanted into the tongue showed extensive growth and metastasis compared to HSC-3-control cells (Figure 2A-2D). Caliper measurements of tongue tumors derived from HSC-3-LSD1 cells showed a progressive increase in tumor volume (Figure 2A). In vivo imaging studies (IVIS) showed increased tumor growth and metastasis at day 24 (Figure 2B and 2C). Thus, LSD1 overexpression induced an aggressive phenotype in HSC-3 cells in vivo. To evaluate the effect of LSD1 loss of function, HSC-3 cells were stably integrated with HSC-3-shLSD1 or NTshRNA (Figure 2E-2H). HSC-3-shLSD1 cells implanted into the orthotopic OSCC model showed a significant reduction in tumor growth, as indicated by a reduction of tongue tumor volume in caliper measurements, and a reduction of metastasis, as indicated by IVIS visualization on day 24. The knockdown of LSD1 inhibited tongue tumor growth and metastasis to internal organs. Thus, overexpression of LSD1 promotes HSC-3-induced tumor growth and metastasis, whereas loss of LSD1 is inhibitory. These data establish that LSD1 is an important driver of OSCC in this orthotopic model.
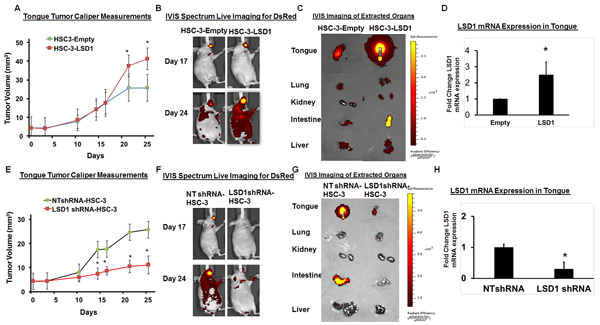
Figure 2: LSD1 overexpression promotes OSCC growth and metastasis: A. HSC-3-LSD1 cells implanted into the tongue of nude mice (n = 5 per condition) grew more than HSC-3-control cells, as evaluated by caliper measurements; B. An in vivo imaging system (IVIS) revealed that on day 17 post-implantation, tumors derived from HSC-3-LSD1 and HSC-3-control cells appeared similar whereas by day 24, the tumors derived from HSC-3-LSD1 cells displayed increased growth and metastasis; C. IVIS imaging of extracted internal organs demonstrating tongue tumor growth and metastasis and D. RT-qPCR analysis of LSD1 expression. E. ShLSD1-HSC-3 cells implanted into the tongue of nude mice (n = 8 per condition) grew dramatically less than HSC-3-control cells, as evaluated by caliper measurements; F. IVIS on day 17 post-implantation revealed only a slight difference in HSC-3-LSD1-derived tumors compared to HSC-3-derived tumors whereas by day 24, HSC-3-LSD1 tumors showed reduced growth and metastasis; G. IVIS imaging of extracted internal organs demonstrating tongue tumor growth and metastasis and H. RT-qPCR analysis of LSD1 expression. Statistical analyses were performed with unpaired Student’s t-tests. * P-value<0.05.
Pharmacological inhibition of LSD1 with GSK-LSD1 attenuates oncogenic properties in metastatic HSC-3 cells
To further characterize the role of LSD1 in OSCC, we evaluated 3 different inhibitors of LSD1: tranylcypromine (TCP), which is a non-selective LSD1 inhibitor that also inhibits monoamine oxidases A and B; and GSK-LSD1 (GlaxoSmithKline) and LSD1-C76 (Xcessbio), which are selective LSD1 inhibitors with 1,000-fold more selectivity for LSD1 than its other isoforms. TCP, GSK-LSD1 and LSD-C76 inhibited proliferation of HSC-3 and CAL-27 cells, but GSK-LSD1 was the most effective inhibitor at 1 µM concentration for both HSC-3 and CAL-27 cells and was therefore used for subsequent studies (Figure 3A).
Microarray analysis from three biological replicates showed that GSK-LSD1 inhibited key genes involved in OSCC growth and metastasis (arranged by lowest to highest FDR value) (Figure 3B). Moreover, gene set enrichment analysis (GSEA) showed that GSK-LSD1 inhibited the complement cascade, NF-kB, and other inflammatory pathways known to be critical in cancer progression and metastasis (Figure 3C).
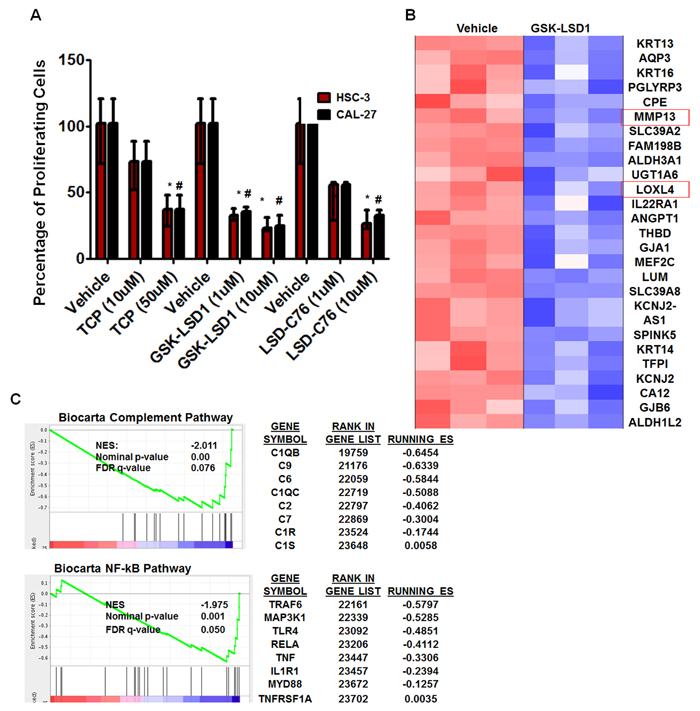
Figure 3: An LSD1 inhibitor (GSK-LSD1) attenuates proliferation and inhibits key targets in HSC-3 cells: A. Inhibition of LSD1 by different inhibitors (n = 6 replicates per treatment), including tranylcypromine (TCP), GSK-LSD1 and LSD1-C76 impaired the proliferation of HSC-3 and CAL-27 cells; B. Microarray and gene set enrichment analysis (GSEA) (n = 3 replicates per treatment) revealed that GSK-LSD1 inhibits key genes and C. GSEA indicated that GSK-LSD1 inhibits specific signaling pathways. Statistical analyses were performed with unpaired Student’s t-tests. The significant differences are indicated with * P-value<0.05 in HSC3 cells and #P-value<0.05 in CAL-27 cells.
GSK-LSD1 attenuates EGF-induced proliferation and signaling
To evaluate cytotoxicity and any non-specific effects of GSK-LSD1, lactate dehydrogenase (LDH) assays were performed. LDH activity was measured at 24 and 48 h in HSC-3 cells treated with different concentrations of GSK-LSD1. The 0.1 and 1 μM doses did not affect LDH release. However, the 10 μM dose increased LDH activity at 48 h (Figure 4A). Additionally, the EGF-induced proliferation of HSC-3 cells was inhibited by 1 and 10 μM GSK-LSD1 (Figure 4B). Molecular signaling analysis showed that GSK-LSD1 inhibits phospho-AKT, -ERK1/2 and -NF-κB-p65 in HSC-3 cells (Figure 4C and 4D). Thus, GSK-LSD1 inhibits EGF-induced signaling and proliferation without cytotoxicity in oral cancer cells. This represents a potential mechanism for the inhibitory effects of GSK-LSD1.
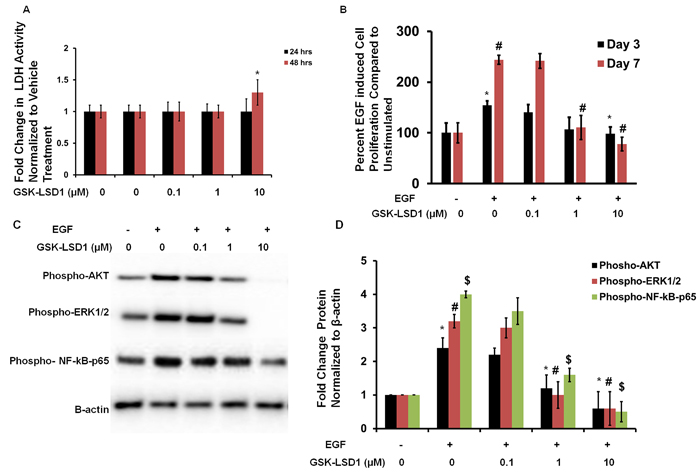
Figure 4: GSK-LSD1 attenuates EGF signaling: A. LDH activity in HSC-3 cells treated with different concentrations of GSK-LSD1 at 24 and 48 hours; B. EGF-induced proliferation in HSC-3 cells is inhibited by GSK-LSD1; C. GSK-LSD1 inhibits phospho-AKT, -ERK1/2 and -NF-κB-p65 in HSC-3 cells and D. quantitation of this inhibition. Statistical analyses were performed with unpaired Student’s t-tests. The significant differences are indicated with *, # or $ P-value<0.005 in respective groups.
Blocking aberrant LSD1 activity down-regulates expression of CTGF, LOXL4, MMP13 and vimentin in pre-existing tonsillar OSCC patient-derived xenograft (PDX) mouse models
We have established unique PDX models in which implantation of 5-mm tumor explants generates tonsillar tumors at 4 months with an average size of 293 mm3. Tonsil SCCs are semisolid cystic tumors, which develop lymph inside the tumor once they start growing in nude mice. Biweekly injection of GSK-LSD1 (10 mg/kg) into animals with xenografts grown for 16 weeks inhibited further xenograft growth, with tumors in inhibitor-injected mice showing a reduction in size by 32 weeks; tumors in vehicle-injected control mice grew significantly larger, reaching volumes up to 3,000 mm3 (Figure 5A and 5B). GSK-LSD1 inhibited tonsillar SCC patient-derived tumor xenografts and inhibited CCN2/CTGF, MMP13, LOXL4 and vimentin expression whereas the expression of the tumor suppressor E-cadherin increased (Figure 5C and 5D). Further, GSK-LSD1 inhibited CTGF expression in PDXs (Figure 5E). Biweekly injection of GSK-LSD1 (10 mg/kg) starting at 20 weeks, when tumor growth was maximal, inhibited further tumor growth (Supplementary Figure 2). However, inhibitor injections post-20 weeks were not as efficient possibly due to the larger sizes of the pre-existing tumors. Thus, GSK-LSD1 inhibits the growth of pre-existing tumors in a PDX model possibly by down-regulating CCN2/CTGF, MMP13, LOXL4 and vimentin expression and restoring E-cadherin function.
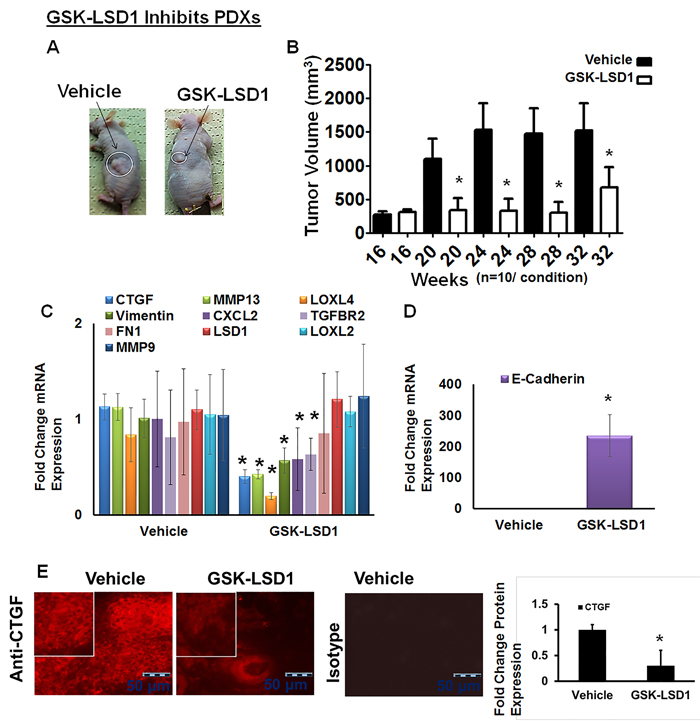
Figure 5: Blocking aberrant LSD1 affects expression of CTGF, LOXL4 and MMP13 in a pre-existing tonsillar OSCC patient-derived xenograft model (PDX): A. GSK-LSD1 injection inhibits the growth of pre-existing tumors as detected at 32 weeks in a tonsillar OSCC PDX model (n = 10 per condition). Statistical analyses were performed with unpaired Student’s t-tests. * P-value<0.05. B. Caliper measurements of tumor volumes; C. GSK-LSD1 reduced the mRNA expression levels of CTGF, MMP13, LOXL4, and Vimentin expression; D. GSK-LSD1 increased the expression of E-cadherin and E. Relative to vehicle injection, GSK-LSD1 injection inhibits CTGF expression in pre-existing tonsillar OSCC PDX tissue sections. Statistical analyses were performed with unpaired Student’s t-tests. * P-value<0.05.
Pharmacological inhibition of LSD1 attenuates distinct oncogenic transcriptional networks
Because studies performed with HSC-3 and CAL-27 cell lines do not to reflect the heterogeneity of tumors, we examined patient-derived primary cells/explants isolated from clinical specimens. These patient-derived tumor cells are likely to mimic the tumor microenvironment since they contain a diverse population of cells enriched with cancer cells. GSK-LSD1 treatment of primary patient-derived cells inhibited the growth of tonsil SCC (TN), myoepithelial (ME) and osteosarcoma (OT) cells. These primary cells have different origins, but after 24 (Figure 6A) and 48 h (Figure 6B), treatment with 1 and 10 µM of the LSD1 specific inhibitors LSD1-C76 (Xcessbio) and GSK-LSD1 (GSK) attenuated their proliferation. Next, microarray analysis demonstrated that inhibition of LSD1 inhibited common differentially expressed genes related to tumor growth and metastasis (Figure 6C). The common gene signature in cells derived from 3 different patients revealed that GSK-LSD1 inhibited CTGF, FLT1 (VEGFR1), ANGPTL4, Serpine 1 and FBN2 (Figure 6C). A heatmap summarizing hallmark gene set enrichments across all three tumor cell types is shown in Figure 7A. Several gene sets were up-regulated across all three tumor-derived isolates, including the p53 pathway and other pro-apoptotic pathways. This is also supported by our data in Figure 4 that GSK-LSD1 inhibits EGF-induced proliferation and signaling pathways. Additionally, Wnt/β-catenin signaling was significantly down-regulated upon GSK-LSD1 treatment in ME cells, while no correlation with GSK-LSD1 treatment was observed in the other two cell types for this pathway. GSEA also showed inhibition of YAP1-, E2F1-, and myc-induced signatures. Although the YAP-induced transcriptional network [28] was inhibited in TN, ME and OT cells, there were differences in the specific genes that were enriched (Figure 7B). Thus, the GSEA analysis identified similarities and some unique differences in the inhibition of specific gene signatures by GSK-LSD1, suggesting that the effects of LSD1 were tumor context-dependent.
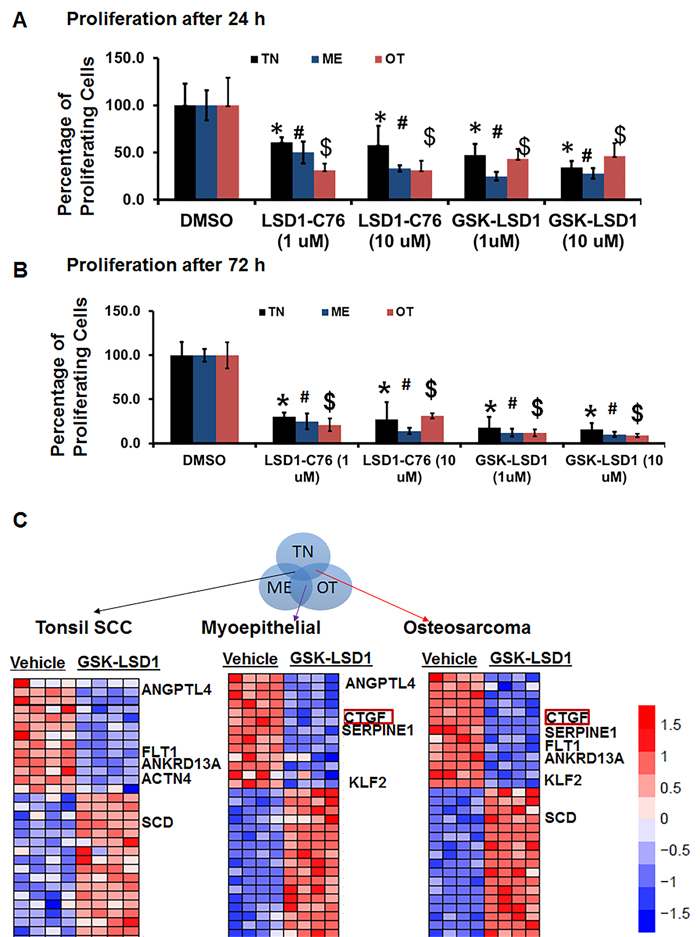
Figure 6: Pharmacological inhibition of LSD1 inhibits CTGF and metastatic OSCC mediators. Patient-derived oral cancer primary cells were used to evaluate the effectiveness of GSK-LSD1 because drugs tested on cell lines such as HSC-3 and CAL-27 may not be effective on primary tumor cells, and there may be differences in molecular targets and signaling pathways. The most common SCC in OSCC arises at the base of the tongue and tonsil. First, we evaluated tonsil SCC primary cells (TN, from 1 patient with 4 biological replicates) to evaluate key targets and signaling pathways regulated by GSK-LSD1. Then, we extended our observations to myoepithelial (ME, from 1 patient with 4 biological replicates) primary tumors which represent 1-2% of OSCCs and have both epithelial and mesenchymal populations, and osteosarcomas (OT, from 1 patient with 4 biological replicates) which are very rare and of mesenchymal origin. A. LSD1 inhibition prevented the proliferation of patient-derived OSCC tumor cells at 24 h; B. LSD1 inhibition prevented the proliferation of patient-derived OSCC tumor cells at 72 h and C. Selected gene signatures showing similarity in genes inhibited or activated by GSK-LSD1 compared to vehicle in patient-derived primary cells isolated from clinical tumors. Statistical analyses were performed with unpaired Student’s t-tests. Statistical analyses were performed with unpaired Student’s t-tests. The significant differences are indicated with *, # or $ P-value<0.005 in respective groups.
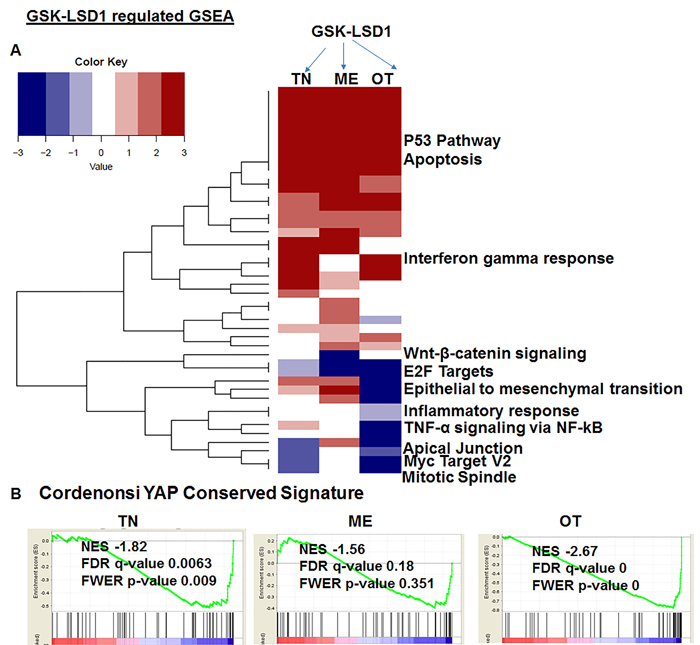
Figure 7: Pharmacological inhibition of GSK-LSD1 inhibits a transcriptional signaling network that induces the expression of CTGF and metastatic OSCC mediators: A. A heatmap of signaling pathways which are activated or repressed; the values plotted in the heatmap are based on the signed FDR values resulting from the GSEA analysis of GSK-LSD1 treatment vs control treatment with respect to hallmark gene sets (n = 50) and B. Comparative analysis of YAP1-induced GSEA in 3 different primary cell types.
GSK-LSD1 restores global dimethylation
We performed functional analysis of expression of H3K4me2 and clonogenic survival (Figure 8A and 8B) after treatment with GSK-LSD1. GSK-LSD1 inhibited clonogenic survival by more than 70% in HSC-3 and CAL-27 cells (Figure 8A). As shown in Figure 7B, GSK-LSD1 inhibited LSD1 protein expression while restoring levels of dimethylated histone H3 (H3K4me2). Thus, pharmacological inhibition of LSD1 inhibited expression of key genes and signaling networks leading to reduced cell proliferation and clonogenic survival while restoring H3K4me levels. Collectively, these results align changes in LSD1 expression with histone methylation status and with functional outcomes.
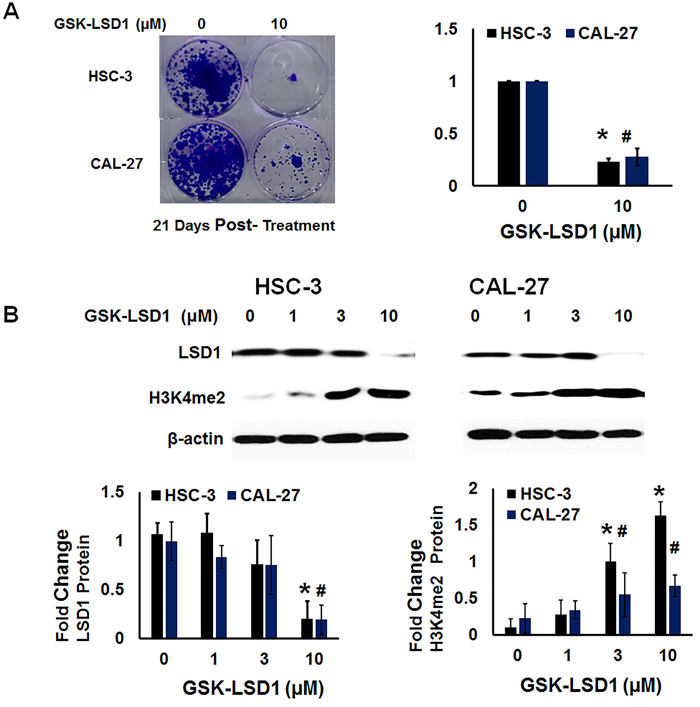
Figure 8: LSD1 inhibition restores dimethylation and inhibits clonogenic survival of non-metastatic CAL-27 and metastatic HSC-3 cells in vitro: A. Clonogenic survival was inhibited more than 70% in HSC-3 and CAL-27 cells treated with GSK-LSD1 and B. GSK-LSD1 reduced LSD1 protein expression and restored dimethylation of histone H3 (H3K4me2). Statistical analyses were performed with unpaired Student’s t-tests. The significant differences are indicated with * or # P-value<0.05 in respective groups.
Discussion
Locoregional spread and metastasis to lymph nodes are the leading causes of poor patient outcomes in OSCC. Treatment for OSCC frequently involves a combination of surgery, radiotherapy, and chemotherapy. However, resistance to therapy is a challenge, and the average 5-year survival rate remains approximately 50%. Here, we show that one of the mechanisms underlying the aggressive features of OSCC is aberrant activation of LSD1. We align LSD1 expression with demethylation of H3K4me2 and with inappropriate activation of the YAP1-CTGF axis and LOXL4 expression. Importantly, our studies suggest that pharmacological inhibition of LSD1 is likely to attenuate aggressive OSCC.
LSD1 regulates the balance between H3K4 and H3K9 dimethylation with H3K27 trimethylation, or between active chromatin, heterochromatin, and repressed chromatin states [29, 30]. LSD1 demethylates histone and non-histone genes by removing mono- and dimethyl groups from histone H3 at lysine 4 (H3K4me1/2). LSD1 is a potential target of metastatic OSCC therapy, as suggested by this study which demonstrates that LSD1 expression is increased in human malignant OSCCs of the oral cavity and that its expression tracks with progressive staging.
This study provides evidence that GSK-LSD1 regulates EGF-mediated signaling pathways and network. LSD1 regulates orthotopic oral cancer metastasis in vivo (Figure 2). OSCCs are of epithelial origin and their locoregional spread and metastasis are likely to rely on the EMT process. We used different tumor types including epithelial tonsil SCC (TN) which is abundant in head and neck squamous cell carcinoma (HNSCC); myoepithelial tumors (ME), which constitute between 1-2% of total OSCC and have a combined epithelial and mesenchymal origin; and osteosarcoma (OT), a very rare tumor of mesenchymal origin. GSK-LSD1 inhibits the EMT-related target gene vimentin and up-regulates E-cadherin. Small molecule specific inhibitors of LSD1 have been developed by GlaxoSmithKline (GSK1-LSD1; GSK2879552) [31] and they are in phase 1 clinical trials for lung cancer. Previous studies have shown that Pargyline, a nonspecific inhibitor of LSD1, interfered with the EMT of prostate cancer in vivo, and the lysine-specific demethylase UTX inhibited EMT-induced breast cancer stem cell properties by epigenetic repression of EMT genes in cooperation with LSD1 and HDAC1 [32, 33]. GSK-LSD1 inhibited CTGF and other oncogenic factors in TN, ME and OT primary patient-derived cells in vitro (Supplementary Figure 3). Here, we show that pharmacological inhibition of LSD1 inhibits the aggressive features of OSCC by inhibiting key target genes that function in the tumor microenvironment and EMT, including CCN2/CTGF, MMP13, LOXL4 and vimentin.
GSEA analysis showed that pharmacological inhibition of LSD1 abrogated the EGF and YAP1 signaling network. Previous studies have shown that CTGF promotes EGF signaling, the central signaling pathway in OSCC [34]. Since LSD1 can mediate EGF signaling [17] during oncogenesis, we conclude that inhibition of LSD1 can attenuate CTGF, an activator of EGF signaling in aggressive OSCC. The GSK-LSD1 regulated hallmark and oncogenic signaling networks are provided in Supplementary Tables 1 and 2.
This study is the first to demonstrate that pharmacological inhibition of LSD1 in OSCC and other cancer types attenuates the YAP1 oncogenic pathway. CTGF and YAP collaborate to promote tumor growth and metastasis, and CTGF itself is a downstream target of YAP [35, 36]. Further, CTGF is a downstream effector of LSD1, which is itself a component of the NuRD co-repressor complex [8] recruited by the YAP/TAZ-TEAD complex to deacetylate histones and alter nucleosome occupancy at target genes [22]. Thus, LSD1 and YAP1 are also likely to collaborate to induce CTGF activation in OSCC.
In conclusion, our data reveal that 1) LSD1 is aberrantly activated in metastatic OSCC, and increases in LSD1 expression correlate with advanced disease; 2) LSD1 overexpression increases metastatic OSCC in orthotopic oral cancer mouse models; 3) pharmacological inhibition of LSD1 attenuates ECM and EMT-related genes such as CTGF, LOXL4, MMP13 and vimentin and increases E-cadherin expression in patient-derived pre-existing xenografts and cellular models; 4) GSK-LSD1 inhibits EGF-induced signaling and proliferation without cytotoxicity in oral cancer ; and 5) LSD1 inhibition is likely to regulate the EGF and YAP1 signaling network. Thus, our findings have potential prognostic and therapeutic application in the clinical management of OSCC.
Materials and methods
Human tissues and animal experimental approval
For experiments using human tissue, informed consent was obtained from patients at the Boston University Medical Center. Mouse experiments were reviewed and approved by the Institutional Animal Care and Use Committee (IACUC #AN-15390).
LSD1 immunostaining
Normal, dysplastic, hyperplastic and oral SCC tissue sections were stained with the anti-LSD1 antibody (Abcam: ab17221). Similarly, a tissue microarray (US Biomax, HN802a), which has 80 tissue samples representing different tumor grades and stages was stained with the anti-LSD1 antibody (Abcam: ab17221,1 g/ml). Quantitation of staining was performed using Image J software (NIH) with the IHC profiler plugin for DAB immunostaining analysis [37]. Each image from the tissue microarray was deconvoluted in the IHC profiler plugin to obtain different measurements for DAB and hematoxylin. Parameters were set to measure the mean, min, and max intensities for stained regions, and data were obtained from several regions. The log value of the average max intensity was calculated. The fold changes in expression compared to respective controls (AN) are indicated in the graph.
Expression analysis of The Cancer Genome Atlas OSCC data
RNA-sequencing (RNASeq) and matched clinical data corresponding to primary human OSSC samples from The Cancer Genome Atlas (TCGA) were obtained as previously described [38]. Box plots of the expression values (log2-transformed) for genes of interest were generated with respect to tumor grade, after removing samples with missing grade information. Positive association of the expression of select genes with respect to tumor progression was tested by comparing adjacent tumor grades (i.e. grade 2 vs grade 1, grade 3 vs grade 2, and grade 4 vs grade 3) using a one-tailed t-test, and the p-values combined per gene as previously described [39]. P-values were adjusted for multiple hypothesis testing across all genes being compared using the false discovery rate (FDR) to obtain the reported q-values. The association of LSD1 (KDM1A) compared to other lysine-specific demethylases and histological tumor grade and stage from TCGA oral cancer RNAseq datasets of 343 OSCC specimens was also evaluated.
In vitro assays
Proliferation assays were performed by plating HSC-3 cells and CAL-27 cells (20,000 cells per well, 6-replicates per treatment) overnight. The next day, cells were treated for 48 h with a vehicle control, or the LSD1 inhibitors tranylcypromine (TCP), GSK-LSD1 or LSD-C76 and the proliferation percentage was evaluated by the CyQuant assay. The effect of EGF on proliferation was evaluated using HSC-3 cells (20,000 cells per well, 6 replicates per treatment) and was evaluated by the CyQuant assay at different time points. EGF-induced signaling pathways were evaluated in HSC-3 cells (200,000 cells per well) and evaluated by Western blot analysis as previously described [40, 41]. LDH based cytotoxicity assays were performed on HSC-3 cells (20,000 cells per well, 6-replicates per treatment) per the manufacturer’s instructions (Promega, Inc) [42]. To determine the effect of LSD1 inhibition on clonogenic survival, a total of 500 HSC-3 or CAL-27 cells were plated and incubated for 24 h with 0 or 10 µM GSK-LSD1, allowed to grow for 21 days, then stained with 0.1% crystal violet.
Orthotropic OSCC mouse model
Short Tandem Repeat based authentication of HSC-3 cells were performed by Cell Line Authentication Services (Genetica DNA Laboratories). The orthotopic OSCC mouse model was established by implantation of HSC-3-DsRed cells to evaluate OSCC growth and metastasis. The details of this protocol were published previously [27]. To determine the effect of LSD1 inhibition in vivo, HSC-3- shLSD1 and HSC-3- NTshRNA cells were prepared by transducing DsRed expressing HSC-3 cells with shLSD1 or NT-shRNA lentivirus particles, respectively, and implanted into the tongues of nude mice [27]. Tumor growth and metastasis were evaluated by tongue tumor caliper measurements and live in vivo imaging using the IVIS twice a week for 4 weeks post-implantation. Next, to evaluate the effect of LSD1 overexpression, HSC-3 DsRed cells were infected with PLX-304-CMV-LSD1-V5 or PLX-304-CMV-Empty-V5 lentivirus particles to generate HSC-3 LSD1 and HSC-3 control cells, respectively. HSC-3 control and HSC-3 LSD1 cells were injected into the tongues of mice (n = 5 per condition), and the mice were monitored for tongue tumor growth by caliper measurements and the IVIS twice a week for 4 weeks.
Patient-derived head and neck cancer cells
Cells were derived from patients with recurrent tonsillar epithelial, myoepithelial and osteosarcoma tumors. Freshly isolated tumor tissues were resected into 0.5 mm pieces and grown in the presence of reduced serum and growth factors. Primary tumor cells were trypsinized along with the remaining small tissue explant and used in different experiments. Cells from the same preparations were also tested in an orthotopic patient-derived mouse model for the formation of tumors. Of note, the tonsil SCC from a non-smoker was p16 + as evaluated at a diagnostic pathology laboratory. Cell proliferation assays were performed using the CyQuant assay as indicated above.
Microarray analysis
HSC-3, tonsillar SCC, myoepithelial, and oral osteosarcoma cells were grown in 6-well plates on matrigel for 24 h. Cells were then treated with 1 µM LSD-GSK1 or vehicle (n = 4 biological replicates per condition) in respective groups for 48 h in serum-free media. Total RNA was isolated and subjected to microarray analysis. Affymetrix GeneChip Human Gene 2.0 ST CEL files were normalized to produce gene-level expression values using the implementation of the Robust Multiarray Average (RMA) [43] in the Affymetrix package (version 1.36.1) [44] included in the Bioconductor software suite (version 2.12) [45] and an Entrez Gene-specific probeset mapping (version 17.0.0) from the Molecular and Behavioral Neuroscience Institute (Brainarray) at the University of Michigan [46]. Array quality was assessed by computing Relative Log Expression (RLE) and Normalized Unscaled Standard Error (NUSE) using the affyPLM Bioconductor package (version 1.34.0). Pairwise differential expression was assessed using the moderated (empirical Bayesian) t-test implemented in the limma package (version 3.14.4) (i.e., creating simple linear models with lmFit, followed by empirical Bayesian adjustment with eBayes). A fold change of 2 indicates 2-fold higher expression in GSK-LSD1 treated cells relative to expression in vehicle treated cells. Correction for multiple hypothesis testing was accomplished using the Benjamini-Hochberg false discovery rate (FDR) and represented as FDR q values. All statistical analyses were performed using the R environment for statistical computing (version 2.15.1). Gene set enrichment analysis (GSEA) of the treatment signatures was performed using the pre-ranked GSEA functionality within the GSEA Desktop software (v2.2.2), with the t-test statistic of treatment vs no-treatment control for each cell line as the ranking variable. Gene sets queried obtained from MSigDB (http://software.broadinstitute.org/gsea/msigdb/).
PDX model
Freshly isolated human tonsillar epithelial tumors were cut into small pieces using a 4 mm biopsy punch, mixed with Matrigel, and implanted on the back of nude mice to yield the P0 generation. Tumors were allowed to grow for 3 months after which they were transferred into nude mice (P1 generation). These P1 generation tumors were allowed to grow for 16 weeks in n = 20 mice. The mice were then divided into 2 groups: half of the mice were treated with vehicle (n = 10) and half with GSK-LSD1 (n = 10, 10 mg/kg) twice a week by subcutaneous injection near the tumor margin without damaging the tumor implant. The mice were sacrificed after 32 weeks of vehicle or GSK-LSD1 treatment, and tumor tissues were collected for RNA analyses.
Immunofluorescence of human tissue sections with anti-CTGF
Human tissues from PDX models were fixed in 4% paraformaldehyde overnight, paraffin embedded, and sectioned. For immunofluorescence, the tissue sections were incubated with CTGF-specific antibodies (Abcam) or an isotype control antibody followed by biotin-conjugated secondary antibodies. The fluorescent signal was developed with streptavidin conjugated Texas Red. An anti-fade reagent was added to each sample prior to imaging. Quantification of images was performed using Image J software (NIH), as shown previously [47]. The fold-changes in expression compared to respective controls are indicated in the graph.
Molecular analysis
Total RNA was extracted in Trizol according to the manufacturer’s instructions (Qiagen). Quantitative real-time PCR (RT-qPCR) analysis was performed using TaqMan gene expression assays from Life Technologies, according to a standard protocol [48].
Author contributions
Manish Bais: conceived and designed the study, performed experiments, collected, analyzed, and interpreted the data and wrote the manuscript. Saqer Alsaqer, Mustafa Tashkandi, Vinay Kartha, Ya-Ting, and Yazeed Alkherij: performed experiments. Andrew Salama: identified the oral cancer patients, performed surgical procedures and provided samples for further analysis. Xaralabos Varelas: assisted with manuscript conception and data interpretation. Maria Kukuruzinska: edited the manuscript and provided clinically characterized tumors. Stefano Monti: analyzed and interpreted the microarray and GSEA data and edited the manuscript.
Acknowledgments
The authors acknowledge NIH/NIDCR (R03DE025274) funding, Oral Cancer Affinity Research Collaborative ARC funding (EPOC ARC account 9950000118), CTSI pilot funding and Center of Nanoscience, Boston University to Manish V. Bais. The authors acknowledge Philip Trackman for laboratory resources, and Tom Balon and the IVIS imaging core for the in vivo imaging studies. The authors thank Yuriy Alekseyev and for the gene array experiments and Adam Gower and CTSA grant U54-TR001012A for microarray data analysis. We acknowledge dbGaP for granting access to the TCGA data (phs000178.v9.p8).
Conflicts of interest
All authors declare that they have no conflicts of interest regarding the contents of this manuscript.
References
1. Hoffmann I, Roatsch M, Schmitt ML, Carlino L, Pippel M, Sippl W, Jung M. The role of histone demethylases in cancer therapy. Mol Oncol. 2012; 6:683-703. doi: 10.1016/j.molonc.2012.07.004.
2. Thinnes CC, England KS, Kawamura A, Chowdhury R, Schofield CJ, Hopkinson RJ. Targeting histone lysine demethylases - progress, challenges, and the future. Biochim Biophys Acta. 2014; 1839:1416-32. doi: 10.1016/j.bbagrm.2014.05.009.
3. Gaweska H, Fitzpatrick PF. Structures and Mechanism of the Monoamine Oxidase Family. Biomol Concepts. 2011; 2:365-77. doi: 10.1515/BMC.2011.030.
4. Martin C, Zhang Y. The diverse functions of histone lysine methylation. Nat Rev Mol Cell Biol. 2005; 6:838-49. doi: 10.1038/nrm1761.
5. Yatim A, Benne C, Sobhian B, Laurent-Chabalier S, Deas O, Judde JG, Lelievre JD, Levy Y, Benkirane M. NOTCH1 nuclear interactome reveals key regulators of its transcriptional activity and oncogenic function. Mol Cell. 2012; 48:445-58. doi: 10.1016/j.molcel.2012.08.022.
6. Cai C, He HH, Gao S, Chen S, Yu Z, Gao Y, Chen S, Chen MW, Zhang J, Ahmed M, Wang Y, Metzger E, Schule R, et al. Lysine-specific demethylase 1 has dual functions as a major regulator of androgen receptor transcriptional activity. Cell Rep. 2014; 9:1618-27. doi: 10.1016/j.celrep.2014.11.008.
7. Wu Y, Wang Y, Yang XH, Kang T, Zhao Y, Wang C, Evers BM, Zhou BP. The deubiquitinase USP28 stabilizes LSD1 and confers stem-cell-like traits to breast cancer cells. Cell Rep. 2013; 5:224-36. doi: 10.1016/j.celrep.2013.08.030.
8. Wang Y, Zhang H, Chen Y, Sun Y, Yang F, Yu W, Liang J, Sun L, Yang X, Shi L, Li R, Li Y, Zhang Y, et al. LSD1 is a subunit of the NuRD complex and targets the metastasis programs in breast cancer. Cell. 2009; 138:660-72. doi: 10.1016/j.cell.2009.05.050.
9. Lv T, Yuan D, Miao X, Lv Y, Zhan P, Shen X, Song Y. Over-expression of LSD1 promotes proliferation, migration and invasion in non-small cell lung cancer. PLoS One. 2012; 7:e35065. doi: 10.1371/journal.pone.0035065.
10. Ding J, Zhang ZM, Xia Y, Liao GQ, Pan Y, Liu S, Zhang Y, Yan ZS. LSD1-mediated epigenetic modification contributes to proliferation and metastasis of colon cancer. Br J Cancer. 2013; 109:994-1003. doi: 10.1038/bjc.2013.364.
11. Amente S, Lania L, Majello B. The histone LSD1 demethylase in stemness and cancer transcription programs. Biochim Biophys Acta. 2013; 1829:981-6. doi: 10.1016/j.bbagrm.2013.05.002.
12. Zhang X, Lu F, Wang J, Yin F, Xu Z, Qi D, Wu X, Cao Y, Liang W, Liu Y, Sun H, Ye T, Zhang H. Pluripotent Stem Cell Protein Sox2 Confers Sensitivity to LSD1 Inhibition in Cancer Cells. Cell Rep. 2013; 5:445-57. doi: 10.1016/j.celrep.2013.09.018.
13. Huang J, Sengupta R, Espejo AB, Lee MG, Dorsey JA, Richter M, Opravil S, Shiekhattar R, Bedford MT, Jenuwein T, Berger SL. p53 is regulated by the lysine demethylase LSD1. Nature. 2007; 449:105-8. doi: 10.1038/nature06092.
14. Wang J, Hevi S, Kurash JK, Lei H, Gay F, Bajko J, Su H, Sun W, Chang H, Xu G, Gaudet F, Li E, Chen T. The lysine demethylase LSD1 (KDM1) is required for maintenance of global DNA methylation. Nat Genet. 2009; 41:125-9. doi: 10.1038/ng.268.
15. Kontaki H, Talianidis I. Lysine methylation regulates E2F1-induced cell death. Mol Cell. 2010; 39:152-60. doi: 10.1016/j.molcel.2010.06.006.
16. Amente S, Bertoni A, Morano A, Lania L, Avvedimento EV, Majello B. LSD1-mediated demethylation of histone H3 lysine 4 triggers Myc-induced transcription. Oncogene. 2010; 29:3691-702. doi: 10.1038/onc.2010.120.
17. Shao G, Wang J, Li Y, Liu X, Xie X, Wan X, Yan M, Jin J, Lin Q, Zhu H, Zhang L, Gong A, Shao Q, et al. Lysine-specific demethylase 1 mediates epidermal growth factor signaling to promote cell migration in ovarian cancer cells. Sci Rep. 2015; 5:15344. doi: 10.1038/srep15344.
18. Cancer Genome Atlas Network. Comprehensive genomic characterization of head and neck squamous cell carcinomas. Nature. 2015; 517:576-82. doi: 10.1038/nature14129.
19. Feng J, Xu G, Liu J, Zhang N, Li L, Ji J, Zhang J, Zhang L, Wang G, Wang X, Tan J, Huang B, Lu J, et al. Phosphorylation of LSD1 at Ser112 is crucial for its function in induction of EMT and metastasis in breast cancer. Breast Cancer Res Treat. 2016; 159:443-56. doi: 10.1007/s10549-016-3959-9.
20. Lin T, Ponn A, Hu X, Law BK, Lu J. Requirement of the histone demethylase LSD1 in Snai1-mediated transcriptional repression during epithelial-mesenchymal transition. Oncogene. 2010; 29:4896-904. doi: 10.1038/onc.2010.234.
21. Lin Y, Wu Y, Li J, Dong C, Ye X, Chi YI, Evers BM, Zhou BP. The SNAG domain of Snail1 functions as a molecular hook for recruiting lysine-specific demethylase 1. EMBO J. 2010; 29:1803-16. doi: 10.1038/emboj.2010.63.
22. Kim M, Kim T, Johnson RL, Lim DS. Transcriptional co-repressor function of the hippo pathway transducers YAP and TAZ. Cell Rep. 2015; 11:270-82. doi: 10.1016/j.celrep.2015.03.015.
23. Rothenberg SM, Ellisen LW. The molecular pathogenesis of head and neck squamous cell carcinoma. J Clin Invest. 2012; 122:1951-7.
24. Stanford EA, Ramirez-Cardenas A, Wang Z, Novikov O, Alamoud K, Koutrakis P, Mizgerd JP, Genco CA, Kukuruzinska M, Monti S, Bais MV, Sherr DH. Role for the Aryl Hydrocarbon Receptor and Diverse Ligands In Oral Squamous Cell Carcinoma Migration and Tumorigenesis. Mol Cancer Res. 2016. doi: 10.1158/1541-7786.MCR-16-0069.
25. Ozdener GB, Bais MV, Trackman PC. Determination of cell uptake pathways for tumor inhibitor lysyl oxidase propeptide. Mol Oncol. 2016; 10:1-23. doi: 10.1016/j.molonc.2015.07.005.
26. Hiemer SE, Zhang L, Kartha VK, Packer TS, Almershed M, Noonan V, Kukuruzinska M, Bais MV, Monti S, Varelas X. A YAP/TAZ-Regulated Molecular Signature Is Associated with Oral Squamous Cell Carcinoma. Mol Cancer Res. 2015; 13:957-68. doi: 10.1158/1541-7786.MCR-14-0580.
27. Bais MV, Kukuruzinska M, Trackman PC. Orthotopic non-metastatic and metastatic oral cancer mouse models. Oral Oncol. 2015; 51:476-82. doi: 10.1016/j.oraloncology.2015.01.012.
28. Cordenonsi M, Zanconato F, Azzolin L, Forcato M, Rosato A, Frasson C, Inui M, Montagner M, Parenti AR, Poletti A, Daidone MG, Dupont S, Basso G, et al. The Hippo transducer TAZ confers cancer stem cell-related traits on breast cancer cells. Cell. 2011; 147:759-72. doi: 10.1016/j.cell.2011.09.048.
29. Goldberg AD, Allis CD, Bernstein E. Epigenetics: a landscape takes shape. Cell. 2007; 128:635-8. doi: 10.1016/j.cell.2007.02.006.
30. Albert M, Peters AH. Genetic and epigenetic control of early mouse development. Curr Opin Genet Dev. 2009; 19:113-21. doi: 10.1016/j.gde.2009.03.004.
31. Mohammad HP, Smitheman KN, Kamat CD, Soong D, Federowicz KE, Van Aller GS, Schneck JL, Carson JD, Liu Y, Butticello M, Bonnette WG, Gorman SA, Degenhardt Y, et al. A DNA Hypomethylation Signature Predicts Antitumor Activity of LSD1 Inhibitors in SCLC. Cancer Cell. 2015; 28:57-69. doi: 10.1016/j.ccell.2015.06.002.
32. Wang M, Liu X, Guo J, Weng X, Jiang G, Wang Z, He L. Inhibition of LSD1 by Pargyline inhibited process of EMT and delayed progression of prostate cancer in vivo. Biochem Biophys Res Commun. 2015; 467:310-5. doi: 10.1016/j.bbrc.2015.09.164.
33. Choi HJ, Park JH, Park M, Won HY, Joo HS, Lee CH, Lee JY, Kong G. UTX inhibits EMT-induced breast CSC properties by epigenetic repression of EMT genes in cooperation with LSD1 and HDAC1. EMBO Rep. 2015; 16:1288-98. doi: 10.15252/embr.201540244.
34. Rayego-Mateos S, Rodrigues-Diez R, Morgado-Pascual JL, Rodrigues Diez RR, Mas S, Lavoz C, Alique M, Pato J, Keri G, Ortiz A, Egido J, Ruiz-Ortega M. Connective tissue growth factor is a new ligand of epidermal growth factor receptor. J Mol Cell Biol. 2013; 5:323-35. doi: 10.1093/jmcb/mjt030.
35. Chen PS, Wang MY, Wu SN, Su JL, Hong CC, Chuang SE, Chen MW, Hua KT, Wu YL, Cha ST, Babu MS, Chen CN, Lee PH, et al. CTGF enhances the motility of breast cancer cells via an integrin-alphavbeta3-ERK1/2-dependent S100A4-upregulated pathway. J Cell Sci. 2007; 120:2053-65. doi: 10.1242/jcs.03460.
36. Di Benedetto A, Mottolese M, Sperati F, Ercolani C, Di Lauro L, Pizzuti L, Vici P, Terrenato I, Sperduti I, Shaaban AM, Sundara-Rajan S, Barba M, Speirs V, et al. The Hippo transducers TAZ/YAP and their target CTGF in male breast cancer. Oncotarget. 2016; 7:43188-98. doi: 10.18632/oncotarget.9668.
37. Varghese F, Bukhari AB, Malhotra R, De A. IHC Profiler: an open source plugin for the quantitative evaluation and automated scoring of immunohistochemistry images of human tissue samples. PLoS One. 2014; 9:e96801. doi: 10.1371/journal.pone.0096801.
38. Kartha VK, Stawski L, Han R, Haines P, Gallagher G, Noonan V, Kukuruzinska M, Monti S, Trojanowska M. PDGFRbeta Is a Novel Marker of Stromal Activation in Oral Squamous Cell Carcinomas. PLoS One. 2016; 11:e0154645. doi: 10.1371/journal.pone.0154645.
39. Dai H, Leeder JS, Cui Y. A modified generalized Fisher method for combining probabilities from dependent tests. Front Genet. 2014; 5:32. doi: 10.3389/fgene.2014.00032.
40. Bais MV, Ozdener GB, Sonenshein GE, Trackman PC. Effects of tumor-suppressor lysyl oxidase propeptide on prostate cancer xenograft growth and its direct interactions with DNA repair pathways. Oncogene. 2015; 34:1928-37. doi: 10.1038/onc.2014.147.
41. Bais MV, Nugent MA, Stephens DN, Sume SS, Kirsch KH, Sonenshein GE, Trackman PC. Recombinant lysyl oxidase propeptide protein inhibits growth and promotes apoptosis of pre-existing murine breast cancer xenografts. PLoS One. 2012; 7:e31188. doi: 10.1371/journal.pone.0031188.
42. Huber JM, Amann A, Koeck S, Lorenz E, Kelm JM, Obexer P, Zwierzina H, Gamerith G. Evaluation of assays for drug efficacy in a three-dimensional model of the lung. J Cancer Res Clin Oncol. 2016; 142:1955-66. doi: 10.1007/s00432-016-2198-0.
43. Irizarry RA, Hobbs B, Collin F, Beazer-Barclay YD, Antonellis KJ, Scherf U, Speed TP. Exploration, normalization, and summaries of high density oligonucleotide array probe level data. Biostatistics. 2003; 4:249-64. doi: 10.1093/biostatistics/4.2.249.
44. Gautier L, Cope L, Bolstad BM, Irizarry RA. affy—analysis of Affymetrix GeneChip data at the probe level. Bioinformatics. 2004; 20:307-15. doi: 10.1093/bioinformatics/btg405.
45. Gentleman RC, Carey VJ, Bates DM, Bolstad B, Dettling M, Dudoit S, Ellis B, Gautier L, Ge Y, Gentry J, Hornik K, Hothorn T, Huber W, et al. Bioconductor: open software development for computational biology and bioinformatics. Genome Biol. 2004; 5:R80. doi: 10.1186/gb-2004-5-10-r80.
46. Dai M, Wang P, Boyd AD, Kostov G, Athey B, Jones EG, Bunney WE, Myers RM, Speed TP, Akil H, Watson SJ, Meng F. Evolving gene/transcript definitions significantly alter the interpretation of GeneChip data. Nucleic Acids Res. 2005; 33:e175. doi: 10.1093/nar/gni179.
47. McCloy RA, Rogers S, Caldon CE, Lorca T, Castro A, Burgess A. Partial inhibition of Cdk1 in G 2 phase overrides the SAC and decouples mitotic events. Cell Cycle. 2014; 13:1400-12. doi: 10.4161/cc.28401.
48. Bais MV, Wigner N, Young M, Toholka R, Graves DT, Morgan EF, Gerstenfeld LC, Einhorn TA. BMP2 is essential for post natal osteogenesis but not for recruitment of osteogenic stem cells. Bone. 2009; 45:254-66. doi: 10.1016/j.bone.2009.04.239.