
INTRODUCTION
Globally, approximately 130–170 million people have hepatitis C virus infection, which is equivalent to 2% of the world’s population [1–3]. In addition, an estimated 350 million people – 5%–7% of the world’s population – are chronic carriers of the hepatitis B virus [4, 5]; Moreover, hepatitis B and C are the leading causes of chronic liver disease, especially cirrhosis [6]. At least one-third of patients with cirrhosis have hepatitis B [7], and 10%-25% of patients with chronic hepatitis C will develop cirrhosis [8]. Cirrhosis is a primary cause of the global health burden. The number of cirrhosis deaths worldwide has increased from approximately 676000 in 1980 to over 1 million in 2010 [9].
Statins are a major cholesterol-lowering drug that has been used to prevent and treat various cardiovascular diseases. Recently, other potential benefits of statins have attracted increasing attention worldwide. For example, studies have indicated that statins can decrease the risk of some cancers, including prostate, colorectal, lung, breast and liver cancers [10–15]. In addition, other studies have reported that statins can significantly reduce portal pressure [16–18]. Additionally, researchers have observed an inverse relationship between statins and the risk of cirrhosis in hepatitis B or C patients. However, no published meta-analysis has investigated the effect of statins on the risk of cirrhosis. Thus, to better understand the relationship between statins and the risk of cirrhosis in hepatitis B or C patients, we conducted a systematic review and meta-analysis of the published observational studies.
RESULTS
Study selection and study characteristics
Figure 1 shows the process of selecting studies for the meta-analysis. We obtained 3944 articles through the initial search, 682 of which were duplicated. We excluded a further 2947 studies based on a title and abstract review. Finally, two studies were further excluded due to providing insufficient information [19, 20], we identified six eligible observational articles for our meta-analysis [21–26].
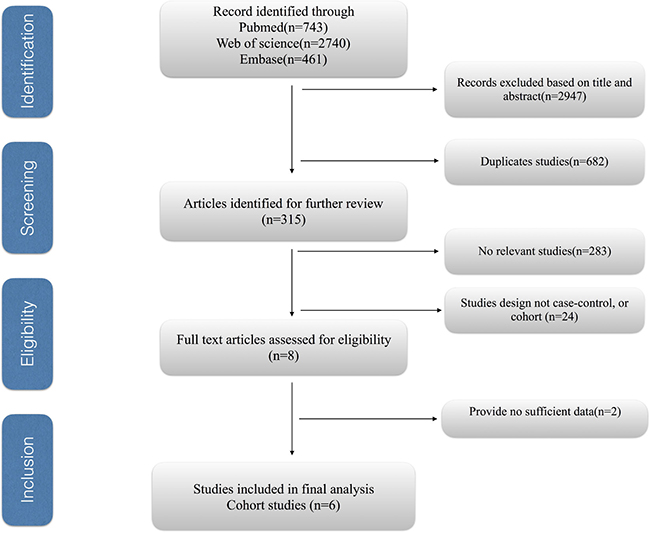
Figure 1: Process of selecting studies for the meta-analysis.
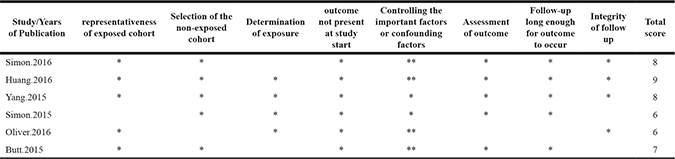
The main characteristics of the included studies are listed in Table 1 [21–26]. Four of these were performed in the USA, and two were conducted in Taiwan. Overall, 38951 cases of cirrhosis in 263573 patients with hepatitis B or C included in these studies. The data were collected in the study from 1997 to 2014. The Newcastle-Ottawa Scale scores for included studies ranged from 6 to 9, with 4 high-quality studies and only two of medium quality (Table 3).
Table 1: Scores of the Newcastle-Ottawa scale for include studies. The asterisks represent a score (number of stars)
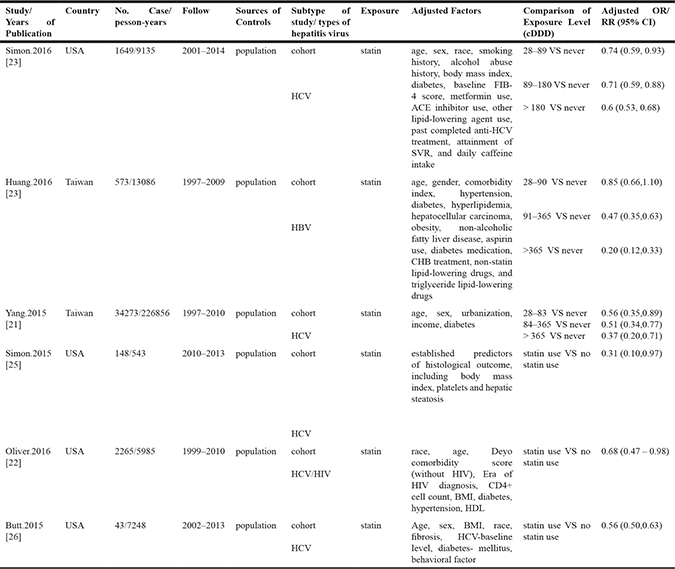
Table 2: Subgroup sensitive analyses for the effect of the use of statins on the risk of cirrhosis. cDDD, cumulative defined daily dose. RR, relative risk; CI, confidence interval
Subgroup |
No. of studies |
RR (95%CI) |
I2 value (%) |
P value |
|---|---|---|---|---|
All studies |
6 |
0.58 (0.51, 0.64) |
39.5 |
0.142 |
Geographic areas |
||||
West |
4 |
0.60 (0.53, 0.67) |
42.7 |
0.155 |
East |
2 |
0.48 (0.35, 0.61) |
0 |
0.957 |
Study quality |
||||
≥ 7 |
4 |
0.57 (0.50, 0.65) |
51.6 |
0.102 |
< 7 |
2 |
0.54 (0.19, 0.89) |
51.7 |
0.15 |
Patient with HBV or HCV |
||||
HBV |
1 |
0.49 (0.16, 0.83) |
— |
— |
HCV |
5 |
0.58 (0.50, 0.65) |
49.5 |
0.095 |
Adjustment for confounders |
||||
Alcohol intake |
||||
Yes |
2 |
0.64 (0.58, 0.69) |
0 |
0.388 |
No |
4 |
0.55 (0.48, 0.61) |
6.7 |
0.359 |
Smoking |
||||
Yes |
1 |
0.64 (0.58, 0.70) |
— |
— |
No |
5 |
0.55 (0.49, 0.60) |
0 |
0.504 |
Body Mass Index |
||||
Yes |
4 |
0.60 (0.53, 0.67) |
42.7 |
0.155 |
No |
2 |
0.48 (0.35, 0.61) |
0 |
0.957 |
Diabetes |
||||
Yes |
5 |
0.58 (0.51, 0.65) |
39.9 |
0.155 |
No |
1 |
0.31 (0.10, 0.97) |
— |
— |
Sensitive analyses |
||||
Studies included in does-response analysis |
3 |
0.57 (0.44, 0.69) |
58 |
0.093 |
Fixed-effects vs random-effects model method |
||||
Fixed-effects model |
6 |
0.59 (0.55, 0.63) |
39.5 |
0.142 |
Random-effects model |
6 |
0.58 (0.51, 0.64) |
39.5 |
0.142 |
Table 3: Main characteristics of the included studies
RR, relative risk. OR, odds ratio. CI, confidence interval. SVR, sustained virological response. FIB-4, fibrosis 4 Score
ACE, angiotensin-converting-enzyme. HDL, high density lipoprotein. BMI, body mass index. HIV, human immunodeficiency virus. HBV, hepatitis B virus. HCV, hepatitis C virus.
Overall results
Six cohort studies [21–26] were identified to investigate the relationship between statins and the risk of cirrhosis in hepatitis B or C patients. We found that statin use was associated with a significantly lower risk of cirrhosis than never statin use (summary odds ratio [OR] = 0.58; 95% CI = 0.51–0.64). In addition, obvious heterogeneity was not detected in our study (I2 = 31.9%; p = 0.142). These results are shown in Figure 2.
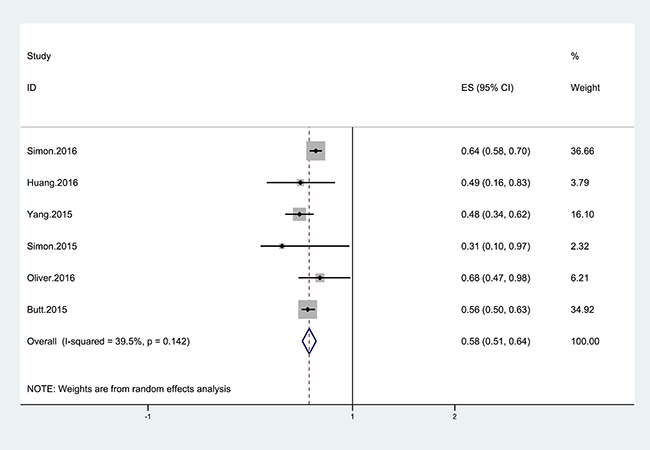
Figure 2: Forest plot showing the relationship between the use of statins and the risk of cirrhosis. The points represent the risk estimate for each individual study. The horizontal lines represent the 95% confidence interval; the diamonds represent the summary risk estimate with 95% confidence interval. The area of square reflects the weight assigned to the study. CI, confidence interval. ES, effect size.
Subgroup and sensitivity analyses
The results of subgroup analyses are shown in Table 2. When the analysis was stratified by geographic area, we found that use of statins was associated with a 40% decrease in the risk of cirrhosis in western countries, with a low heterogeneity. Moreover, the use of statins was associated with a significant 52% reduction in the risk of cirrhosis in the eastern countries; there was no heterogeneity observed within the group (Table 2). According to sensitivity analyses, despite excluding studies that were ineligible for dose-response analysis, the results for the relationship between statin use and cirrhosis remained stable (OR = 0.57; 95% CI = 0.44–0.69; I2 = 58.0%) (Table 2). In addition, the overall results were still steady when the pooling model was altered (fixed-effects model: OR = 0.59; 95% CI = 0.55–0.63 and random-effects model: OR = 0.58; 95% CI = 0.51–0.64) (Table 2). Sensitivity analysis was also performed to assess the effect of every study on the summarized estimate by sequentially excluding one study in one turn. In our meta-analysis, we detected no study could possibly affect the pooled risk estimate (Figure 4).
Dose–response meta-analysis
Three studies [21, 23, 24] with a total of 36,495 patients with cirrhosis were eligible for the assessment of the dose–response relationship between statin use and the risk of cirrhosis in hepatitis B or C patients. When we used the restricted cubic splines model, we found that the concept of a nonlinear relationship between statin use and cirrhosis risk was rejected (p for nonlinearity = 0.2062) (Figure 3). However, we identified a linear relationship with a linear regression model (Figure 3). We found that each additional 50 cDDDs of statin decreased the risk of cirrhosis by 11% (RR = 0.89, 95% CI = 0.86–0.93, p = 0.001) (Figure 3).
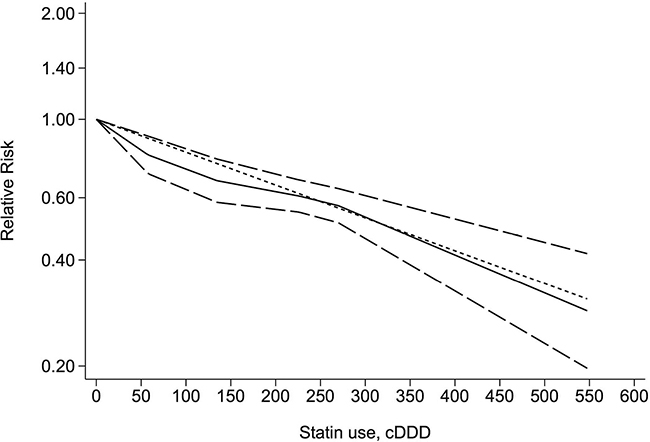
Figure 3: Dose-response relationship between statin use and the risk of cirrhosis. The solid line and long dashed line represent the estimated relative risks and their 95% confidence intervals. The short dashed line represents the linear relationship. cDDD, cumulative defined daily dose.
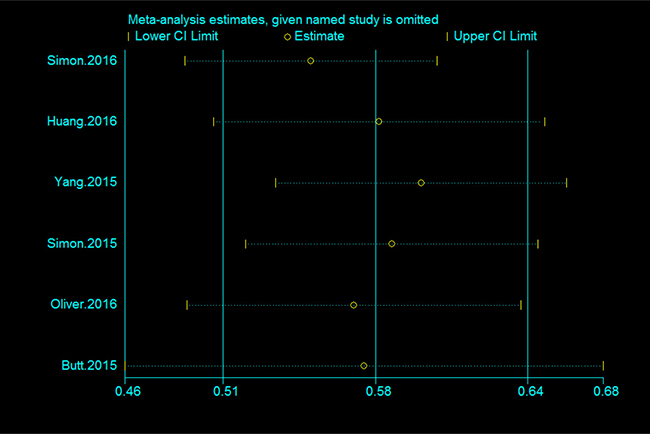
Figure 4: Sensitivity analysis of the association between statin use and the risk of cirrhosis.
Publication bias
No testing for funnel plot asymmetry was performed because of the restricted number of included studies in the analysis (n < 10).
Trial sequential analysis results
Trial sequential analysis (TSA) was performed for a more comprehensive assessment in our current meta-analysis. The cumulative Z-curve has crossed the monitoring boundaries already, demonstrating that our results were based on sufficient evidence. This finding revealed statin use were strongly associated with cirrhosis risk (Figure 5).
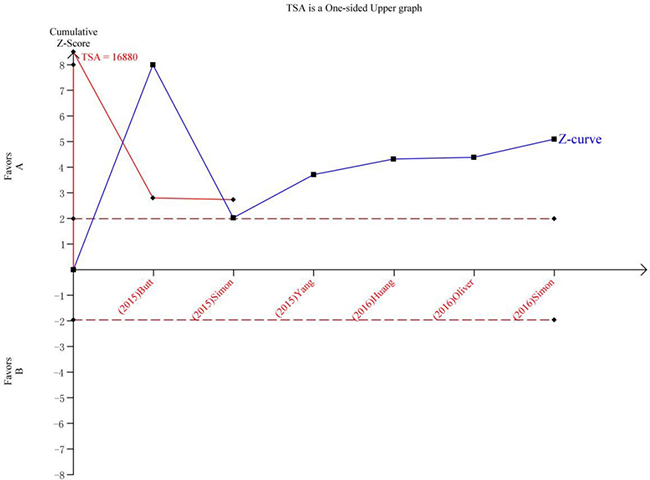
Figure 5: Trial sequential analysis of the association between between statin use and the risk of cirrhosis. The Z-curve crosses the trial sequential monitoring boundary, and reach TSA information size. (A) Statin Use. (B) No Statin Use.
DISCUSSION
Although published meta-analyses suggested a protective association between statin use and risk of hepatocellular carcinoma [27–29], no published meta-analysis studied the protective effect of statins on cirrhosis. To our knowledge, this is the first meta-analysis to investigate the relationship between statins and cirrhosis risk among patients with hepatitis B or C. We found that use of statins is associated with a 42% reduced risk of cirrhosis (OR = 0.58; 95% CI = 0.51–0.64). This protective effect is more obvious in Asian countries but is also found in Western countries. In addition, when we performed the dose-response analysis, a significant linear dose-response relationship was observed in our study rather than a nonlinear relationship. The study indicated that for every 50-cDDD increment in statin dose, the risk of cirrhosis was significantly decreased by 11%.
Our study only demonstrated an association between the use of statins and a reduced risk of cirrhosis; the data cannot establish a causative role for statins in this regard. However, if such a causative role is present, possible mechanisms could be the following. First, statins can inhibit the expression of fibrogenic cytokines such as connective tissue growth factor (CTGF), platelet-derived growth factor (PDGF) and transforming growth factor-b (TGFb), which play a critical role in the development of cirrhosis [30–32]. Second, statins can upregulate Kruppel-like factor 2 expression, which has beneficial effects on liver microcirculation and liver fibrosis in cirrhosis [33]. Third, statins may exert anti-HCV and anti-HBV activity by inhibiting cholesterol synthesis, HBV and HCV replication [14, 34, 35].
Our study has several strengths. First, it is the first to explore the dose–response relationship between statin use and the risk of cirrhosis in hepatitis B or C patients. Therefore, this may provide insight into the relationship between the use of statins and the risk of cirrhosis. Second, we performed subgroup and sensitivity analyses to determine which factors affect the risk. Third, most of the studies included in our meta-analysis were of high quality. Additionally, the studies included in the meta-analysis were cohort studies, which are not prone to generate recall and selection biases. All of these characteristics make the conclusions of our study more convincing.
There are several limitations that we must consider. First, there are many types of statins, including atorvastatin, cerivastatin, fluvastatin, lovastatin, pravastatin, rosuvastatin, simvastatin, and pitavastatin. However, we failed to obtain information about the use of other types of statin, which might have an influence on the final results. Second, the outcome that we observed was an association, which is subject to confounding bias. Although we considered several adjustment factors, there remain many potential adjustment factors that are unknown, such as the cholesterol level, the triglyceride level, or other over-the-counter drug use, which are closely related to the development of cirrhosis. In addition, we failed to obtain information about antiviral treatment in patients with HBV or HCV, which could have influenced the development of cirrhosis. Third, only 6 studies were included in our article, this puts the meta-analysis at high risk of publication bias. Additionally, Studies with different outcomes are combined which leads to the concern of heterogeneity in the meta-analysis. For example, in Simon 2015 [25], the outcome was “fibrosis progression”. However, in other studies, outcome was “development of cirrhosis”. Cirrhosis progression and development of cirrhosis are two different outcomes. Thus limiting us to generalize our findings to general populations. Finally, Simon 2016 [24] is a study of US veterans, a population that may or may not be generalizable to the normal population. Oliver 2016 [22] only included patients with HIV/HCV co-infection. It is known that progression to cirrhosis is threefold higher in co-infected than mono-infected patients. Thus, due to the different study designs and demographic characteristics inconsistency, the heterogeneity among studies acts as another potential limitation of this study.
In summary, our meta-analysis indicated that the use of statins is associated with a 42% lower risk of cirrhosis in hepatitis B or C patients. Moreover, this protective effect is more obvious in Asian countries. However, more prospective studies and basic research are still urgently needed to further validate the association between the use of statins and the risk of cirrhosis as well as the potential mechanisms.
MATERIALS AND METHODS
Data sources and search strategy
We searched published reports in the PubMed, EMBASE and Web of Science using the following keywords: (“statin* OR atorvastatin OR cerivastatin OR fluvastatin OR lovastatin OR pravastatin OR rosuvastatin OR simvastatin OR pitavastatin”) and (“cirrh* OR fibro*”). The initially relevant studies were identified up to April 2017, with no restrictions on the language of publication. We have extra data through contacting the original researchers.
Eligibility criteria for study selection
The eligibility criteria were as follows: study design (case control or cohort); exposure factor statin and outcome cirrhosis or fibrosis; and odds ratio (OR)/risk ratio (RR) values and corresponding 95% confidence intervals (CIs) for different categories of statin use available or sufficient information provided to enable the calculation of these variables. If two studies reported the same data, we selected the study with the larger sample.
Data abstraction and quality assessment
Two researchers (JPX and YQW) independently extracted the required information from the selected reports in a standardized manner. We collected the following information from each article: year of publication, first author’s name and country of origin, study design (case control or cohort), number of participants (cases, controls, or cohort size), duration of follow-up, sources of controls, comparison of exposure levels, potential adjusted confounding variables, OR/RR values and 95% CIs for different categories of statin use. To assess the dose–response, we also collected the number of case and person-years for each category of statin use.
We used the Newcastle-Ottawa Scale [36] to evaluate the quality of included studies. We assigned quality categories based on the scores of each study. The categories were the following: high quality (score 7–9), medium quality (score 4–6) and low quality (score less than 4) [37]. We resolved discrepancies by consensus.
Statistical analyses
We assessed the relationship between statins and cirrhosis using OR/RR values and the corresponding 95% CIs. When the results provided were for multiple groups with the use of statins with OR or RR values and corresponding 95% confidence intervals, we combined them to obtain a single OR/RR value and corresponding 95% CI [37]. We treated the hazard ratio as equivalent to the RR. We used the random effects model proposed by DerSimonian and Laird to quantify the relationship between the use of statins and risk of cirrhosis [38].
To enable the meta-analysis of the dose–response, we extracted the number of cases and person-years and RRs with variance estimates for at least three quantitative exposure categories from each study. If the studies did not provide these data, we required sufficient information to calculate them. For dose–response analysis, we used the midpoint of statin use in each category as the dose of statin use. If the highest category was open ended, we set the midpoint of the category at 1.5 times the lower boundary; if the lowest category was open ended, we set the lowest boundary at zero [39]. We obtained the dose-response results for a 50-cumulative-defined-daily-dose (cDDD) increment of statin use. The defined daily dose (DDD) is a dose unit for statins, and refers to “the assumed average maintenance dose per day for a drug used for its main indication in adults”; the cDDD refers to the sum of dispensed DDDs of any statins during exposure period. Additionally, we used restricted cubic splines with four knots at fixed percentiles (5%, 35%, 65%, and 95%) of the distribution to evaluate a potential nonlinear relationship between the use of statins and risk of cirrhosis [40]. A p value for the non-linear dose-response relationship was calculated by testing whether the coefficient of both the second and the third spline was zero [41]. Greenland and Orsini were the pioneers of this method [40, 42], and many subsequent studies have described it in detail [43, 44].
We used I2 to assess heterogeneity between studies and defined low, medium, and high heterogeneity as 25%, 50%, and 75%, respectively [45]. If p was less than 0.1, we assumed definite heterogeneity. Begg’s test [46], Egger’s test [47] and funnel plot have insufficient power when there are less 10 included studies [48].
We also performed subgroup analyses by geographic area, number of cases, study quality, and whether alcohol intake, smoking, body mass index or diabetes was adjusted for in the models. Sensitivity analyses were performed by changing the pooling model (random-effects model or fixed-effects model) and excluding studies that were not eligible for dose–response analysis. Sensitivity analysis was also performed to assess the effect of every study on the summarized estimate by sequentially excluding one study in one turn.
All statistical analyses were performed using STATA version 12.0 (Stata).
Trial sequential analysis
Random error can mislead results in meta-analyses. The random error risk may increase remarkably because of multiple looks on accumulating evidence when new trials emerge [49]. To obtain a more comprehensive assessment of meta-analyses, TSA was conducted to control the risk of random error. In this meta-analysis, TSA was performed by maintaining a 95% CIs, a 20% relative risk reduction, an overall type-I error of 5%, and a statistical test power of 80%, which the required information size was calculated and the trial sequential monitoring boundaries was constructed [50]. If the cumulative Z-curve crossed the trial sequential monitoring boundary or exceeded the required information size, demonstrating that our results were based on sufficient evidence [51]. The trial sequential analysis software (TSA, version 0.9; Copenhagen Trial Unit, Copenhagen, Denmark, 2011) was performed in this study.
Abbreviations
HBV, hepatitis B virus. HCV, hepatitis C virus. RR, relative risk. OR, odds ratio. CI, confidence interval. cDDD, cumulative defined daily dose.
Authors’ contributions
YQW conceived the study and wrote this manuscript. JPX and YQW searched database, reviewed studies and collected data. MN, XWC, QRW, KCZ and LG performed statistical analyses. KX coordinated and provided financial support for this work. All authors reviewed the manuscript and contributed to manuscript revisions. KX is the guarantor for this study.
CONFLICTS OF INTEREST
Declaration of personal interests: None
FUNDING
This work was supported by the National Natural Science Foundation of China (81601584)
REFERENCES
1. Hajarizadeh B, Grebely J, Dore GJ. Epidemiology and natural history of HCV infection. Nat Rev Gastroenterol Hepatol. 2013; 10:553–562.
2. Lavanchy D. Evolving epidemiology of hepatitis C virus. Clin Microbiol Infect. 2011; 17:107–115.
3. Lavanchy D. The global burden of hepatitis C. Liver Int. 2009; 29:74–81.
4. Alter MJ. Epidemiology of hepatitis B in Europe and worldwide. J Hepatol. 2003; 39:S64–69.
5. Kao JH, Chen DS. Global control of hepatitis B virus infection. Lancet Infect Dis. 2002; 2:395–403.
6. Liaw YF, Chu CM. Hepatitis B virus infection. Lancet. 373:582–592.
7. Chu CM, Liaw YF. Hepatitis B virus-related cirrhosis: natural history and treatment. Semin Liver Dis. 2006; 26:142–152.
8. Thomas DL, Seeff LB. Natural history of hepatitis C. Clin Liver Dis. 2005; 9:383–398, vi.
9. Mokdad AA, Lopez AD, Shahraz S, Lozano R, Mokdad AH, Stanaway J, Murray CJ, Naghavi M. Liver cirrhosis mortality in 187 countries between 1980 and 2010: a systematic analysis. BMC Med. 2014; 12:145.
10. Poynter JN, Gruber SB, Higgins PD, Almog R, Bonner JD, Rennert HS, Low M, Greenson JK, Rennert G. Statins and the risk of colorectal cancer. N Engl J Med. 2005; 352:2184–2192.
11. Singal R, Khurana V, Caldito G, Fort C. Statins and prostate cancer risk: A large case control study in veterans. J Clin Oncol. 2005; 23:107S–107S.
12. Khurana V, Kochhar R, Bejjanki HR, Caldito G, Fort C. Statins reduce the incidence of lung cancer: A study of half a million US veterans. J Clin Oncol. 2005; 23:107S.
13. Kochhar R, Khurana V, Bejjanki H, Caldito G, Fort C. Statins to reduce breast cancer risk: A case control study in US female veterans. J Clin Oncol. 2005; 23:7S.
14. Tsan YT, Lee CH, Wang JD, Chen PC. Statins and the risk of hepatocellular carcinoma in patients with hepatitis B virus infection. J Clin Oncol. 2012; 30:623–630.
15. Wu QJ, Tu C, Li YY, Zhu J, Qian KQ, Li WJ, Wu L. Statin use and breast cancer survival and risk: a systematic review and meta-analysis. Oncotarget. 2015; 6:42988–43004. https://doi.org/10.18632/oncotarget.5557.
16. Abraldes JG, Albillos A, Banares R, Turnes J, Gonzalez R, Garcia-Pagan JC, Bosch J. Simvastatin lowers portal pressure in patients with cirrhosis and portal hypertension: a randomized controlled trial. Gastroenterology. 2009; 136:1651–1658.
17. Pollo-Flores P, Soldan M, Santos UC, Kunz DG, Mattos DE, da Silva AC, Marchiori RC, Rezende GF. Three months of simvastatin therapy vs. placebo for severe portal hypertension in cirrhosis: A randomized controlled trial. Dig Liver Dis. 2015; 47:957–963.
18. Arab JP, Shah VH. Statins and portal hypertension: A tale of two models. Hepatology. 2016; 63:2044–2047.
19. Mohanty A, Tate J, Garcia-Tsao G. Statins are Associated with a Decreased Risk of Decompensation and Death in Veterans with Hepatitis C-related Compensated Cirrhosis. Gastroenterology. 2016; 150:430–440.
20. Kumar S, Grace ND, Qamar AA. Statin use in patients with cirrhosis: a retrospective cohort study. Dig Dis Sci. 2014; 59:1958–1965.
21. Yang YH, Chen WC, Tsan YT, Chen MJ, Shih WT, Tsai YH, Chen PC. Statin use and the risk of cirrhosis development in patients with hepatitis C virus infection. J Hepatol. 2015; 63:1111–1117.
22. Oliver NT, Hartman CM, Kramer JR, Chiao EY. Statin drugs decrease progression to cirrhosis in HIV/HCV co-infected individuals. AIDS. 2016 Aug 3 [Epub ahead of print].
23. Huang YW, Lee CL, Yang SS, Fu SC, Chen YY, Wang TC, Hu JT, Chen DS. Statins Reduce the Risk of Cirrhosis and Its Decompensation in Chronic Hepatitis B Patients: A Nationwide Cohort Study. Am J Gastroenterol. 2016; 111:976–985.
24. Simon TG, Bonilla H, Yan P, Chung RT, Butt AA. Atorvastatin and fluvastatin are associated with dose-dependent reductions in cirrhosis and hepatocellular carcinoma, among patients with hepatitis C virus: Results from ERCHIVES. Hepatology. 2016; 64:47–57.
25. Simon TG, King LY, Zheng H, Chung RT. Statin use is associated with a reduced risk of fibrosis progression in chronic hepatitis C. J Hepatol. 2015; 62:18–23.
26. Butt AA, Yan P, Bonilla H, Abou-Samra AB, Shaikh OS, Simon TG, Chung RT, Rogal SS. Effect of addition of statins to antiviral therapy in hepatitis C virus-infected persons: Results from ERCHIVES. Hepatology. 2015; 62:365–374.
27. Singh S, Singh PP, Singh AG, Murad MH, Sanchez W. Statins are associated with a reduced risk of hepatocellular cancer: a systematic review and meta-analysis. Gastroenterology. 2013; 144:323–332.
28. Zhou YY, Zhu GQ, Wang Y, Zheng JN, Ruan LY, Cheng Z, Hu B, Fu SW, Zheng MH. Systematic review with network meta-analysis: statins and risk of hepatocellular carcinoma. Oncotarget. 2016; 7:21753–21762. https://doi.org/10.18632/oncotarget.7832.
29. Zhong GC, Liu Y, Ye YY, Hao FB, Wang K, Gong JP. Meta-analysis of studies using statins as a reducer for primary liver cancer risk. Sci Rep. 2016; 6:26256.
30. Kisseleva T, Brenner DA. Anti-fibrogenic strategies and the regression of fibrosis. Best Pract Res Clin Gastroenterol. 2011; 25:305–317.
31. Eberlein M, Heusinger-Ribeiro J, Goppelt-Struebe M. Rho-dependent inhibition of the induction of connective tissue growth factor (CTGF) by HMG CoA reductase inhibitors (statins). Br J Pharmacol. 2001; 133:1172–1180.
32. Paradis V, Dargere D, Bonvoust F, Vidaud M, Segarini P, Bedossa P. Effects and regulation of connective tissue growth factor on hepatic stellate cells. Lab Invest. 2002; 82:767–774.
33. Marrone G, Russo L, Rosado E, Hide D, García-Cardeña G, García-Pagán JC, Bosch J, Gracia-Sancho J. The transcription factor KLF2 mediates hepatic endothelial protection and paracrine endothelial–stellate cell deactivation induced by statins. J Hepatol. 2013; 58:98–103.
34. Ikeda M, Abe K, Yamada M, Dansako H, Naka K, Kato N. Different anti-HCV profiles of statins and their potential for combination therapy with interferon. Hepatology. 2006; 44:117–125.
35. Bader T, Fazili J, Madhoun M, Aston C, Hughes D, Rizvi S, Seres K, Hasan M. Fluvastatin inhibits hepatitis C replication in humans. Am J Gastroenterol. 2008; 103:1383–1389.
36. Stang A. Critical evaluation of the Newcastle-Ottawa scale for the assessment of the quality of nonrandomized studies in meta-analyses. Eur J Epidemiol. 2010; 25:603–605.
37. Zhang YP, Li WQ, Sun YL, Zhu RT, Wang WJ. Systematic review with meta-analysis: coffee consumption and the risk of gallstone disease. Aliment Pharmacol Ther. 2015; 42:637–648.
38. DerSimonian R, Laird N. Meta-analysis in clinical trials. Control Clin Trials. 1986; 7:177–188.
39. Rong Y, Chen L, Zhu T, Song Y, Yu M, Shan Z, Sands A, Hu FB, Liu L. Egg consumption and risk of coronary heart disease and stroke: dose-response meta-analysis of prospective cohort studies. BMJ. 2013; 346:e8539.
40. Orsini N, Li R, Wolk A, Khudyakov P, Spiegelman D. Meta-analysis for linear and nonlinear dose-response relations: examples, an evaluation of approximations, and software. Am J Epidemiol. 2012; 175:66–73.
41. Desquilbet L, Mariotti F. Dose-response analyses using restricted cubic spline functions in public health research. Stat Med. 2010; 29:1037–1057.
42. Orsini N, Bellocco R, Greenland S. Generalized least squares for trend estimation of summarized dose-response data. Stata Journal. 2006; 6:40–57.
43. Wang AQ, Wang SS, Zhu CP, Huang HC, Wu LC, Wan XS, Yang XB, Zhang HH, Miao RY, He L, Sang XT, Zhao HT. Coffee and cancer risk: A meta-analysis of prospective observational studies. Sci Rep. 2016; 6.
44. Guo P, Xu C, Zhou Q, Zhou J, Zhao J, Si Z, Shen C, Feng C. Number of parity and the risk of gallbladder cancer: a systematic review and dose-response meta-analysis of observational studies. Arch Gynecol Obstet. 2016; 293:1087–1096.
45. Higgins JP, Thompson SG. Quantifying heterogeneity in a meta-analysis. Stat Med. 2002; 21:1539–1558.
46. Begg CB, Mazumdar M. Operating characteristics of a rank correlation test for publication bias. Biometrics. 1994; 50:1088–1101.
47. Egger M, Davey Smith G, Schneider M, Minder C. Bias in meta-analysis detected by a simple, graphical test. BMJ. 1997; 315:629–634.
48. Sterne JA, Sutton AJ, Ioannidis JP, Terrin N, Jones DR, Lau J, Carpenter J, Rucker G, Harbord RM, Schmid CH, Tetzlaff J, Deeks JJ, Peters J, et al. Recommendations for examining and interpreting funnel plot asymmetry in meta-analyses of randomised controlled trials. BMJ. 2011; 343:d4002.
49. Wetterslev J, Thorlund K, Brok J, Gluud C. Trial sequential analysis may establish when firm evidence is reached in cumulative meta-analysis. J Clin Epidemiol. 2008; 61:64–75.
50. Brok J, Thorlund K, Wetterslev J, Gluud C. Apparently conclusive meta-analyses may be inconclusive: Trial sequential analysis adjustment of random error risk due to repetitive testing of accumulating data in apparently conclusive neonatal meta-analyses. Int J Epidemiol. 2009; 38:287–298.
51. Xue J, Qin Z, Cai H, Zhang C, Li X, Xu W, Wang J, Xu Z, Yu B, Xu T, Zou Q. Comparison between transrectal and transperineal prostate biopsy for detection of prostate cancer: a meta-analysis and trial sequential analysis. Oncotarget. 2017; 8:23322–23336. https://doi.org/10.18632/oncotarget.15056.