
INTRODUCTION
Tacrolimus (Tac) is an immunosuppressant drug that belongs to the class of calcineurin inhibitors and has an important role in the prevention of allograft rejection in liver transplantation (LT) [1, 2]. It is characterized by a narrow therapeutic index and large interpatient variabilities in its pharmacokinetic and pharmacodynamic profiles, and it displays a wide range of potentially severe drug-related toxicities [3–6]. Regardless of these unfavorable characteristics, Tac is recognized as one of the most important immunosuppressants in solid-organ transplantation [7, 8].
CYP3A5 is the main catalyst of Tac metabolism, as we known. The 6986A > G variant in intron 3 of CYP3A5 (CYP3A5*3) (rs776746), is known as one of the most important single nucleotide polymorphisms (SNPs) in CYP3A5 [9]. The CYP3A5*3 AA or AG genotype (i.e., patients expressing CYP3A5 protein) have a substantially higher Tac clearance, resulting in markedly higher Tac dose requirements when compared with that of CYP3A5*3 GG genotype (i.e. patients not expressing CYP3A5 protein) [10–12]. On the basis of these findings, it has been hypothesized that individualizing the initial Tac dosage based on CYP3A5 genotype (i.e., 0.30 mg/kg/day for CYP3A5*3 AA or AG genotype carriers and 0.15 mg/kg/day for CYP3A5*3 GG genotype patients, instead of the standard 0.20 mg/kg/day for all patients) might help avoid underexposure and overexposure to Tac early after LT [13]. As underexposure to Tac is related with an increased risk of acute rejection [14] and overexposure is related with an increased risk of drug-related toxicities, such as new-onset hypertension and new-onset diabetes mellitus after LT [15–17], individualized dosing might improve the quality of life and clinical outcomes after transplantation. There was a prospective randomized study showed that more number of patients within the desired Tac target range early after transplantation and a faster achievement of Tac trough (C0) levels according to the CYP3A5 genotype of the patient [18], but it is essential to realize some limitations that are focusing solely on the CYP3A5 genotype [19, 20].
Many factors including both clinical [e.g. age, sex, hemoglobin (Hb), albumin, total bilirubin (TBL)] and genetics [e.g. CYP3A5 and CYP3A4 SNPs] have been identified to affect the pharmacokinetics of Tac [21–23]. Regarding the genetics, it is greatly recognized that the CYP3A5 *3 genotype has a noticeable effect on Tac pharmacokinetics, whereas research on the effect of CYP3A4 SNPs is limited [24, 25].
The CYP3A4*1G allele (rs2242480), a novel G-to-A substitution at position 82266 in intron 10 has been identified in the Japanese population [19, 26]. CYP3A4*1G can increase the activity of CYP3A4 enzyme [27, 28], and several studies indicate that this SNP is related to the pharmacokinetics of Tac [2, 29], as well as responsible for the interindividual differences in cyclosporine disposition [30, 31]. Hence, we advocated that the interindividual differences in Tac pharmacokinetics in vivo might also be partially owing to the interindividual differences in the CYP3A4*1G activity. Based on this frame, we investigated the relationship between the CYP3A5*3 and CYP3A4*1G genotypes in liver transplant donors and recipients, and on the pharmacokinetics of Tac, and on the complication of liver transplantation (e.g. new-onset diabetes and new-onset hypertension), considering the known clinical determinants of Tac disposition.
RESULTS
Clinical characteristics
The clinical characteristics for all population (n=170), training set (n =100) and validating set (n=70) were shown in Table 1. All patients were Chinese in this study and tested 4 weeks in both the training set and validating sets after LT. The average age of all patients was 47.9±9.5 years, and the average weight was 66.3±12.3 kg. The age of training set was younger than that of the validating set; however, this trend did not to be statistically significant. The majority causes of our transplant patients were hepatocellular carcinoma caused by hepatitis B virus.
Table 1: Patient demographic data
All Population |
Training Set (n=100) |
Validating Set (n=70) |
|
|---|---|---|---|
Age (years) |
47.9±9.5 |
46.8±9.0 |
49.0±10.0 |
Sex: female/male n (%) |
35/135 (20.6/79.4) |
17/83 (17.0/83.0) |
18/52 (25.7/74.3) |
Weight(kg) |
66.3±12.3 |
68.0±11.5 |
65.0±10.6 |
Length(m) |
1.70±0.58 |
1.72±0.49 |
1.70±0.61 |
BMI (kg/m2) |
23.0±3.4 |
23.6±3.6 |
22.7±3.3 |
Underlying liver disease (n) |
|||
Hepatitis B |
141 |
83 |
58 |
Hepatitis C |
2 |
1 |
1 |
Hepatocellular carcinoma |
98 |
61 |
37 |
Others |
17 |
10 |
7 |
Hemoglobin (g/l) |
97.6±19.0 |
99.7±14.1 |
94.5±24.2 |
GPT (U/l) |
47.3±91.3 |
101.5±59.8 |
61.9±117.3 |
TBL (umol/l) |
48.8±51.5 |
54.8±54.1 |
40.2±47.0 |
Albumin (g/l) |
36.5±7.4 |
38.0±3.1 |
36.4±8.7 |
Creatinine (mg/dl) |
65.2±23.0 |
66.4±31.9 |
63.1±17.3 |
New-onset Diabetes |
32/101 24.1/95.9 |
21/62 25.3/74.7 |
11/39 24.5/75.5 |
New-onset Hypertension |
24/110 17.9/82.1 |
16/67 19.3/80.7 |
8/43 14.8/85.2 |
New-onset Hyperlipidemia |
53/97 35.3/74.7 |
31/61 33.7/66.3 |
22/36 34.9/65.1 |
Date was presented with mean value±standard deviation or count (percentage).
BMI: body mass index; GPT: glutamate pyruvate transaminase; TBL: total bilirubin.
Genotyping
All alleles frequency was in Hardy–Weinberg equilibrium (P>0.05). There was remarkable linkage disequilibrium between the donors’ CYP3A5*3 and donors’ CYP3A4*1G (r2 = 0.494, D′ = 0.722), also between recipients’ CYP3A5*3 and recipients’ CYP3A4*1G (r2 = 0.535, D′ = 0.828). No difference between donors and recipients in the allele and genotype frequency of CYP3A5*3 and CYP3A4*1G was found (Table 2).
Table 2: Genotype and allele frequency of CYP3A5*3 and CYP3A4*1G polymorphisms in liver transplant donors (n=100) and recipients (n=100) in the training set
Gene |
SNP |
Genotype frequency, % (n) |
Allele frequency, % (n) |
|||
|---|---|---|---|---|---|---|
CYP3A4 |
Rs2242480 |
GG |
AG |
AA |
G |
A |
Donors # |
0.51 (46) |
0.41 (48) |
0.08 (5) |
0.71 (140) |
0.29 (58) |
|
Recipients |
0.61 (60) |
0.34 (37) |
0.05 (3) |
0.78 (157) |
0.22 (43) |
|
CYP3A5 |
Rs776746 |
GG |
AG |
AA |
G |
A |
Donors # |
0.49 (45) |
0.42 (48) |
0.09 (6) |
0.70 (138) |
0.30 (60) |
|
Recipients |
0.55 (53) |
0.38 (42) |
0.07 (5) |
0.74 (148) |
0.26 (52) |
|
# One case with missing genotype.
Effect of SNPs on Tac C/D ratios
The Tac C/D ratios at different time periods after LT were compared among patients with different donors’ and recipients’ CYP3A5*3 polymorphisms, as well as CYP3A4*1G polymorphisms in the training set (Table 3). There was a correlation of recipients’ CYP3A4*1G genotype with Tac C/D ratios at week 1, 3, and 4(P = 0.046, 0.015, and 0.024, respectively), and nearly at week 2(P=0.055). However, the association between donors’ CYP3A4 *1G gene polymorphisms and Tac C/D ratios was not found. Contrary to CYP3A4 *1G genotype, donors’ CYP3A5*3 had a correlation with Tac pharmacokinetics at week 1, 2, 3, and 4(P< 0.001, P =0.032, P = 0.048, and P = 0.003, respectively), but for recipients’ CYP3A5*3, the association with Tac disposition was just found at week 1 and week 3 (P = 0.014 and P = 0.038 respectively).
Table 3: Comparison of Tac concentration/dose ratios in different groups of donors’ and recipients’ CYP3A5 and CYP3A4 polymorphisms at different times after drug initiation in the training set
Gene |
Locus |
Genotype |
Week 1 |
Week 2 |
Week 3 |
Week 4 |
||||
|---|---|---|---|---|---|---|---|---|---|---|
C/D ratios |
p |
C/D ratios |
p |
C/D ratios |
p |
C/D ratios |
p |
|||
CYP3A4 |
Rs2242480 |
GG |
466.83±77.65 |
0.121 |
178.82±27.40 |
0.898 |
160.91±43.83 |
0.278 |
200.81±29.43 |
0.074 |
Donors |
Rs2242480 |
AG+AA |
329.65±39.20 |
0.046 |
183.43±23.50 |
0.055 |
211.94±22.18 |
0.015 |
143.22±16.52 |
0.024 |
CYP3A5 |
Rs776746 |
GG |
564.87±73.60 |
<0.001 |
201.43±26.60 |
0.032 |
234.57±42.81 |
0.048 |
218.48±26.45 |
0.003 |
Donors |
Rs776746 |
AG+AA |
252.07±31.63 |
0.014 |
164.44±23.80 |
0.131 |
142.22±22.20 |
0.038 |
125.75±17.08 |
0.123 |
Data was presented as mean±standard deviation. Comparison between groups was performed by t-test. P<0.05 was considered significant.
Effect of combination SNPs on Tac C/D ratios
Donors’ CYP3A5*3 allele A and recipients’ CYP3A4*1G allele A were shown to be related to faster Tac metabolism as stated in Table 3. Hence, the allele A was further explored in a combination analysis in the training set. The associations between the number of alleles A with a fast metabolism and Tac C/D ratios were shown in Table 4. When the number of alleles A was greater than or equal to two, the patients were found to have lower Tac C/D ratios at week 1, 2, and 3 (P < 0.001, P =0.001, and P < 0.001, respectively), and closed to significant at week 4 (P = 0.082).
Table 4: Comparison of Tac concentration/dose(C/D) ratios in different groups of the numbers of allele A which is a combination of donors’ CYP3A5*3 and recipients’ CYP3A4*1G genotype in the training set
The number of allele A |
N |
Week 1 |
Week 2 |
Week 3 |
Week 4 |
||||
|---|---|---|---|---|---|---|---|---|---|
C/D ratio |
p |
C/D ratio |
p |
C/D ratio |
p |
C/D ratio |
p |
||
<2 |
68 |
217.91±20.69 |
<0.001 |
110.66±14.88 |
0.001 |
155.58±26.92 |
<0.001 |
138.89±27.82 |
0.082 |
≥2 |
32 |
86.41±11.97 |
55.84±6.10 |
49.03±5.93 |
60.49±8.44 |
||||
The data was presented as mean±standard deviation. The comparison between groups was performed by Chi-square. P<0.05 was considered significant.
<2: GGGG, GGGA; ≥2: GGAA, GAAA, AAAA.
The number of alleles A (combination of donors’ CYP3A5 *3 and recipients’ CYP3A4*1G genotype) and TBL predicting Tac disposition: multivariate linear regression analysis
Table 5 showed the multivariate linear regression models predicting Tac daily dose requirements, Tac C0 level, dose-corrected Tac C0 level at week 1, 2, 3, and 4 in the training set. The incorporated cofactors included Hb, the number of allele A (combination of donors’ CYP3A5 *3 and recipients’ CYP3A4*1G genotype), TBL as well as glutamic oxalacetic transaminase. All these factors had been reported to have potential effects on Tac pharmacokinetics and entered into the validating set in the multivariate linear regression analysis (Table 6), which showed that TBL was the second explanatory variable to be retained after the number of allele A, in the list of Tac pharmacokinetic parameters.
Table 5: Multivariate regression analysis in the training set
Dependent/explanatory variable |
Parameter estimate |
Adjust R2 |
P/P |
|---|---|---|---|
Tacrolimus dose (mg/day) |
0.332 |
<0.001 |
|
The number of allele A |
0.456 |
<0.001 |
|
Hb |
0.274 |
0.005 |
|
TBL |
-0.180 |
0.063 |
|
Tacrolimus C0 (ng/ml) |
0.180 |
<0.001 |
|
The number of allele A |
-0.403 |
<0.001 |
|
GPT |
0.162 |
0.080 |
|
Tacrolimus C0/dose (ng/ml/kg) (first week) |
0.266 |
<0.001 |
|
The number of allele A |
-0.458 |
<0.001 |
|
Diabetes |
0.322 |
0.003 |
|
Tacrolimus C0/dose (ng/ml/kg) (second week) |
0.447 |
<0.001 |
|
The number of allele A |
-0.227 |
0.007 |
|
TBL |
0.637 |
<0.001 |
|
Tacrolimus C0/dose (ng/ml/kg) (third week) |
0.131 |
0.001 |
|
The number of allele A |
-0.310 |
0.003 |
|
TBL |
0.239 |
0.022 |
|
Tacrolimus C0/dose (ng/ml/kg) (fourth week) |
0.314 |
<0.001 |
|
The number of allele A |
-0.369 |
<0.001 |
|
TBL |
0.306 |
0.003 |
|
Hb |
-0.192 |
0.057 |
|
Age |
-0.206 |
0.035 |
Data was performed by multivariate linear regression analysis. P<0.05 was considered significant. The number of allele A: combination of donors’ CYP3A5 and recipients’ CYP3A4 genotype; Hb: hemoglobin; GPT: glutamate pyruvate transaminase; TBL: total bilirubin.
Table 6: Multivariate regression analysis in the validating set
Dependent/explanatory variable |
Parameter estimate |
Adjust R2 |
P/p |
|---|---|---|---|
Tacrolimus dose (mg/day) |
0.206 |
<0.001 |
|
The number of allele A |
0.395 |
0.001 |
|
TBL |
-0.197 |
0.077 |
|
Tacrolimus C0(ng/ml) |
0.207 |
<0.001 |
|
The number of allele A |
-0.355 |
0.001 |
|
TBL |
0.221 |
0.050 |
|
Age |
-0.186 |
0.095 |
|
Tacrolimus C0/dose (ng/ml/kg) (First week) |
0.333 |
<0.001 |
|
The number of allele A |
-0.400 |
<0.001 |
|
TBL |
0.363 |
0.001 |
|
Tacrolimus C0/dose (ng/ml/kg) (Second week) |
0.261 |
<0.001 |
|
The number of allele A |
-0.164 |
0.131 |
|
TBL |
0.473 |
<0.002 |
|
Tacrolimus C0/dose (ng/ml/kg) (Third week) |
0.098 |
0.015 |
|
The number of allele A |
-0.281 |
0.023 |
|
TBL |
0.163 |
0.183 |
|
Tacrolimus C0/dose (ng/ml/kg) (Forth week) |
0.078 |
0.018 |
|
The number of allele A |
-0.306 |
0.018 |
Data was performed by multivariate linear regression analysis. P<0.05 was considered significant. The number of allele A: combination of donors’ CYP3A5*3 and recipients’ CYP3A4*1G genotype; TBL: total bilirubin.
Donors’ CYP3A5 genotype, recipients’ CYP3A4 genotype, and TBL predicting the daily Tac dose corrected by weight: receiver operating characteristic (ROC) curve
As shown in Figure 1, the model of donors’ CYP3A5 genotype, recipients’ CYP3A4 genotype, and TBL (P=0.009, P=0.010, P=0.007), and the model of donors’ CYP3A5 and recipients’ CYP3A4 genotype (P=0.013, P=0.021, P=0.014) had differences for predicting Tac disposition with the model of only CYP3A5 genotype at week 1, 2, and 3, while it was not observed at week 4(all P>0.05). Besides, no difference existed between the model of donors’ CYP3A5 genotype, recipients’ CYP3A4 genotype, and TBL and the model of donors’ CYP3A5 and recipients’ CYP3A4 genotype (all P>0.05). The area under the curve of the model for donors’ CYP3A5 genotype, recipients’ CYP3A4 genotype, and TBL was 0.722 (P=0.001, 95%CI:0.645-0.800), 0.712(P=0.001, 95%CI:0.636-0.780), 0.704(P=0.001, 95%CI:0.617-0.764), and 0.610(P=0.012, 95%CI:0.528-0.703) at week 1, 2, 3, and 4 respectively. As for the model of donors’ CYP3A5 and recipients’ CYP3A4 genotype, the corresponding area under the curve was 0.715(P=0.001, 95%CI:0.636-0.794), 0.695(P=0.001, 95%CI:0.614-0.776), 0.689(P=0.001, 95%CI:0.576-0.744), and 0.605(P=0.013, 95%CI:0.526-0.702), while the model of CYP3A5 genotype alone was 0.607(P=0.02, 95%CI:0.527-0.682), 0.594(P=0.039, 95%CI:0.514-0.617), 0.582(P>0.05, 95%CI:0.502-0.659), and 0.561(P>0.05, 95%CI:0.481-0.639). According to the data given in Table 7, diagnosis point of 0.6685 obtained after the false positive rate R=10% was taken. If the prediction probability value was greater than or equal to 0.6685 it was considered positive (i.e. diagnosed with a fast metabolism), whereas a value less than 0.6685 was diagnosed with a slow metabolism.
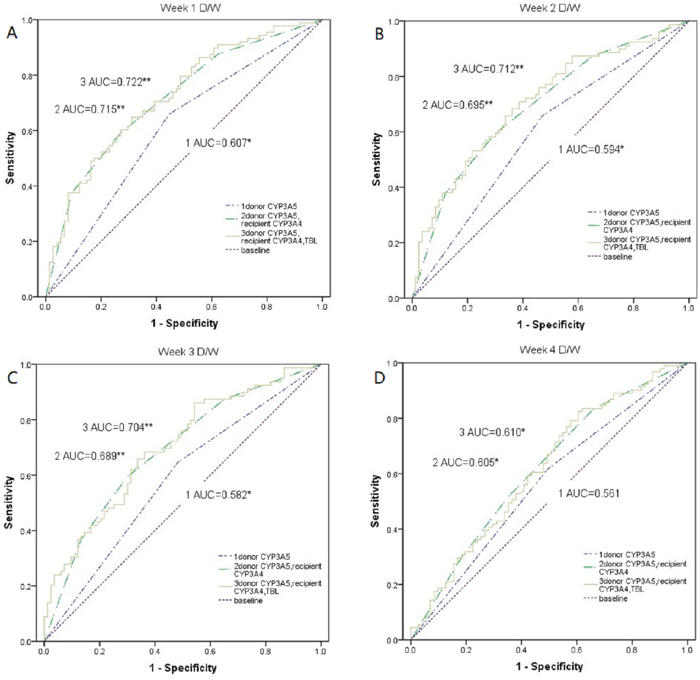
Figure 1: Comparison of weight-corrected Tac dose among the model of donors’ CYP3A5 *3, recipients’ CYP3A4*1G, and TBL, the model of donors’ CYP3A5 *3 and recipients’ CYP3A4*1G, and the model of donors’ CYP3A5 *3 alone. (A-D) The weight-corrected Tac dose at 1–4 weeks after transplant were compared among the model of donors’ CYP3A5*3, recipients’ CYP3A4*1G, and TBL, the model of donors’ CYP3A5*3 and recipients’ CYP3A4*1G, and the model of donors’ CYP3A5*3 alone by using a receiver operating characteristic (ROC) curve. D/W, weight-corrected Tac dose; AUC, area under the curve; *, p < 0.05; **, p < 0.01
Table 7: Variable PRE_2 ROC curve coordinate point
Test Variable |
Diagnosis point |
Sensitivity |
1-Specificity |
|---|---|---|---|
PRE_2 |
0.0000000 |
1.000 |
1.000 |
0.2399369 |
0.977 |
0.905 |
|
0.2745092 |
0.955 |
0.811 |
|
0.6493419 |
0.375 |
0.108 |
|
0.6805440 |
0.375 |
0.095 |
|
0.8349565 |
0.000 |
0.014 |
|
1.0000000 |
0.000 |
0.000 |
Data was performed by ROC curve. ROC: recipient operative characteristic
PRE_2: donors’ CYP3A5*3, recipients’ CYP3A4*1G, and TBL.
New-onset hypertension according to the combination of CYP3A4 and CYP3A5 polymorphisms
As shown in Table 8 that in our all study population, the association was observed between new-onset hypertension and the amounts of allele A (P=0.001), which the combination of donors’ CYP3A5 *3 genotype and recipients’ CYP3A4*1G genotype. Besides, there was a difference between alleles A with greater than two and lesser than or equal to two. With increasing number of alleles associated with fast metabolism, the patients were found to have an increasingly low probability of the occurrence of hypertension. However, it was not apparent in the aspect of new-onset diabetes (P=0.637) and new-onset hyperlipidemia (P=0.941).
Table 8: Analysis of the number of allele A which is combination of donors’ CYP3A5*3 and recipients’ CYP3A4*1G genotype and complication in all population
The number of allele A |
New-onset diabetes |
p |
New-onset hypertension |
p |
New-onset hyperlipidemia |
p |
|---|---|---|---|---|---|---|
≤2 |
29(91.7) |
0.637 |
22(93.3) |
<0.001 |
49(92.7) |
0.941 |
>2 |
3(8.3) |
2(6.7) |
4(7.3) |
The data was presented with count (percentage). The comparison between groups was performed by Chi-square. P<0.05 was considered significant.
≤2: GGGG, GGGA, GGAA; >2: GAAA, AAAA.
DISCUSSION AND CONCLUSIONS
It was well known that CYP3A5*3 played a crucial role in the metabolism of Tac disposition. Individuals with AA or AG genotype were CYP3A5 expressors and metabolized Tac; however, those with the GG genotype barely metabolized Tac [10–12]. Our patients were mostly carriers of CYP3A5*3 GG and AG genotype; only 11 patients (donors and recipients) were carriers of AA genotype in the training set, and the predominant allele of CYP3A5*3 was up to 70–74%. In African–Americans, the CYP3A5*3 allele frequency was up to 55% compared with that observed in Caucasian subjects (85–95%) [9]. The data obtained in this study were between findings in American and Caucasian populations. Similarly, CYP3A4*1G allele frequency varied among different ethnic groups: 24.9% in Japanese and 22.1% in Chinese [19, 26]. In this study, the CYP3A4*1G 22–29% allele distribution in our patients was similar to that reported previously. In this context, compared to the liver, the role of the small intestine in the metabolism of drugs in receptor organisms could not be ignored. Since most clinical drugs delivers was oral, the role of the small intestine in drug absorption link was over-emphasized in the past, and the ability of absorption was underestimated. The expression of small intestinal CYP3A4 was much higher than that of CYP3A5, accounting for 73% of the total CYP3A [33]. Thus, we were intrigued to examine the impact of combination with CYP3A5 and CYP3A4 polymorphisms on Tac pharmacokinetics in LT, considering the known clinical determinants.
First of all, our data indicated that donor CYP3A5- and recipient CYP3A4-mediated Tac metabolisms were both critical to Tac disposition in vivo [2]. This was consistent with the fact that CYP3A4 existed mostly in the gastrointestinal tract of the recipient and CYP3A5 presented mainly in the liver of the donor, both being sites of drug metabolism. Almost all studies had reported a lower Tac exposure and/or a higher dose requirement in individuals who were CYP3A5 expressors (harboring CYP3A5*3 AA or AG genotype) than that in nonexpressors (CYP3A5*3 GG genotype) [34]. Besides, Qiu XY et al. observed in their study performed in 103 renal transplant recipients that the CYP3A4*1G AA genotype was found to have a lower dose-adjusted concentration [27]. The study was consistent with our results that the potentially higher metabolic capacity of CYP3A4*1G in patients with A allele in LT and we supposed that the association of recipients‘ CYP3A5*3 with Tac disposition was because of the gene linkage disequilibrium with recipients’ CYP3A4*1G partially.
Secondly, TBL was the third variable that independently predicted that Tac pharmacokinetics in addition to donors’ CYP3A5 and recipients’ CYP3A4 genotype. Plasma TBL was mainly related to heme-oxygenase (HO) which would influence the metabolism of heme consisted of hemoglobin [35], and in line with the strong binding of Tac to the red cell [36]. Besides, TBL could represent the function of the donor’s liver, where Tac was mostly metabolized. Notably, in our study, the selection of the study population might be responsible for the fact that no other biochemical or clinical variable predicted Tac pharmacokinetics. The choice of the Chinese population of adult liver transplant recipients who were tested 4 weeks after transplantation showed that some variables known to be associated with Tac disposition (i.e., ethnicity) could not affect Tac pharmacokinetics in our study. In addition, major drug–drug and drug-food interactions were avoided because the use of drugs and food that were known to either inhibit or induce CYP3A isoenzymes or to interfere with the absorption, distribution, metabolism, or excretion of Tac was not allowed, other than corticosteroids.
Thirdly, in the multivariate linear regression analysis, when the recipients’ CYP3A4*1G and donors’ CYP3A5*3 polymorphisms were combined, we found that the number of allele A, which combination of donors’ CYP3A5*3 and recipients’ CYP3A4*1G genotypes, correlated notably with Tac C/D variation at four weeks. Besides, extensive metabolizers, with the number of alleles A greater than or equal to two, showed lower dose-adjusted blood concentration than that of poor metabolizers with the number of alleles A less than two. Furthermore, the model of donors’ CYP3A5*3, recipients’ CYP3A4*1G, and TBL, for the prediction of Tac disposition was better than the model of donors’ CYP3A5*3 only at week 1, 2, and 3, the reasons for did not apparent at week 4 maybe were that (1) the concentration of Tac became steady at week 4 and the role of gene turned into small, especially CYP3A4*1G; (2) liver function presented by TBL transformed into normal. However, these views need to be confirmed in the further study with larger samples. We established a digital model to guide the clinically use of Tac; when the calculated P value was greater than or equal to 0.6685, the patients belonged to the category of a faster metabolism, which was consistent with our experimental results.
Fourthly, when combining the donors’ CYP3A5*3 and recipients’ CYP3A4*1G polymorphisms, there was a correlation between new-onset hypertension and the number of allele A, which in the combination of donors’ CYP3A5*3 genotype and recipients’ CYP3A4*1G genotype. If the number of alleles A more than two, the likelihood of new-onset hypertension was less. One of the reasons may be that allele A could affect the metabolism of Tac, which caused the development of hypertension by activating the renal sodium chloride co-transporter (NCC) [3], and the previous study also reported that Tac led to renal vasoconstriction and nephrotoxicity further confirmed our results [37, 38].
Overall, our results suggested that the donors’ CYP3A5*3, recipients’ CYP3A4*1G genotype, and TBL had a major influence on Tac exposure. Notably, to our knowledge, this was the first time to define individualized Tac doses in liver transplant patients according to our digital model consisted of genotypic CYP3A5*3, CYP3A4*1G, and clinical TBL, in a Chinese population. However, two limitations need to be acknowledged. Firstly, this study was based on small Chinese cohorts, most of them had hepatitis B virus-related liver diseases. Secondly, this was an observational study, and the basis of every important finding still required further explanation. In the future, a well-controlled clinical study was warranted to investigate this issue.
Furthermore, to date, this was the first study to explore the number of alleles A was associated with Tac disposition in LT in Chinese patients according to CYP3A5 *3 and CYP3A4*1G combinations. This may allow the prevention of liver graft rejection and improve the safety profile of Tac. Besides, to our limited knowledge, this was the first time to define that the number of alleles A was associated with new-onset hypertension in liver transplant patients. This finding could be clinically relevant for the effective prevention, early diagnosis, and treatment of new –onset hypertension in Chinese LT recipients.
MATERIALS AND METHODS
Study subjects
Hundred patients from the China Liver Transplant Registry (CLTR) database who underwent orthotopic liver transplantation (OLT) from July 2007 to March 2012 at the First People's Hospital Affiliated to Shanghai Jiao Tong University were enrolled in this retrospective study. The exclusion criteria: (1) Patients with pre-existing hypertension or diabetes mellitus or hyperlipidemia before transplantation; (2) those who underwent re-transplantation or multiorgan transplantation; (3) those with less than 3 months of follow-up; (4) those who smoked or drank after operation were also excluded. The inclusion criteria of new-onset hypertension patients after transplantation according to China's organ transplant recipients hypertension guidelines and World Health Organization were:(1) systolic blood pressure>130mmHg and/or diastolic blood pressure>80mmHg, more than three consecutive measurements are taken, at least 5 minutes apart and with the person seated; (2) have antihypertensive drugs even though the blood pressure under the level above. The main causes of liver disease were hepatitis B virus (n=140). Lamivudine combined with low-dose intramuscular hepatitis B immunoglobulin therapy was applied in patients with hepatitis B virus-related liver disease. Amlodipine-based individualized antihypertensive treatment for recipients of hypertension. The immunosuppressive regimen was triple therapy incorporating Tac, mycophenolate, and steroid. After the initial study, a validating population of 70 patients from the CLTR database who underwent OLT between March 2012 and March 2015 at the First People's Hospital Affiliated to Shanghai Jiao Tong University was analyzed using the same methods of data collection, grouping, and genotyping as that of the training set.
Ethics statement
Informed consent was obtained from all donors and recipients. Each organ donation or transplant was approved by the Institutional Review Board, First Hospital Affiliated Shanghai Jiao Tong University, strictly under the guidelines of the Ethics Committee of the hospital, the current regulation of the Chinese Government, and the Declaration of the Helsinki. No donor's livers were harvested from executed prisoners.
Data collection
On the basis of previous studies, we used the Tac serum concentration to dose ratios (C/D ratio) for 28 days after transplantation as an index of Tac pharmacokinetics [32]. Trough blood concentration of Tac (ng/mL) was detected by PRO-TracTM II Tac ELISA kit (DiaSorin Inc., USA) with microparticle enzyme immunoassay (ELx800NB analyzer, BioTek, USA). The daily dose (mg) of Tac was recorded, and the weight-adjusted dosage (mg/kg/d) was calculated. The Tac C/D ratio was calculated by dividing the Tac trough concentration (C0) by the corresponding weight-adjusted dosage. The results of the laboratory tests were also recorded. The average clinical data in the different periods were calculated to represent the corresponding clinical status.
Genotyping
The liver tissue (20~50 mg) was thawed from the donors and receptors, and the genomic DNA was extracted using the AllPrep DNA/RNA Mini Kit (Qiagen, Germany). Polymerase chain reaction (PCR) amplification was performed using a 2720 thermal cycler (Applied Biosystems). The primer sequences used were (a) CYP3A5 *3: the forward primer: 5′- AGGAAGCCAGACTTTGATCATTATGTT-3′; the reverse primer: 5′- GAGAGTGGCATAGGAGATACCCA-3′ (b) CYP3A4*1G: the forward primer: 5′- ATGAACCAGAGCCAGCACGTTT-3′; the reverse primer: 5′- GCAGAAACTGCAGGAGGAAATTGAT-3′. The total volume of the PCR mix was 25 μL, and it contained 2.5 μL 10xPCR buffer, 50 pmol of each primer, 0.2 mM of each deoxynucleotide triphosphate, 2 U Taq DNA polymerase (TaKaRa Biotechnology Co., Ltd, Dalian, China), and 100 ng genomic DNA. The genotyping was carried out by direct sequencing on an ABI 3730 DNA Analyzer.
Statistical analysis
The Kolmogorov-Smirnov test was used to check for normality. The Hardy–Weinberg equilibrium test was performed using an appropriate χ2 test. Pairwise r2 and D′ values for linkage disequilibrium were calculated using SHEsis software (http://analysis.bio-x.cn/myAnalysis.php). SPSS version 19.0 (SPSS Inc., Chicago, IL, USA) was used to complete other statistical analyses. Quantitative variables were expressed as mean ± SD and compared by Student’s t-test or Wilcoxon-Mann-Whitney test. Categorical variables were presented as values (percentages) and compared using Fisher’s exact test and Pearson’s χ2 test. Exploratory univariate correlation analysis (Spearman’s correlation coefficient) was performed to explore whether a specific covariate potentially affected the Tac pharmacokinetics. Tac does, Tac C0, and dose-corrected Tac C0 were used as dependent variables. All covariates that correlated with the Tac pharmacokinetic parameters at a P value < 0.2 in univariate correlation analysis were retained and entered into the multivariate linear regression model. The models were calculated in binary logistic regression, transformed in a new variable, and then compared using receiver operating characteristic (ROC) curve. According to the linear interpolation method, the false positive rate R = 10% was taken after points for diagnosis. In addition, categorical covariates were coded with a dummy variable set arbitrarily at 0 or 1 depending on the absence or presence of a specific feature. In a multivariate regression analysis, significant covariates of Tac pharmacokinetics were selected using the backward elimination procedure. A two-sided P < 0.05 was considered to be statistically significant.
Abbreviations
Tac: tacrolimus; LT: liver transplantation; CLTR: China Liver Transplant Registry; TBL: total bilirubin; Hb: hemoglobin; C/D: dose-corrected Tac concentration; D/W, weight-corrected Tac dose; SNPs: single nucleotide polymorphisms; OLT: orthotopic liver transplantation (OLT); ROC: receiver operating characteristic; AUC: area under the curve; BMI: body mass index; GPT: glutamate pyruvate transaminase; PCR: polymerase chain reaction.
Author contributions
Yuan Liu, Tao Zhang and Xiaoqing Zhang carried out the studies, participated in collecting data, performed the statistical analysis and drafted the manuscript. Zhihai Peng and Junwei Fan participated in its design. Ling Ye, Haitao Gu, Lin Zhong, Hongcheng Sun and Chenlong Song helped draft the manuscript. All authors read and approved the final manuscript.
ACKNOWLEDGMENTS
I want to take this chance to thanks to my tutor, Dr. Junwei Fan, a professor in Shanghai Jiao Tong University school of medicine. In the process of composing this paper, he gives me many academic and constructive advise.
At the same time, I do need to thanks my father, Chunsheng Liu, my mother, Meihong Yang, who give me a lot of mental and economic support making me grow up well.
CONFLICTS OF INTEREST
The authors declare no competing financial interests.
FUNDING
This work was supported by the National Natural Science Foundation of China (Grant Number 8153044), Joint Fund of the National Natural Science Foundation of Henan (U1604282).
REFERENCES
1. Almeida-Paulo GN, Dapia Garcia I, Lubomirov R, Borobia AM, Alonso-Sanchez NL, Espinosa L, Carcas-Sansuan AJ. Weight of ABCB1 and POR genes on oral tacrolimus exposure in CYP3A5 nonexpressor pediatric patients with stable kidney transplant. Pharmacogenomics J. 2017. https://doi.org/10.1038/tpj.2016.93.
2. Andreu F, Colom H, Elens L, van Gelder T, van Schaik RH, Hesselink DA, Bestard O, Torras J, Cruzado JM, Grinyo JM, Lloberas N. A New CYP3A5*3 and CYP3A4*22 cluster influencing tacrolimus target concentrations: a population approach. Clin Pharmacokinet. 2017; 56:963-75. https://doi.org/10.1007/s40262-016-0491-3.
3. Hoorn EJ, Walsh SB, McCormick JA, Furstenberg A, Yang CL, Roeschel T, Paliege A, Howie AJ, Conley J, Bachmann S, Unwin RJ, Ellison DH. The calcineurin inhibitor tacrolimus activates the renal sodium chloride cotransporter to cause hypertension. Nat Med. 2011; 17:1304-9. https://doi.org/10.1038/nm.2497.
4. Beckebaum S, Cicinnati VR, Radtke A, Kabar I. Calcineurin inhibitors in liver transplantation - still champions or threatened by serious competitors? Liver Int. 2013; 33:656-65. https://doi.org/10.1111/liv.12133.
5. Starzl TE, Fung JJ. Themes of liver transplantation. Hepatology. 2010; 51:1869-84. https://doi.org/10.1002/hep.23595.
6. Saliba F, Duvoux C, Gugenheim J, Kamar N, Dharancy S, Salame E, Neau-Cransac M, Durand F, Houssel-Debry P, Vanlemmens C, Pageaux G, Hardwigsen J, Eyraud D, et al. Efficacy and safety of everolimus and mycophenolic acid with early tacrolimus withdrawal after liver transplantation: a multicenter randomized trial. Am J Transplant. 2017; 17:1843-52. https://doi.org/10.1111/ajt.14212.
7. Farkas SA, Schnitzbauer AA, Kirchner G, Obed A, Banas B, Schlitt HJ. Calcineurin inhibitor minimization protocols in liver transplantation. Transpl Int. 2009; 22:49-60. https://doi.org/10.1111/j.1432-2277.2008.00796.x.
8. Meier-Kriesche HU, Li S, Gruessner RW, Fung JJ, Bustami RT, Barr ML, Leichtman AB. Immunosuppression: evolution in practice and trends, 1994-2004. Am J Transplant. 2006; 6:1111-31. https://doi.org/10.1111/j.1600-6143.2006.01270.x.
9. Hustert E, Haberl M, Burk O, Wolbold R, He YQ, Klein K, Nuessler AC, Neuhaus P, Klattig J, Eiselt R, Koch I, Zibat A, Brockmoller J, et al. The genetic determinants of the CYP3A5 polymorphism. Pharmacogenetics. 2001; 11:773-9.
10. Hesselink DA, Bouamar R, Elens L, van Schaik RH, van Gelder T. The role of pharmacogenetics in the disposition of and response to tacrolimus in solid organ transplantation. Clin Pharmacokinet. 2014; 53:123-39. https://doi.org/10.1007/s40262-013-0120-3.
11. Kuypers DR, de Jonge H, Naesens M, Lerut E, Verbeke K, Vanrenterghem Y. CYP3A5 and CYP3A4 but not MDR1 single-nucleotide polymorphisms determine long-term tacrolimus disposition and drug-related nephrotoxicity in renal recipients. Clin Pharmacol Ther. 2007; 82:711-25. https://doi.org/10.1038/sj.clpt.6100216.
12. Rong G, Jing L, Deng-Qing L, Hong-Shan Z, Shai-Hong Z, Xin-Min N. Influence of CYP3A5 and MDR1(ABCB1) polymorphisms on the pharmacokinetics of tacrolimus in Chinese renal transplant recipients. Transplant Proc. 2010; 42:3455-8. https://doi.org/10.1016/j.transproceed.2010.08.063.
13. Fan J, Zhang X, Ren L, Chen D, Wu S, Guo F, Qin S, Wang Z, Lin Z, Xing T, Sun X, Peng Z. Donor IL-18 rs5744247 polymorphism as a new biomarker of tacrolimus elimination in Chinese liver transplant patients during the early post-transplantation period: results from two cohort studies. Pharmacogenomics. 2015; 16:239-50. https://doi.org/10.2217/pgs.14.166.
14. MacPhee IA, Fredericks S, Tai T, Syrris P, Carter ND, Johnston A, Goldberg L, Holt DW. The influence of pharmacogenetics on the time to achieve target tacrolimus concentrations after kidney transplantation. Am J Transplant. 2004; 4:914-9. https://doi.org/10.1111/j.1600-6143.2004.00435.x.
15. Shihab F, Christians U, Smith L, Wellen JR, Kaplan B. Focus on mTOR inhibitors and tacrolimus in renal transplantation: pharmacokinetics, exposure-response relationships, and clinical outcomes. Transpl Immunol. 2014; 31:22-32. https://doi.org/10.1016/j.trim.2014.05.002.
16. Muraoka K, Fujimoto K, Sun X, Yoshioka K, Shimizu K, Yagi M, Bose H Jr, Miyazaki I, Yamamoto K. Immunosuppressant FK506 induces interleukin-6 production through the activation of transcription factor nuclear factor (NF)-kappa(B). Implications for FK506 nephropathy. J Clin Invest. 1996; 97:2433-9. https://doi.org/10.1172/jci118690.
17. Weir MR, Burgess ED, Cooper JE, Fenves AZ, Goldsmith D, McKay D, Mehrotra A, Mitsnefes MM, Sica DA, Taler SJ. Assessment and management of hypertension in transplant patients. J Am Soc Nephrol. 2015; 26:1248-60. https://doi.org/10.1681/asn.2014080834.
18. Thervet E, Loriot MA, Barbier S, Buchler M, Ficheux M, Choukroun G, Toupance O, Touchard G, Alberti C, Le Pogamp P, Moulin B, Le Meur Y, Heng AE, et al. Optimization of initial tacrolimus dose using pharmacogenetic testing. Clin Pharmacol Ther. 2010; 87:721-6. https://doi.org/10.1038/clpt.2010.17.
19. Fukushima-Uesaka H, Saito Y, Watanabe H, Shiseki K, Saeki M, Nakamura T, Kurose K, Sai K, Komamura K, Ueno K, Kamakura S, Kitakaze M, Hanai S, et al. Haplotypes of CYP3A4 and their close linkage with CYP3A5 haplotypes in a Japanese population. Hum Mutat. 2004; 23:100. https://doi.org/10.1002/humu.9210.
20. Du J, Xing Q, Xu L, Xu M, Shu A, Shi Y, Yu L, Zhang A, Wang L, Wang H, Li X, Feng G, He L. Systematic screening for polymorphisms in the CYP3A4 gene in the Chinese population. Pharmacogenomics. 2006; 7:831-41. https://doi.org/10.2217/14622416.7.6.831.
21. Prytula AA, Cransberg K, Bouts AH, van Schaik RH, de Jong H, de Wildt SN, Mathot RA. The effect of weight and CYP3A5 genotype on the population pharmacokinetics of tacrolimus in stable paediatric renal transplant recipients. Clin Pharmacokinet. 2016; 55:1129-43. https://doi.org/10.1007/s40262-016-0390-7.
22. Staatz CE, Goodman LK, Tett SE. Effect of CYP3A and ABCB1 single nucleotide polymorphisms on the pharmacokinetics and pharmacodynamics of calcineurin inhibitors: Part II. Clin Pharmacokinet. 2010; 49:207-21. https://doi.org/10.2165/11317550-000000000-00000.
23. Staatz CE, Goodman LK, Tett SE. Effect of CYP3A and ABCB1 single nucleotide polymorphisms on the pharmacokinetics and pharmacodynamics of calcineurin inhibitors: Part I. Clin Pharmacokinet. 2010; 49:141-75. https://doi.org/10.2165/11317350-000000000-00000.
24. Gijsen V, Mital S, van Schaik RH, Soldin OP, Soldin SJ, van der Heiden IP, Nulman I, Koren G, de Wildt SN. Age and CYP3A5 genotype affect tacrolimus dosing requirements after transplant in pediatric heart recipients. J Heart Lung Transplant. 2011; 30:1352-9. https://doi.org/10.1016/j.healun.2011.08.001.
25. Jacobson PA, Oetting WS, Brearley AM, Leduc R, Guan W, Schladt D, Matas AJ, Lamba V, Julian BA, Mannon RB, Israni A. Novel polymorphisms associated with tacrolimus trough concentrations: results from a multicenter kidney transplant consortium. Transplantation. 2011; 91:300-8. https://doi.org/10.1097/TP.0b013e318200e991.
26. Du J, Yu L, Wang L, Zhang A, Shu A, Xu L, Xu M, Shi Y, Li X, Feng G, Xing Q, He L. Differences in CYP3A41G genotype distribution and haplotypes of CYP3A4, CYP3A5 and CYP3A7 in 3 Chinese populations. Clin Chim Acta. 2007; 383:172-4. https://doi.org/10.1016/j.cca.2007.04.027.
27. Qiu XY, Jiao Z, Zhang M, Zhong LJ, Liang HQ, Ma CL, Zhang L, Zhong MK. Association of MDR1, CYP3A4*18B, and CYP3A5*3 polymorphisms with cyclosporine pharmacokinetics in Chinese renal transplant recipients. Eur J Clin Pharmacol. 2008; 64:1069-84. https://doi.org/10.1007/s00228-008-0520-8.
28. Hu YF, Tu JH, Tan ZR, Liu ZQ, Zhou G, He J, Wang D, Zhou HH. Association of CYP3A4*18B polymorphisms with the pharmacokinetics of cyclosporine in healthy subjects. Xenobiotica. 2007; 37:315-27. https://doi.org/10.1080/00498250601149206.
29. Debette-Gratien M, Woillard JB, Picard N, Sebagh M, Loustaud-Ratti V, Sautereau D, Samuel D, Marquet P. Influence of donor and recipient CYP3A4, CYP3A5, and ABCB1 genotypes on clinical outcomes and nephrotoxicity in liver transplant recipients. Transplantation. 2016; 100:2129-37. https://doi.org/10.1097/tp.0000000000001394.
30. Wang YY, Zhang M, Lu FM, Jiao Z, Qiu XY. CYP3A4 genetic polymorphisms predict cyclosporine-related clinical events in Chinese renal transplant recipients. Chin Med J (Engl). 2012; 125:4233-8.
31. Meng XG, Guo CX, Feng GQ, Zhao YC, Zhou BT, Han JL, Chen X, Shi Y, Shi HY, Yin JY, Peng XD, Pei Q, Zhang W, et al. Association of CYP3A polymorphisms with the pharmacokinetics of cyclosporine A in early post-renal transplant recipients in China. Acta Pharmacol Sin. 2012; 33:1563-70. https://doi.org/10.1038/aps.2012.136.
32. Zhang X, Wang Z, Fan J, Liu G, Peng Z. Impact of interleukin-10 gene polymorphisms on tacrolimus dosing requirements in Chinese liver transplant patients during the early posttransplantation period. Eur J Clin Pharmacol. 2011; 67:803-13. https://doi.org/10.1007/s00228-011-0993-8.
33. Paine MF, Hart HL, Ludington SS, Haining RL, Rettie AE, Zeldin DC. The human intestinal cytochrome P450 “pie”. Drug Metab Dispos. 2006; 34:880-6. https://doi.org/10.1124/dmd.105.008672.
34. Aouam K, Kolsi A, Kerkeni E, Ben Fredj N, Boughattas N. Influence of combined CYP3A4 and CYP3A5 single-nucleotide polymorphisms on tacrolimus exposure in kidney transplant recipients: a study according to the post-transplant phase. Pharmacogenomics. 2015; 16:2045-54. https://doi.org/10.2217/pgs.15.138.
35. McCarty MF. Serum bilirubin may serve as a marker for increased heme oxygenase activity and inducibility in tissues--a rationale for the versatile health protection associated with elevated plasma bilirubin. Med Hypotheses. 2013; 81:607-10. https://doi.org/10.1016/j.mehy.2013.07.013.
36. Staatz CE, Tett SE. Clinical pharmacokinetics and pharmacodynamics of tacrolimus in solid organ transplantation. Clin Pharmacokinet. 2004; 43:623-53.
37. Taler SJ, Textor SC, Canzanello VJ, Schwartz L, Porayko M, Wiesner RH, Krom RA. Role of steroid dose in hypertension early after liver transplantation with tacrolimus (FK506) and cyclosporine. Transplantation. 1996; 62:1588-92.
38. Pan GH, Chen Z, Xu L, Zhu JH, Xiang P, Ma JJ, Peng YW, Li GH, Chen XY, Fang JL, Guo YH, Zhang L, Liu LS. Low-dose tacrolimus combined with donor-derived mesenchymal stem cells after renal transplantation: a prospective, non-randomized study. Oncotarget. 2016; 7:12089-101. https://doi.org/10.18632/oncotarget.7725.