
INTRODUCTION
Breast cancer is one of the most common malignant tumors, and now it is becoming a leading cause of 0cancer-related death in women worldwide [1–2]. The treatment for breast cancer involves a combination of surgery, chemotherapy, and radiotherapy [3]. Over the past decades, the mortality rate among breast cancer patients has decreased. However, cardiotoxicity induced by the chemotherapy has become a leading cause of morbidity and mortality in survivors [4–5]. To prevent heart failure caused by cancer therapy, consideration of potential cardiotoxicity is very important.
Epirubicin and therarubicin, as common anthracyclines, are widely used chemotherapy drugs for reducing the recurrence of breast cancer in China. However, the use of these drugs is limited by their cardiotoxicity. The cardiotoxicity of anthracycline-based chemotherapy may be associated with the cumulative dose, other associated cytotoxic drugs, or the advanced age of patients [6–7]. Previous studies found that the cardiotoxicity can appear during or after the chemotherapy in breast cancer patients [6, 8]. Left ventricular ejection fraction (LVEF) measurement by two-dimensional echocardiography is the most commonly used method for detecting cardiotoxicity, which is most commonly defined as a ≥5% or ≥10% reduction in the LVEF from baseline to an LVEF <55% in symptomatic patients and asymptomatic patients, respectively [9]. However, the use of LVEF has limitations for early detection of cardiotoxicity because it cannot reflect the early dysfunction of the heart [5].
With the development of various imaging techniques, such as tissue Doppler imaging (TDI), speckle tracking echocardiography (STE, two-dimensional or three-dimensional), and cardiac magnetic resonance imaging (CMRI), the cardiotoxicity of anthracycline-based chemotherapy can be detected with greater convenience. However, the angle dependency of TDI makes these results difficult to reproduce [10]. Although CMRI is considered the gold standard for evaluating LV volumes and EF, its lack of availability and high cost limit its routine use [11–12]. STE is an ideal method for detecting cardiotoxicity caused by chemotherapy, and previous studies have demonstrated that STE is feasible and convenient for early detection of cardiac dysfunction [13–15].
The aim of the present study was to identify a parameter for reliable detection of cardiac dysfunction via STE after chemotherapy in breast cancer patients. We hypothesed that longitudinal rotation (LR) motion could be detected in the hearts of breast cancer patients after chemotherapy, then tested the hypothesis by measuring the global peak systolic LR (PSLR) degrees in breast cancer patients after anthracycline-based chemotherapy. Cardiac dysfunction was then evaluated to confirm whether LR could serve as a new way to detect cardiac dysfunction after chemotherapy in breast cancer patients.
RESULTS
General characteristics of the patients
The general characteristics of the study group are listed in Table 1. The cumulative dose of epirubicin given was significantly higher than that of therarubicin.
Table 1: Baseline characteristics of the total population (mean±SD)
Variable |
Baseline |
|---|---|
Age (yrs) |
49±8 |
Female |
43(43) |
Body surface area (m2) |
1.65±0.12 |
Systolic blood pressure(mmHg) |
121±11 |
Diastolic blood pressure (mmHg) |
76±9 |
Heart rate (bpm) |
77±3 |
Side of breast cancer |
|
Left |
22(43) |
Right |
21(43) |
Both |
0(43) |
Cardiovascular risk factors |
|
Diabetes |
0(43) |
Hypertension |
0(43) |
Hyperlipidemia |
0(43) |
Smoking history |
0(43) |
Cumulative dose of anthracycline (mg/m2) |
|
Epirubicin (27) |
524±141* (95 % CI: 479-634) |
Therarubicin (16) |
336±115 (95 % CI: 275-398) |
Chemotherapy |
|
FEC(5-FU, EPI/ THP, CTX) |
30(43) |
5-FU, EPI, CTX |
17(30) |
5-FU, THP, CTX |
13 (30) |
TEC(TXT, EPI/ THP, CTX) |
13(43) |
TXT, EPI, CTX |
10 (13) |
TXT, THP, CTX |
3 (13) |
5-FU: 5-flourouracil; EPI: epirubicin; THP: therarubicin; CTX: cyclophosphamide; TXT: taxotere.
The values at baseline compared with those at 3 weeks after the final cycle of chemotherapy, *P<0.05.
Conventional two-dimensional echocardiographic parameters of the study groups
The conventional two-dimensional echocardio-graphic parameters of the study groups at the three time points are listed in Table 2. There were no significant differences among the study groups at the three separate time points, except that the e’sep at baseline was higher than at 3 weeks and 6 months after the final cycle of chemotherapy. Although there were no significant differences among E, E/A, and e’lat between the groups, the baseline values were higher than those at 3 weeks and 6 months after the final cycle of chemotherapy.
Table 2: Conventional two-dimensional echocardiographic parameters, speckle-tracking echocardiographic parameters and segmental and global peak systolic longitudinal rotation (PSLR) of the total population at baseline and 3 weeks and 6 months after the final cycle of chemotherapy (mean±SD)
Variable |
Baseline |
3 weeks |
6 months |
P-value |
||
|---|---|---|---|---|---|---|
Conventional two-dimensional echocardiographic parameters |
IVSd(mm) |
8.93±0.99 |
8.67±0.78 |
8.72±0.80 |
0.342 |
|
LVDd(mm) |
44.98±3.03 |
45.63±2.95 |
45.95±3.07 |
0.314 |
||
LVPWd(mm) |
8.67±1.06 |
8.56±0.73 |
8.79±0.86 |
0.487 |
||
LVSd(mm) |
29.74±2.73 |
30.56±2.77 |
30.67±2.09 |
0.187 |
||
LVEDV(ml) |
61.44±13.77 |
64.35±13.38 |
64.37±13.48 |
0.516 |
||
LVESV(ml) |
22.23±6.41 |
23.12±7.57 |
23.42±6.79 |
0.723 |
||
LVEF(%) |
63.47±6.31 |
63.35±5.88 |
63.72±6.49 |
0.961 |
||
E(m/s) |
0.71±0.16 |
0.65±0.14 |
0.66±0.17 |
0.180 |
||
A(m/s) |
0.66±0.13 |
0.69±0.17 |
0.69±0.15 |
0.556 |
||
E/A |
1.13±0.39 |
0.99±0.32 |
1.01±0.36 |
0.144 |
||
e’Sep |
0.09±0.02* |
0.07±0.02 |
0.08±0.02 |
0.022 |
||
a’Sep |
0.10±0.02 |
0.10±0.02 |
0.10±0.02 |
0.633 |
||
e’lat |
0.13±0.03 |
0.12±0.03 |
0.11±0.03 |
0.062 |
||
a’lat |
0.10±0.02 |
0.10±0.03 |
0.10±0.02 |
0.903 |
||
E/e’sep |
5.73±1.68 |
5.75±1.84 |
6.17±2.04 |
0.469 |
||
E/e’lat |
8.78±2.64 |
9.27±2.38 |
9.15±2.72 |
0.660 |
||
Speckle-tracking echocardiographic parameters |
Peak velocity(cm/s) |
Systolic |
3.60±0.95 |
3.37±1.34 |
3.31±0.71 |
0.391 |
Early-diastolic |
-4.48±1.33*# |
-3.97±1.15 |
-3.81±1.09 |
0.028 |
||
Late-diastolic |
-3.82±0.94 |
-3.78±0.83 |
-3.74±0.88 |
0.912 |
||
Peak systolic strain(%) |
Endomyocardium |
-24.98±3.67 |
-23.73±6.32 |
-24.20±6.32 |
0.451 |
|
Midmyocardium |
-21.25±3.04 |
-20.76±2.48 |
-20.37±2.68 |
0.333 |
||
epimyocardium |
-18.59±2.61 |
-18.21±2.57 |
-17.63±2.28 |
0.206 |
||
Peak strain rate(S−1) |
Systolic |
-1.30±0.21 |
-1.16±0.48 |
-1.21±0.17 |
0.139 |
|
Early-diastolic |
1.76±0.37 |
1.65±0.35 |
1.63±0.39 |
0.238 |
||
Late-diastolic |
1.19±0.30 |
1.45±1.67 |
1.17±0.30 |
0.335 |
||
Peak systolic Displacement (mm) |
9.79±1.82 |
8.72±5.06 |
9.21±1.53 |
0.308 |
||
PSLR |
4-CH |
Lateral wall |
9.30±2.73*# |
7.00±4.08 |
6.83±4.42 |
0.005 |
Septal wall |
-8.12±3.06 |
-8.87±2.90 |
-8.75±2.72 |
0.438 |
||
Apex wall |
1.51±3.34 |
-0.14±4.03 |
-0.14±3.78 |
0.064 |
||
Global |
-0.23±3.26*# |
-1.91±3.27 |
-1.90±2.92 |
0.020 |
||
IVSd: interventricular septal thickness in end-diastolic period, LVDd: left ventricular diameter in end-diastolic period, LVPWd: left ventricular posterior wall thickness in end-diastolic period, LVSd: left ventricular diameter in end-diastolic period, LVEDV: left ventricular end-diastolic volume, LVESV: left ventricular end-systolic volume, LVEF: left ventricular ejection fraction, E: peak velocity during early diastole of anterior mitral leaflet, A: peak velocity during late diastole of anterior mitral leaflet, e’Sep: peak early diastolic annular velocities at septum positions using TDI, a’Sep: peak late diastolic annular velocities at septum positions using TDI, e’lat: peak early diastolic annular velocities at lateral positions using TDI, a’lat: peak late diastolic annular velocities at lateral positions using TDI. 4-CH: Apical 4- chamber view
The values at baseline compared with those at 3 weeks after the final cycle of chemotherapy, *P<0.05.
The values at baseline compared with those at 6 weeks after the final cycle of chemotherapy, #P<0.05.
“+” indicates counter-clockwise rotation and “-” indicates clockwise rotation.
STE parameters
The STE parameters of the study groups at the three time points are listed in Table 2. The peak early-diastole LV wall velocity at baseline was significantly higher than at 3 weeks and 6 months after the final cycle of chemotherapy (Figure 1). Although there were no significant differences among the peak systolic longitudinal strains of the different myocardial layers, the values at baseline were higher than those at 3 weeks and 6 months after the final cycle of chemotherapy (Figure 2A, 2B and 2C). There were no differences among the peak longitudinal strain rates and displacements.
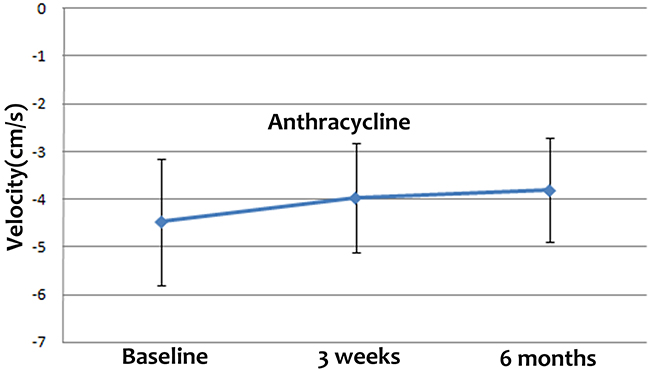
Figure 1: Peak early-diastole LV wall velocities at baseline and 3 weeks and 6 months after the final cycle of chemotherapy. The peak early-diastole LV wall velocity at baseline was significantly higher than at 3 weeks and 6 months after the final cycle of chemotherapy.
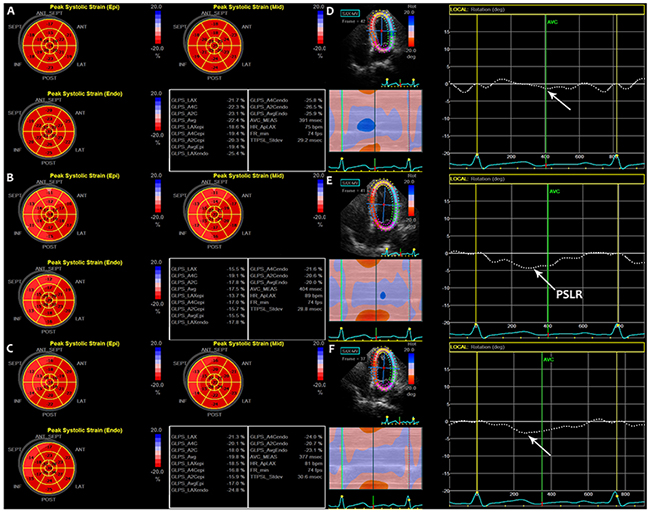
Figure 2: Bulls eye diagrams of the peak systolic strain of LV in the subendocardial, midmyocardial, and subepicardial layers at three time points (A, B, C). (A) At baseline, (B) 3 weeks after the final cycle of chemotherapy, and (C) 6 months after the final cycle of chemotherapy. Global PSLR in breast cancer patients at three separate time points (D, E, F). (D) At baseline, (E) 3 weeks after the final cycle of chemotherapy, and (F) 6 months after the final cycle of chemotherapy. PSLR: peak systolic longitudinal rotation.
Segmental and global PSLR
The segmental and global PSLR values of the study groups at the three time points are shown in Table 2. In the apical 4-chamber view, the lateral wall rotated counter-clockwise, whereas the septal wall rotated clockwise. The global PSLR at baseline was small, and significant differences were detected between the lateral wall and global PSLR values at baseline and those at 3 weeks and 6 months after the final cycle of chemotherapy (Figure 2D, 2E and 2F). The absolute value of the lateral wall PSLR at baseline was higher than the values at 3 weeks and 6 months after the final cycle of chemotherapy (Figure 3A), whereas the absolute value of the global PSLR at baseline was lower than the values at 3 weeks and 6 months after the final cycle of chemotherapy (Figure 3B). The values of the lateral wall and global PSLR did not change significantly from 3 weeks to 6 months after the final cycle of chemotherapy.
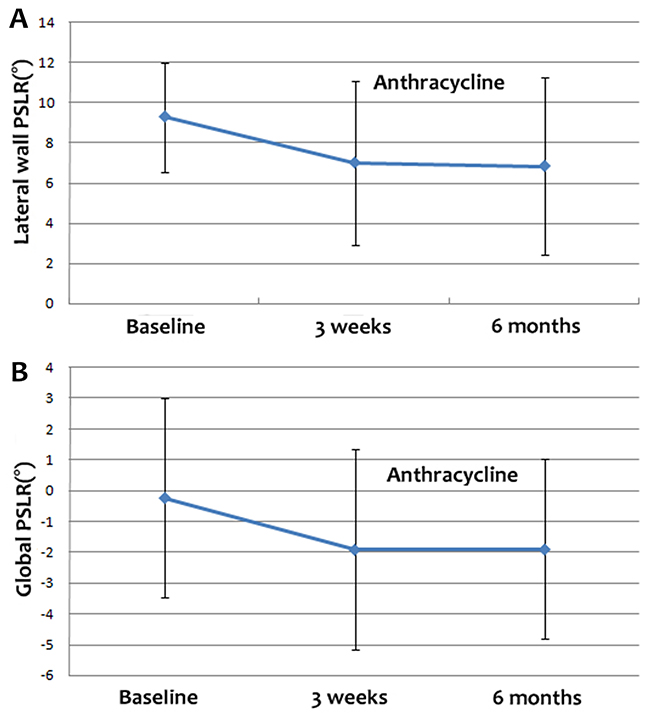
Figure 3: Lateral wall (A) and global PSLR (B) at baseline and 3 weeks and 6 months after the final cycle of chemotherapy. The absolute value of the lateral wall PSLR was higher at baseline than at 3 weeks and 6 months after the final cycle of chemotherapy, while the absolute value of the global PSLR at baseline was lower than at 3 weeks and 6 months after the final cycle of chemotherapy.
Correlations between the global PSLR and LVEF, E, A, E/A, e’sep, a’sep, e’lat, a’lat, E/ e’sep, E/ e’lat and cumulative dose of anthracycline
The results of correlation tests are listed in Table 3. At baseline, no correlation was found between the global PSLR and LVEF, E, A, E/A, e’sep, a’sep, e’lat, a’lat, E/ e’sep and E/ e’lat. However, at 3 weeks after the final cycle of chemotherapy, the global PSLR was positively correlated with the e’lat. Breast cancer patients with a higher e’lat were more likely to have a higher global PSLR (Figure 4A). At 6 months after the final cycle of chemotherapy, the global PSLR was positively correlated with e’sep and e’lat, and negatively correlated with E/e’sep and E/e’lat. Breast cancer patients with a higher e’sep and e’lat and lower E/e’sep and E/e’lat were more likely to have a higher global PSLR (Figure 4B, 4C, 4D and 4E).
Table 3: Correlations between global PSLR and 2D, Doppler values and cumulative dose of anthracycline.
Global PSLR |
||||||
|---|---|---|---|---|---|---|
Baseline |
3 weeks |
6 months |
||||
r |
p |
r |
p |
r |
p |
|
LVEF |
0.075 |
0.634 |
-0.211 |
0.175 |
-0.233 |
0.133 |
E |
-0.01 |
0.950 |
-0.038 |
0.811 |
-0.110 |
0.481 |
A |
-0.214 |
0.169 |
-0.046 |
0.770 |
-0.273 |
0.076 |
E/A |
0.155 |
0.322 |
0.044 |
0.779 |
0.078 |
0.617 |
e’Sep |
0.261 |
0.091 |
0.140 |
0.372 |
0.392 |
0.009 |
a’Sep |
-0.116 |
0.458 |
-0.258 |
0.095 |
-0.202 |
0.193 |
e’lat |
0.291 |
0.058 |
0.320 |
0.037 |
0.559 |
<0.001 |
a’lat |
0.094 |
0.548 |
-0.099 |
0.529 |
0.014 |
0.929 |
E/e’sep |
-0.272 |
0.078 |
-0.169 |
0.280 |
-0.508 |
0.001 |
E/e’lat |
-0.202 |
0.194 |
-0.258 |
0.070 |
-0.580 |
<0.001 |
Cumulative dose |
-0.180 |
0.248 |
-0.147 |
0.347 |
||
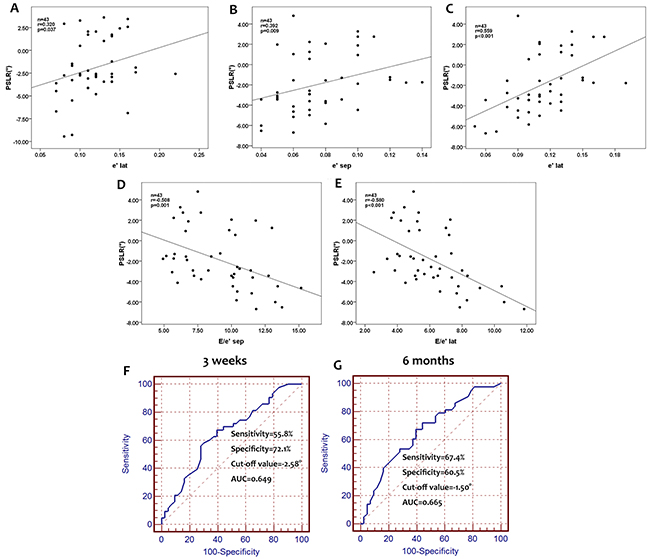
Figure 4: Correlation between global PSLR and e’lat at 3 weeks after the final cycle of chemotherapy. Global PSLR positively correlated with the e’lat at 3 weeks, and thus, breast cancer patients with a higher e’lat at 3 weeks after the final chemotherapy cycle may have a higher global PSLR (A). Correlations between global PSLR and e’sep, e’lat, E/e’sep, and E/e’lat at 6 months after the final cycle of chemotherapy. Global PSLR positively correlated with e’sep and e’lat and negatively correlated with E/e’sep and E/e’lat. Breast patients with a higher e’sep and e’lat, and lower E/e’sep and E/e’lat may have a higher global PSLR (B, C, D, E). ROC analysis for determining the accuracy of PSLR for identifying cardiac dysfunction in breast cancer patients. The sensitivity and specificity for a PSLR cut-off value of -2.58° at 3 weeks after the final cycle of chemotherapy were 55.8% and 72.1%, respectively, with an area under the ROC curve of 0.649 (F). At 6 months after the final cycle of chemotherapy, these values were 67.4% and 60.5% for a PSLR, cut-off value of -1.50°, with an area under the ROC curve of 0.665 (G).
ROC analysis for detecting the accuracy of PSLR for detecting cardiotoxicity in breast cancer patients
The areas under ROC curves (AUCs) were measured to determine the cut-off values for the global PSLR with the optimal sensitivity, specificity, and accuracy for assessing cardiotoxicity with regard to LV function. The AUC values at 3 weeks and 6 months after the final cycle of chemotherapy in breast cancer patients were 0.649 and 0.665, respectively. The optimal cut-off values for global PSLR at 3 weeks and 6 months after the final cycle of chemotherapy were -2.58° and -1.50°, respectively. The sensitivity and specificity for the global PSLR at 3 weeks after the final cycle of chemotherapy were 55.8% and 72.1%, respectively, and the corresponding values at 6 months after the final cycle of chemotherapy were 67.4% and 60.5%, respectively (Figure 4F and 4G).
Differing effects of epirubicin-based and therarubicin-based chemotherapy
The STE parameters of patients who received epirubicin-based chemotherapy are compared to those of patients who received therarubicin-based chemotherapy in Table 4. In the group that received epirubicin-based chemotherapy, the peak early-diastole LV wall velocity, and lateral wall and global PSLR differed significantly among the three time points; however, these values did not change significantly over time after therarubicin-based chemotherapy. The absolute value of the peak early-diastole LV wall velocity and the lateral wall PSLR at baseline were higher than those at 3 weeks and 6 months after the final cycle of chemotherapy, whereas the absolute value of global PSLR at baseline were lower than the values at 3 weeks and 6 months after the final cycle of chemotherapy in both the epirubicin-based and therarubicin-based chemotherapy groups. The values of these parameters did not differ significantly between 3 weeks and 6 months after the final cycle of chemotherapy (Figure 5A, 5B and 5C).
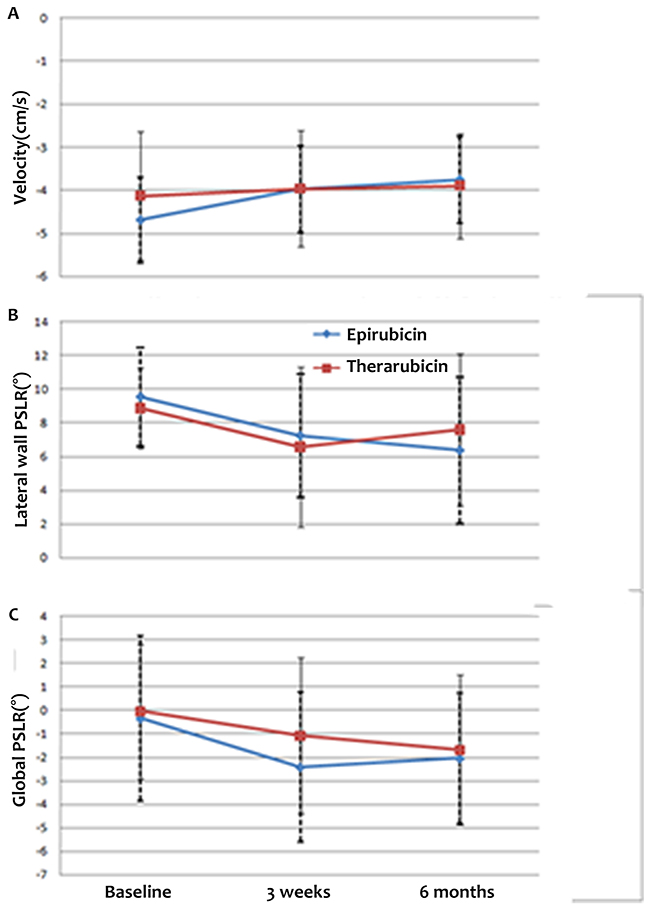
Figure 5: Differences in peak early-diastole LV wall velocity (A) and lateral wall (B) and global PSLR (C) after epirubicin-based chemotherapy versus therarubicin-based chemotherapy at baseline and 3 weeks and 6 months after the final cycle of chemotherapy. The absolute values of the peak early-diastole LV wall velocity and the lateral wall PSLR at baseline were higher than those at 3 weeks and 6 months after the final cycle of chemotherapy, whereas the absolute value of global PSLR at baseline was lower than at 3 weeks and 6 months after the final cycle of chemotherapy in both epirubicin-based and therarubicin-based chemotherapy groups.
Table 4: Detection of differences in epirubicin-based cardiotoxicity and therarubicin-based cardiotoxicity (mean±SD)
Variable |
Epirubicin |
Therarubicin |
||||||
|---|---|---|---|---|---|---|---|---|
Baseline |
3 weeks |
6 months |
P |
Baseline |
3 weeks |
6 months |
P |
|
Velocity (peak early-diastolic) (cm/s) |
-4.69±1.22*# |
-3.97±1.05 |
-3.76±1.02 |
0.007 |
-4.13±1.49 |
-3.97±1.35 |
-3.90±1.22 |
0.128 |
Lateral wall PSLR (°) |
9.55±2.93*# |
7.25±3.67 |
6.37±4.38 |
0.007 |
8.87±2.39 |
6.58±4.78 |
7.60±4.53 |
0.286 |
Global PSLR (°) |
-0.34±3.51* |
-2.41±3.18 |
-2.04±2.80 |
0.044 |
-0.04±2.88 |
-1.07±3.33 |
-1.67±3.19 |
0.344 |
Reproducibility and repeatability
The results for the intraobserver and interobserver variabilities for the global PSLR upon repeated measurements in all study patients are shown in Table 5.
Table 5: Interobserver and intraobserver reproducibility and repeatability
Variable |
Global PSLR(°) |
|||
|---|---|---|---|---|
Interobserver |
Intraobserver |
|||
Mean± SD |
95 % CI |
Mean ±SD |
95 % CI |
|
Baseline |
-0.19±0.49 |
-1.18~0.80 |
-0.19±0.48 |
-1.16~0.78 |
3 weeks |
-1.99±0.51 |
-3.02~-0.96 |
-1.87±0.50 |
-2.89~ -0.86 |
6 months |
-1.96±0.45 |
-2.86~-1.05 |
-1.90±0.44 |
-2.79~-1.01 |
DISCUSSION
As is well known, chemotherapy can reduce the recurrence of breast cancer, especially when used in combination with anthracyclines. However, the cardiotoxicity of anthracyclines is becoming a major concern. Early detection of cardiotoxicity is becoming increasingly important. The main findings of this study were: ① cardiac diastolic and systolic dysfunction was found in breast cancer patients after anthracycline-based chemotherapy; ② LR motion is a new parameter for detecting cardiotoxicity at 3 weeks and 6 months after the final cycle of chemotherapy; and ③ subgroup analysis indicated that the cardiotoxicity of epirubicin-based chemotherapy maybe stronger than that of therarubicin-based chemotherapy.
In clinical practice, LVEF is quantified as a measure of cardiac function. In the present study, we found that there were no significant differences in LVEF among the three time points. Thus, LVEF cannot be used in clinical practice for early detection of cardiotoxicity. With its angle independency and high reproducibility, STE is widely used for detection of cardiac function [16–18]. Ho et al [19] used STE to examine the long-term effects of standard chemotherapy on myocardial function in asymptomatic breast cancer survivors and found that the E/A ratio, global E’, and global longitudinal 2D strain were reduced in comparison with those of controls. Fallah-Rad et al [3] used cardiac biomarkers, tissue velocity (TVI), strain imaging, and CMRI to predict early LV dysfunction in breast cancer patients treated with adjuvant trastuzumab therapy. They found that the peak global longitudinal and radial strain decreased early in the group with trastuzumab-mediated cardiotoxicity. Portugal et al [16] used speckle tracking imaging to determine the relationship between global and regional longitudinal strain (GLS) and chemotherapy-induced cardiotoxicity in breast cancer patients and concluded that impaired GLS in patients with preserved LVEF was independently associated with an increased incidence of chemotherapy-induced cardiotoxicity. Our results were consistent with those of this previous research. Cardiac diastolic and systolic dysfunction was found after administration of anthracycline-based chemotherapy, based on lower values of e’Sep, peak early-diastolic LV wall velocity, and longitudinal strain in different myocardial layers at 3 weeks and 6 months after the final cycle of chemotherapy in comparison with the baseline values. The reasons for these results may be related to LV wall stress and local differences in the activation of signaling pathways involved in apoptosis or fibrosis.
LR, was first reported by Popović [20], represents the rotational motion in the long axis of the heart. In ischemic cardiomyopathy, dilated cardiomyopathy, and hypertension patients, as well as in acute myocardial ischemia animals, LR motion in the heart has been reported [21–23]. A normal myocardial fiber consists of longitudinal and circumferential fibers. Subendocardial and subepicardial myocardium are mainly composed of longitudinal fibers, and the middle layer is composed of circumferential fibers [24]. During systole and diastole, two motions are produced: short and long axis motions. In systole, when viewed from the apex, the apex rotates counter-clockwise, while the base rotates clockwise. This twisting motion of the left ventricle can be described as “the wringing of a linen cloth to squeeze out water” [15]. When viewed from its long axis, in systole, shortening of the long axis and thickening of the walls can be observed.
Previous studies indicated that the degree of PSLR in a normal heart is small, and our results agree with this [21–23]. The global PSLR at baseline in our study was -0.23±3.26°. At 3 weeks and 6 months after the final cycle of chemotherapy, the absolute values were higher than that at baseline. However, the value of the lateral wall PSLR at baseline was lower than those at 3 weeks and 6 months after the final cycle of chemotherapy. These results may demonstrate systolic dysfunction after anthracycline-based chemotherapy. The reason for such LR may be related to changes in the fiber arrangement by 3 weeks and 6 months after the final cycle of chemotherapy. Anthracyclines induce the formation of reactive oxygen species, which in excess can result in DNA and cytosolic damage, with subsequent loss of cellular integrity and apoptosis, inducing disarray and imbalance of the myocardial fibers [25].
In the present study, no correlations were found between the baseline values of global PSLR and LVEF, E, A, E/A, e’sep, a’sep, e’lat, a’lat, E/e’sep, E/e’lat and cumulative dose of anthracycline. At 3 weeks after the final cycle of chemotherapy, breast patients with a higher e’lat were more likely to have a higher global PSLR. At 6 months after the final cycle of chemotherapy, breast patients with higher e’sep and e’lat and lower E/e’sep and E/e’lat values were more likely to have a higher global PSLR. These findings indicated that although the LV filling pressure did not differ among the three time points, a lower LV filling pressure may correspond to a higher global PSLR.
The AUC values for PSLR at 3 weeks and 6 months after the final cycle of chemotherapy in breast cancer patients were 0.649 and 0.665, respectively. The sensitivity and specificity values for a PSLR cut-off value of -2.58° at 3 weeks after the final cycle of chemotherapy were 55.8% and 72.1%, respectively, and those for a PSLR cut-off value of -1.50° at 6 months after the final cycle of chemotherapy were 67.4% and 60.5%, respectively. From these results, we found that use of the global PSLR to detect cardiotoxicity after anthracycline-based chemotherapy was reliable.
When we compared parameters of cardiac function between the patients who received epirubicin-based and therarubicin-based chemotherapy, we found that after epirubicin-based chemotherapy, the peak early-diastole LV wall velocity and lateral wall and global PSLR differed significantly among the three time points. However, no differences between the time points were observed in patients who received therarubicin-based chemotherapy. The absolute values of peak early-diastole LV wall velocity and the lateral wall PSLR at baseline were higher than those at 3 weeks and 6 months after the final cycle of chemotherapy, whereas the absolute value of global PSLR at baseline was lower than those at 3 weeks and 6 months after the final cycle of chemotherapy, in both the epirubicin-based and therarubicin-based chemotherapy groups. From this, we found that the cardiotoxicity of epirubicin-based chemotherapy may be stronger than that of therarubicin-based chemotherapy.
Finally, the lack of significant differences in the values of cardiac function parameters between 3 weeks and 6 months after the final cycle of chemotherapy illustrated that the anthracycline-induced cardiotoxicity is irreversible. But to state this surely, more breast cancer patients should be increased and also it needs longer follow up.
MATERIALS AND METHODS
Study sample
This study was approved by the ethics committee of ChangZhou No. 2 People’s Hospital, affiliated to NanJing Medical University. All patients provided consent for participation in the study.
Forty-three female breast cancer patients were enrolled. The inclusion criteria were: ① treatment with epirubicin or therarubicin; and ② LVEF >50%. None of the patients had a history of cardiovascular disease, hypertension, or diabetes mellitus, all of them were asymptomatic before the chemotherapy; and ③ All enrolled breast cancer patients did not perform radiotherapy.
In total, the patients were evaluated at three separate time points: ① baseline: 1–3 days before the initiation of anthracycline-based chemotherapy; ② 3 weeks after the final cycle of chemotherapy; and ③ 6 months after the final cycle of chemotherapy.
Conventional 2D echocardiography
At each visit, all patients underwent conventional 2D echocardiography (Vivid E9, GE Healthcare). Interventricular septum thickness at end-diastole (IVSd), LV posterior wall thickness in end-diastole (LVPWd), and LV diameter at end-diastole (LVDd) and end-systole (LVSd) were measured in the parasternal long axis view of the LV by M-mode. Biplane Simpson’s method was used to measure the LV end-diastolic and systolic volume (LVEDV and LVESV) for calculation of the LVEF. The peak early and late diastolic mitral annular velocities (E and A, respectively) were measured by pulsed-wave Doppler, and the ratio of E/A was calculated. The peak early (e’) and late (a’) diastolic annular velocities were obtained at the septum (e’sep) and lateral (e’lat) positions using TDI, and E/ e’sep and E/ e’lat were measured.
In each group, ECG leads were connected to the patients. For offline analysis, the standard high frame rate (>36 /s) of the apical 3-, 4-, and 2-chamber views of three consecutive cycles were measured while patients held their breath.
Analysis of LV function
The apical 3-, 4-, and 2- chamber views were analyzed using 2D-STE software (2D-Strain, EchoPac PC 113, GE Healthcare, Horten, Norway) by one experienced cardiologist. The peak systolic and diastolic longitudinal velocities and strain rates as well as the peak systolic longitudinal strain of three different layers and displacement of LV were measured.
We defined LR as the global rotation of the LV cross section. Using the SAX-MV option of the Echopac in the apical 4-chamber view, the subendocardial layer was displayed. The software automatically created a region of interest (ROI) that included the subendocardial, midmyocardial, and subepicardial layers. The LV region was divided into five segments: base-septal, middle-septal, apex, middle-lateral, and base-lateral. The segmental and global PSLR of the LV was assessed via the software.
Statistical analysis
All data analyses were performed using SPSS 17.0 software (SPSS, Chicago, IL, USA). Data are presented as the mean ± standard deviation (SD). Any difference was considered statistically significant in all tests when the P-value was <0.05. Kolmogorov-Smirnov’s test was used to detect the normality of all the values. Differences among the values at the three separate time points were compared with one-way analysis of variance. Comparisons of two samples were made using the Student–Newman–Keuls test. We defined the global PSLR at the baseline as the normal state and considered the values at 3 weeks and 6 months after the final cycle of chemotherapy as the test values. The values for global PSLR of the heart in breast cancer patients were determined from receiver operating characteristic (ROC) curve analysis. Yoden’s index was used to determine the cut-off point with the best composite of specificity and sensitivity. Correlations between the global PSLR and LVEF, E, A, E/A, e’sep, a’sep, e’lat, a’lat, E/ e’sep, E/ e’lat, and cumulative dose of anthracycline were determined by Spearman’s correlation.
Reproducibility and repeatability
Intraobserver and interobserver variability for global PSLR were determined by repeating measurements in all enrolled breast cancer patients. For the second intraobserver measurements, the observer was “blinded” to results of the initial measurements.
CONCLUSIONS
In the present study, we found that patients experienced cardiac diastolic and systolic dysfunction after anthracycline-based chemotherapy, and the cardiotoxicity of epirubicin-based chemotherapy may be stronger than that of therarubicin-based chemotherapy. The PSLR represents a new parameter that can be used for detection of cardiotoxicity in breast cancer patients after anthracycline-based chemotherapy.
Abbreviations
LV: Left ventricular; LVEF: Left ventricular ejection fraction; TDI: Tissue Doppler imaging; STE: Speckle tracking echocardiography; CMRI: Cardiac magnetic resonance imaging; LR: Longitudinal rotation; PSLR: Peak systolic longitudinal rotation; GLS: Global longitudinal strain; IVSd: Interventricular septum thickness at end-diastole; LVPWd: Left ventricular posterior wall thickness at end-diastole; LVDd: Left ventricular diameter at end-diastole; LVSd: Left ventricular diameter at end-systole; LVEDV: Left ventricular end-diastolic volume; LVESV: Left ventricular end-systolic volume.
Author contributions
Huang Jun and Yan Zi-Ning designed the study and carried out the study, data collection and analysis, Huang Jun wrote and revised the manuscript. Rui Yi-Fei, Shen Dan and Fan Li designed part of the experiments, and collected the breast cancer patients. Huang Jun and Chen Dong-Liang performed the statistical analysis.
ACKNOWLEDGMENTS
The authors would like to thank the department of Echocardiography and Breast Surgery, ChangZhou No. 2 People’s Hospital Affiliated to NanJing Medical University.
CONFLICTS OF INTEREST
The authors declare that they have no conflicts of interest.
FUNDING
None
REFERENCES
1. Jemal A, Bray F, Center MM, Ferlay J, Ward E, Forman D. Global cancer statistics. CA Cancer J Clin. 2011; 61: 69-90.
2. Sardaro A, Petruzzelli MF, D’Errico MP, Grimaldi L, Pili G, Portaluri M. Radiation-induced cardiac damage in early left breast cancer patients: risk factors, biological mechanisms, radiobiology, and dosimetric constraints. Radiother Oncol. 2012; 103: 133-142
3. Fallah-Rad N, Walker JR, Wassef A, Lytwyn M, Bohonis S, Fang T, Tian G, Kirkpatrick ID, Singal PK, Krahn M, Grenier D, Jassal DS. The utility of cardiac biomarkers, tissue velocity and strain imaging, and cardiac magnetic resonance imaging in predicting early left ventricular dysfunction in patients with human epidermal growth factor receptor II-positive breast cancer treated with adjuvant trastuzumab therapy. J Am Coll Cardiol. 2011; 57: 2263-2270.
4. Hooning MJ, Botma A, Aleman BM, Baaijens MH, Bartelink H, Klijn JG, Taylor CW, van Leeuwen FE. Long-term risk of cardiovasculardisease in 10-year survivors of breast cancer. J Natl Cancer Inst. 2007; 99: 365-375.
5. Thavendiranathan P, Poulin F, Lim KD, Plana JC, Woo A, Marwick TH. Use of myocardial strain imaging by echocardiography for the early detection of cardiotoxicity in patients during and after cancer chemotherapy: a systematic review. J Am Coll Cardiol. 2014; 63: 2751-2768.
6. Florescu M, Magda LS, Enescu OA, Jinga D, Vinereanu D. Early detection of epirubicin-induced cardiotoxicity in patients with breast cancer. J Am Soc Echocardiogr. 2014; 27: 83-92.
7. Vulsteke C, Pfeil AM, Maggen C, Schwenkglenks M, Pettengell R, Szucs TD, Lambrechts D, Dieudonné AS, Hatse S, Neven P, Paridaens R, Wildiers H. Clinical and genetic risk factors for epirubicin-induced cardiac toxicity in early breast cancer patients. Breast Cancer Res Treat. 2015; 152: 67-76.
8. Mornoş C, Petrescu L. Early detection of anthracycline-mediated cardiotoxicity: the value of considering both global longitudinal left ventricular strain and twist. Can J Physiol Pharmacol. 2013; 91: 601-607.
9. Seidman A, Hudis C, Pierri MK, Shak S, Paton V, Ashby M, Murphy M, Stewart SJ, Keefe D. Cardiac dysfunction in the trastuzumab clinical trials experience. J Clin Oncol. 2002; 20: 1215–1221.
10. Nesbitt GC, Mankad S, Oh JK. Strain imaging in echocardiography: methods and clinical applications. Int J Cardiovasc Imaging. 2009; 25: 9-22.
11. Plana JC. Chemotherapy and the heart. Rev Esp Cardiol. 2011; 64: 409-415.
12. Jurcut R, Wildiers H, Ganame J, D’hooge J, Paridaens R, Voigt JU. Detection and monitoring of cardiotoxicity-what does modern cardiology offer? Support Care Cancer. 2008; 16: 437-445.
13. Notomi Y, Lysyansky P, Setser RM, Shiota T, Popović ZB, Martin-Miklovic MG, Weaver JA, Oryszak SJ, Greenberg NL, White RD, Thomas JD. Measurement of ventricular torsion by two-dimensional ultrasound speckle tracking imaging. J Am Coll Cardiol. 2005; 45: 2034-2041.
14. Hurlburt HM, Aurigemma GP, Hill JC, Narayanan A, Gaasch WH, Vinch CS, Meyer TE, Tighe DA. Direct ultrasound measurement of longitudinal, circumferential, and radial strain using 2-dimensional strainimaging in normal adults. Echocardiography. 2007; 4: 723-731.
15. Sengupta PP, Tajik AJ, Chandrasekaran K, Khandheria BK. Twist mechanics of the left ventricle: principles and application. JACC Cardiovasc Imaging. 2008; 1: 366-376.
16. Portugal G, Moura Branco L, Galrinho A, Mota Carmo M, Timóteo AT, Feliciano J, Abreu J, Duarte Oliveira S, Batarda L, Cruz Ferreira R. Global and regional patterns of longitudinal strain in screening for chemotherapy-induced cardiotoxicity. Rev Port Cardiol. 2017; 36: 9-15.
17. Tang Q, Jiang Y, Xu Y, Xia H. Speckle tracking echocardiography predicts early subclinical anthracycline cardiotoxicity in patients with breast cancer. J Clin Ultrasound. 2017; 45:222-230.
18. Tuohinen SS, Skyttä T, Poutanen T, Huhtala H, Virtanen V, Kellokumpu-Lehtinen PL, Raatikainen P. Radiotherapy-induced global and regional differences in early-stage left-sided versus right-sided breast cancer patients: speckle tracking echocardiography study. Int J Cardiovasc Imaging. 2017; 33:463-472.
19. Ho E, Brown A, Barrett P, Morgan RB, King G, Kennedy MJ, Murphy RT. Subclinical anthracycline- and trastuzumab-induced cardiotoxicity in the long-term follow-up of asymptomatic breast cancer survivors: a speckle tracking echocardiographic study. Heart. 2010; 96: 701-777.
20. Popović ZB, Grimm RA, Ahmad A, Agler D, Favia M, Dan G, Lim P, Casas F, Greenberg NL, Thomas JD. Longitudinal rotation: an unrecognised motion pattern in patients with dilated cardiomyopathy. Heart. 2007; 94: 1-6.
21. Huang J, Yan ZN, Ni XD, Hu YP, Rui YF, Fan L, Shen D, Chen DL. Left ventricular longitudinal rotation changes in primary hypertension patients with normal left ventricular ejection fraction detected by two-dimensional speckle tracking imaging. J Hum Hypertens. 2016; 30: 30-34.
22. Huang J, Ni XD, Hu YP, Song ZW, Yang WY, Xu R. Left ventricular longitudinal rotation changes in patients with dilated cardiography detected by two dimensional speckle tracking imaging. Zhonghua Xin Xue Guan Bing Za Zhi. 2011; 39: 920-924.
23. Huang J, Yan ZN, Fan L, Song XT, Rui YF, Shen D, Chen DL. Assessment of left ventriculnr funcfion and longitudinal rotation in rabbits after acute occlusion of left anterior descending artery by two-dimensional speckle tracking imaging. Chin J Thorac Cardiovasc Surg. 2013; 29: 96-98.
24. Sengupta PP, Khandheria BK, Narula J. Twist and untwist mechanics ofthe left ventricle. Heart Fail Clin. 2008; 4: 315-324.
25. Barry E, Alvarez JA, Scully RE, Miller TL, Lipshultz SE. Anthracycline-induced cardiotoxicity: course, pathophysiology, prevention and management. Expert Opin Pharmacother. 2007; 8: 1039-1058.